| Param | Original file | Final file |
|---|---|---|
| Filename | modeM0/AS1T03_003T01_9000002712_18206cztM0_level2.evt | modeM0/AS1T03_003T01_9000002712_18206cztM0_level2_quad_clean.evt |
| Size (bytes) | 485,017,920 | 96,920,640 |
| Size | 462.5 MB | 92.4 MB |
| Events in quadrant A | 3,341,787 | 626,981 |
| Events in quadrant B | 3,322,406 | 638,292 |
| Events in quadrant C | 3,204,311 | 608,069 |
| Events in quadrant D | 4,370,064 | 599,587 |
| Mode M9 | |||
|---|---|---|---|
| Quadrant | BADHDUFLAG | Total packets | Discarded packets |
| A | 0 | 17 | 0 |
| B | 0 | 18 | 0 |
| C | 0 | 18 | 0 |
| D | 0 | 18 | 0 |
| Mode M0 | |||
|---|---|---|---|
| Quadrant | BADHDUFLAG | Total packets | Discarded packets |
| A | 0 | 14071 | 2 |
| B | 0 | 13960 | 3 |
| C | 0 | 13653 | 2 |
| D | 0 | 17388 | 2 |
| Mode SS | |||
|---|---|---|---|
| Quadrant | BADHDUFLAG | Total packets | Discarded packets |
| A | 0 | 134 | 0 |
| B | 0 | 134 | 0 |
| C | 0 | 134 | 0 |
| D | 0 | 134 | 0 |
| Quadrant | Total seconds | Saturated seconds | Saturation percentage |
|---|---|---|---|
| A | 6633 | 73 | 1.100558% |
| B | 6632 | 83 | 1.251508% |
| C | 6632 | 71 | 1.070567% |
| D | 6632 | 279 | 4.206876% |
Noise dominated data is calculated using 1-second bins in cleaned event files. If a bin has >2000 counts, and if more than 50% of those come from <1% of pixels, then it is considered to be noise-dominated and hence unusable.
| Quadrant | # 1 sec bins | Bins with >0 counts | Bins with >2000 counts | High rate bins dominated by noise | Noise dominated (total time) | Noise dominated (detector-on time) | Marked lightcurve |
|---|---|---|---|---|---|---|---|
| A | 7783 | 6634 | 12 | 12 | 0.15% | 0.18% | 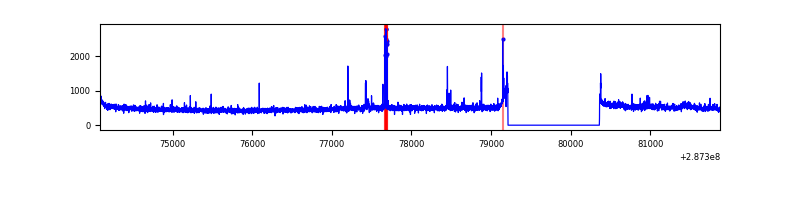 |
| B | 7782 | 6633 | 17 | 17 | 0.22% | 0.26% | 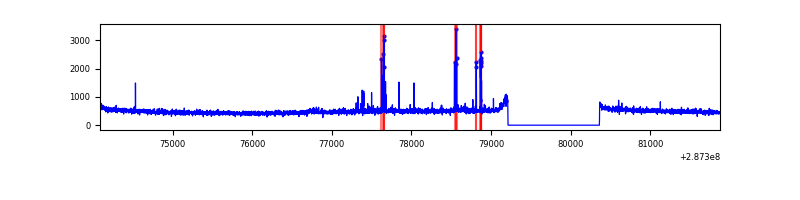 |
| C | 7782 | 6633 | 0 | 0 | 0.00% | 0.00% | 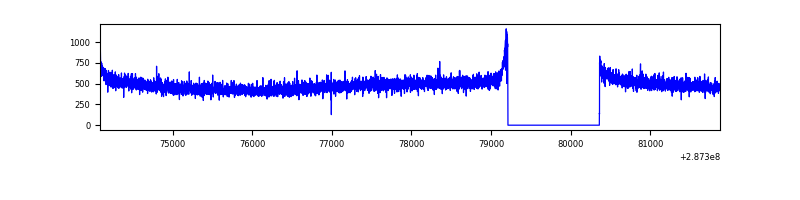 |
| D | 7782 | 6633 | 190 | 190 | 2.44% | 2.86% | 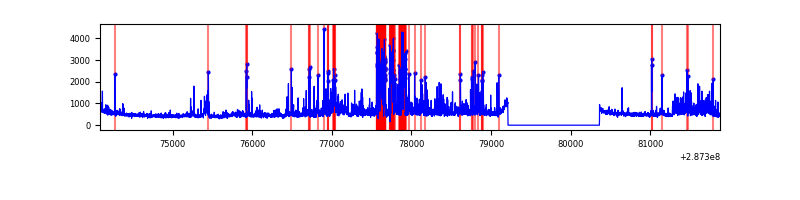 |
Top three noisy pixels from each quadrant. If the there are fewer than three noisy pixels in the level2.evt file, extra rows are filled as -1
| Pixel properties | Quadrant properties | ||||||
|---|---|---|---|---|---|---|---|
| Quadrant | DetID | PixID | Counts | Sigma | Mean | Median | Sigma |
| A | 15 | 174 | 146014 | 866.77 | 831 | 814 | 167.5 |
| A | 0 | 226 | 7459 | 39.67 | 831 | 814 | 167.5 |
| A | 12 | 194 | 6106 | 31.59 | 831 | 814 | 167.5 |
| B | 7 | 220 | 69491 | 440.81 | 824 | 804 | 155.8 |
| B | 0 | 197 | 22515 | 139.33 | 824 | 804 | 155.8 |
| B | 12 | 111 | 18405 | 112.96 | 824 | 804 | 155.8 |
| C | 14 | 238 | 123438 | 663.67 | 788 | 794 | 184.8 |
| C | 13 | 61 | 5669 | 26.38 | 788 | 794 | 184.8 |
| C | 3 | 233 | 5502 | 25.48 | 788 | 794 | 184.8 |
| D | 5 | 222 | 614514 | 3212.63 | 789 | 768 | 191.0 |
| D | 7 | 238 | 409765 | 2140.88 | 789 | 768 | 191.0 |
| D | 1 | 52 | 284724 | 1486.36 | 789 | 768 | 191.0 |
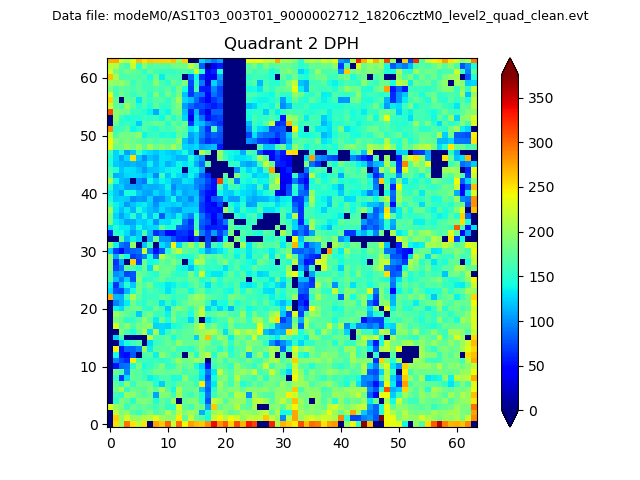
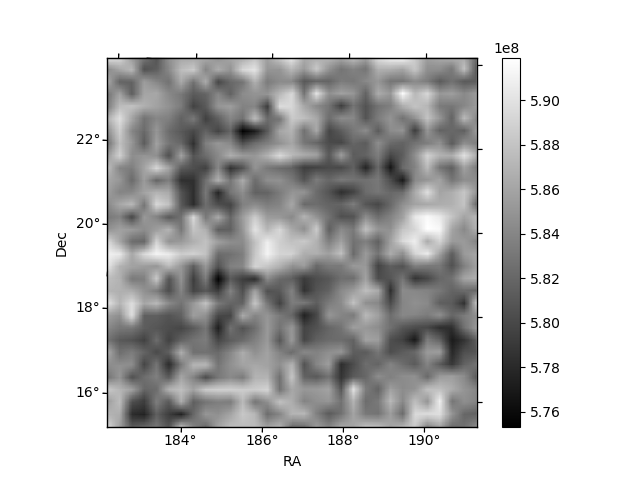
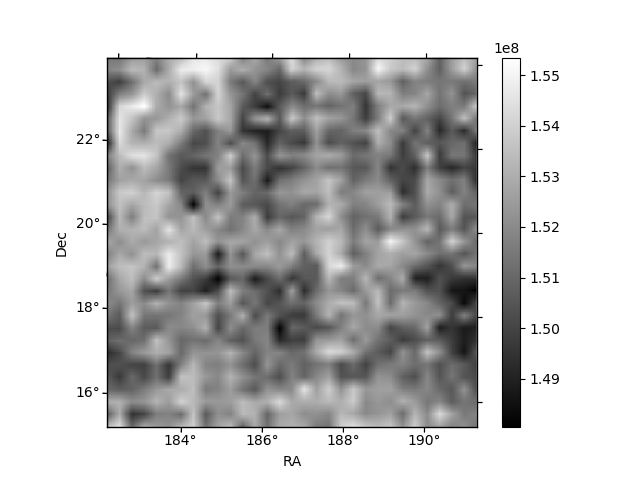
Histogram calculated using DETX and DETY for each event in the final _common_clean file
| Quadrant A | 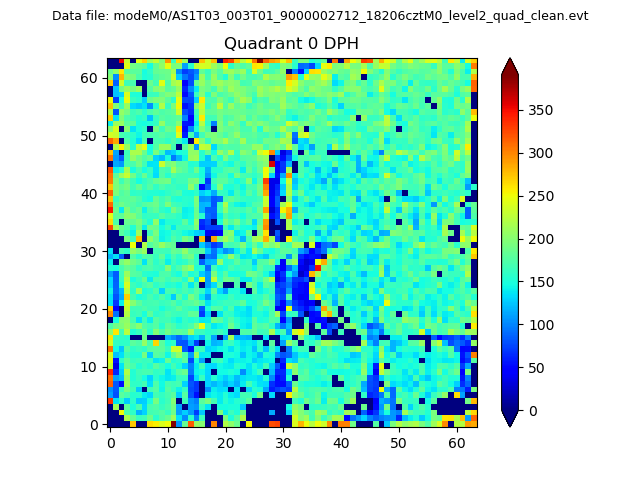 |
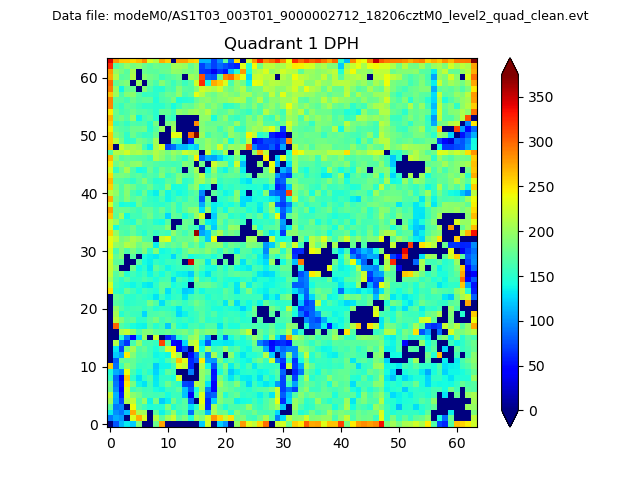 |
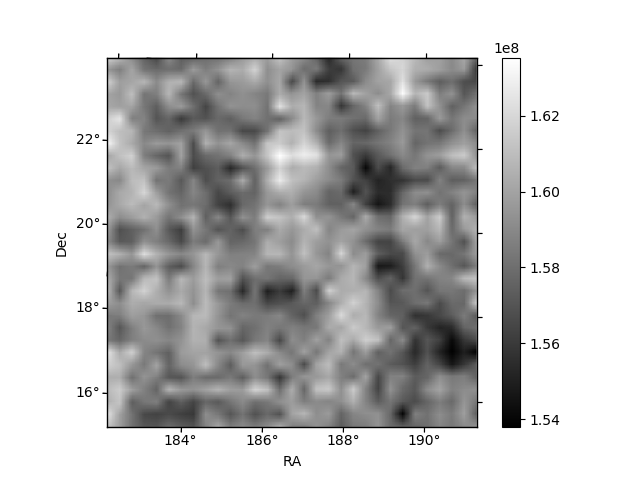
Quadrant B |
|---|---|---|---|
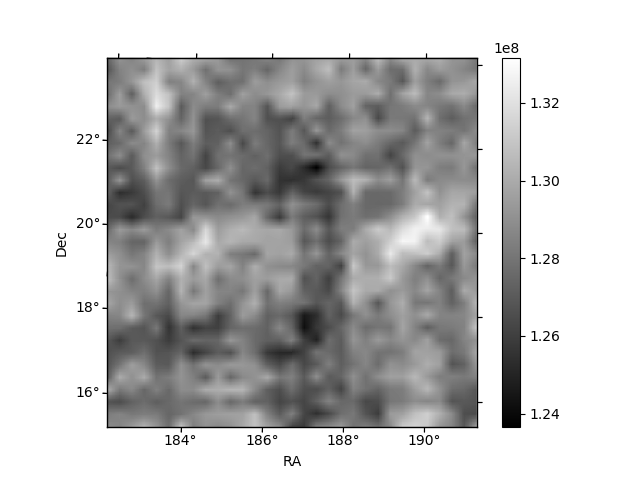
| Quadrant D | 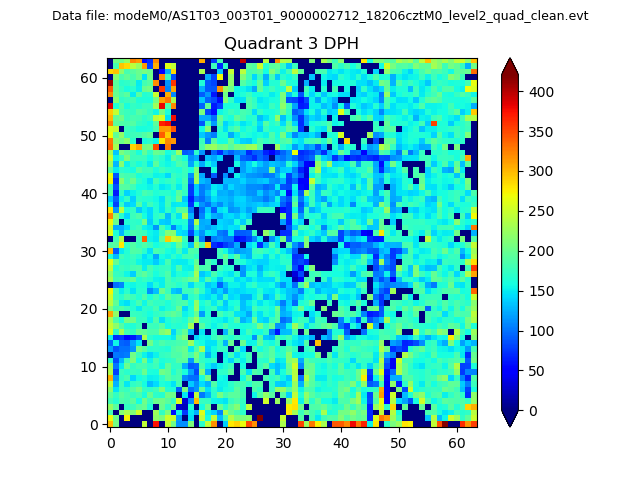 |
 |
Quadrant C |
| Plot type | Count rate plots | Images |
|---|---|---|
| Comparison with Poisson distribution Blue bars denote a histogram of data divided into 1 sec bins. Red curve is a Poisson curve with rate = median count rate of data. |
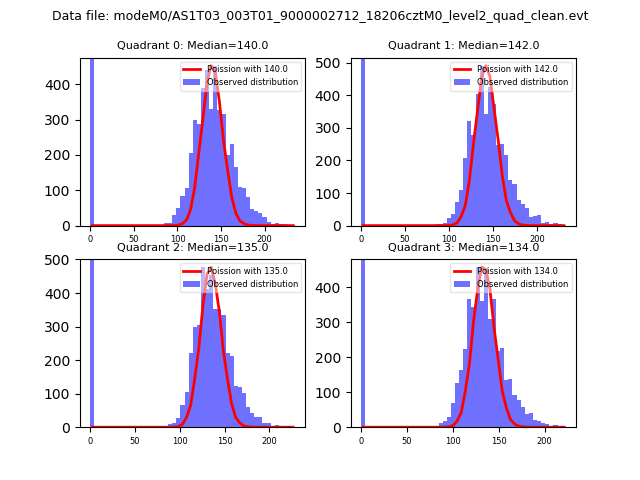 |
 |
| Quadrant-wise count rates Data is divided into 100 sec bins |
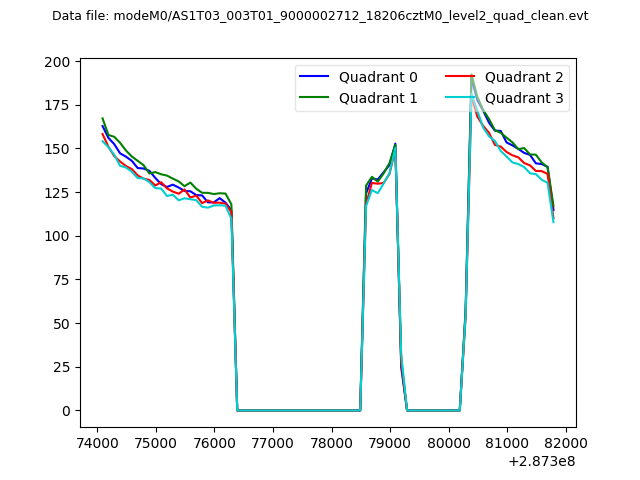 |
|
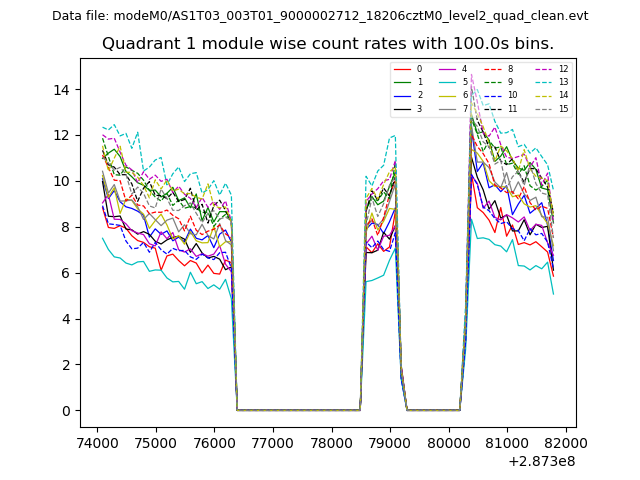
| Module-wise count rates for Quadrant A Data is divided into 100 sec bins |
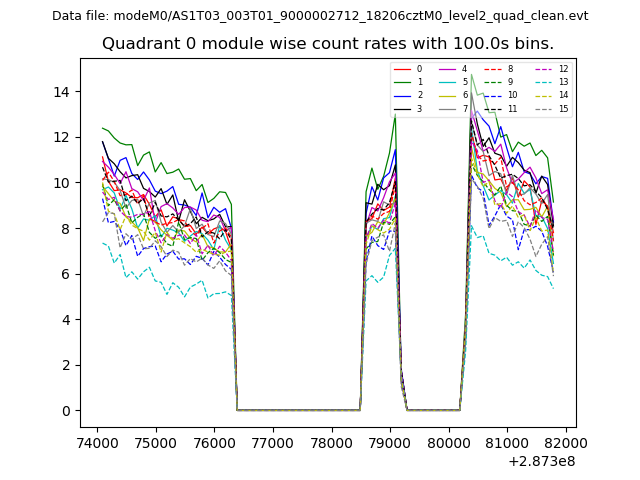 |
 |
| Module-wise count rates for Quadrant B Data is divided into 100 sec bins |
 |
 |
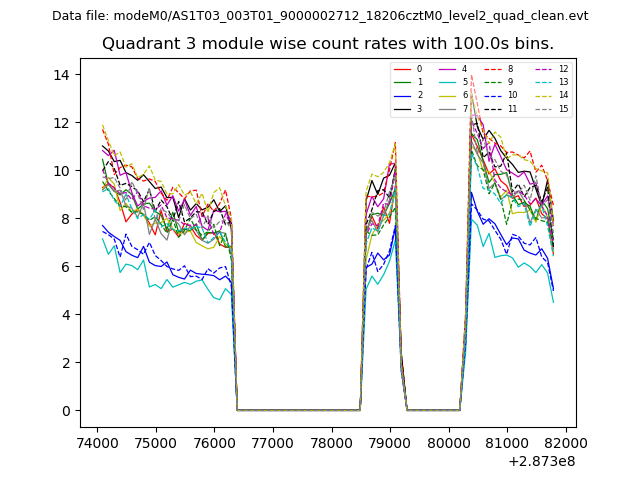
| Module-wise count rates for Quadrant C Data is divided into 100 sec bins |
 |
 |
| Module-wise count rates for Quadrant D Data is divided into 100 sec bins |
 |
 |
| Parameter | Plot |
|---|---|
| CZT HV Monitor | 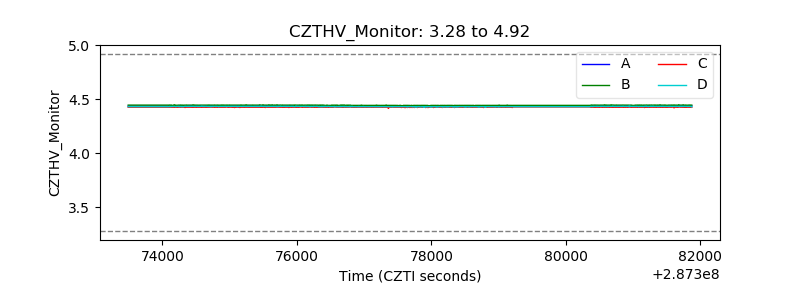 |
| D_VDD | 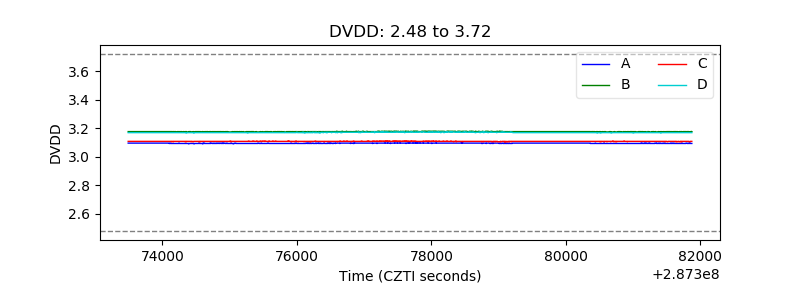 |
| Temperature 1 | 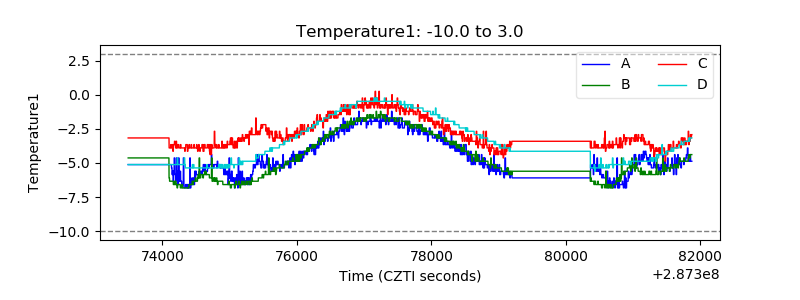 |
| Veto HV Monitor | 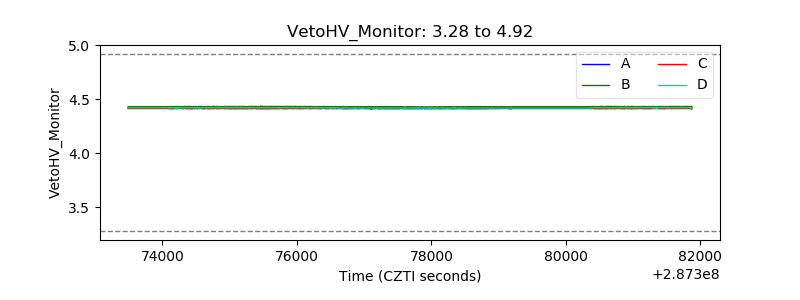 |
| Veto LLD | 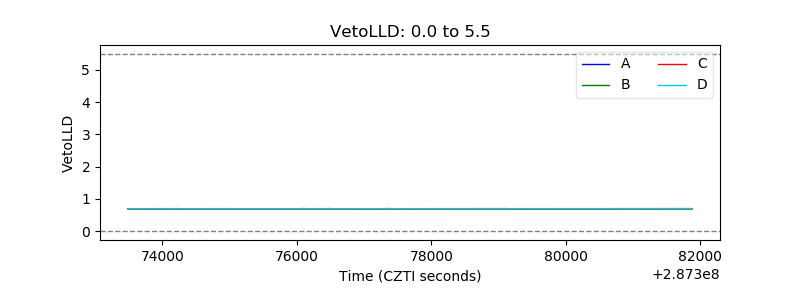 |
| Alpha Counter |  |
| _CPM_Rate | 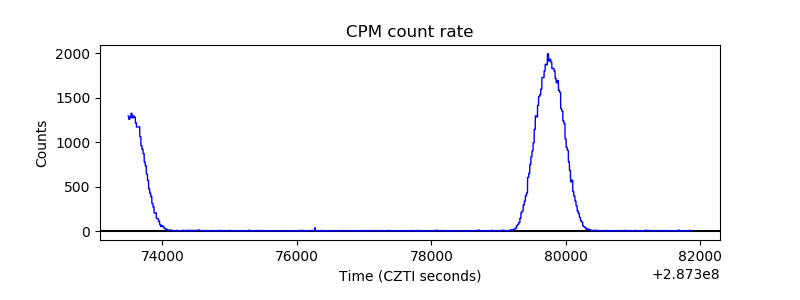 |
| CZT Counter |  |
| +2.5 Volts monitor |  |
| +5 Volts monitor |  |
| _ROLL_ROT | 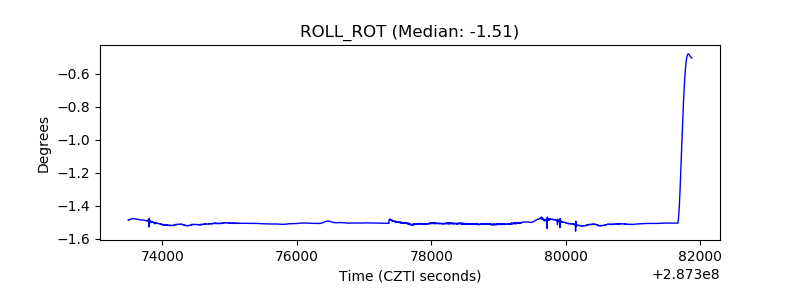 |
| _Roll_DEC | 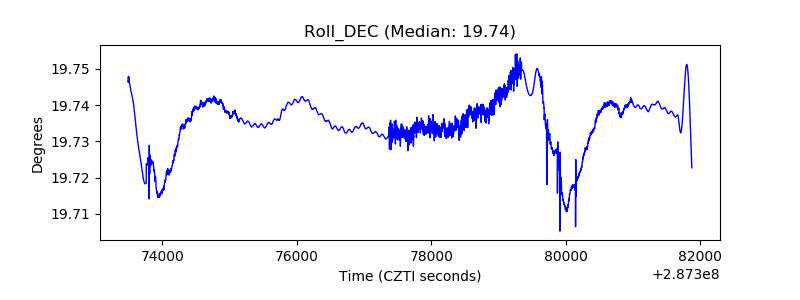 |
| _Roll_RA |  |
| Veto Counter | 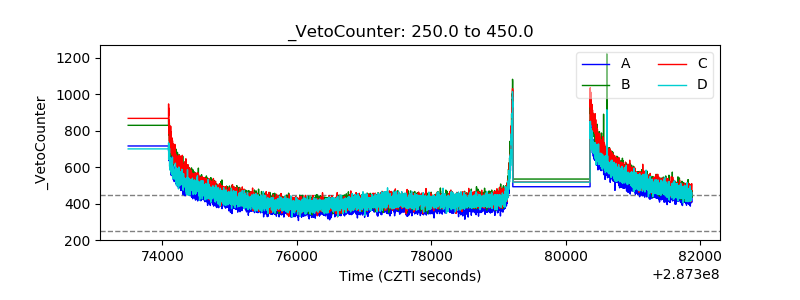 |