| Param | Original file | Final file |
|---|---|---|
| Filename | modeM0/AS1T03_003T01_9000002712_18207cztM0_level2.evt | modeM0/AS1T03_003T01_9000002712_18207cztM0_level2_quad_clean.evt |
| Size (bytes) | 500,529,600 | 99,057,600 |
| Size | 477.3 MB | 94.5 MB |
| Events in quadrant A | 3,421,853 | 655,201 |
| Events in quadrant B | 3,402,938 | 657,574 |
| Events in quadrant C | 3,244,755 | 627,780 |
| Events in quadrant D | 4,654,137 | 611,978 |
| Mode M9 | |||
|---|---|---|---|
| Quadrant | BADHDUFLAG | Total packets | Discarded packets |
| A | 0 | 18 | 0 |
| B | 0 | 19 | 0 |
| C | 0 | 19 | 0 |
| D | 0 | 19 | 0 |
| Mode M0 | |||
|---|---|---|---|
| Quadrant | BADHDUFLAG | Total packets | Discarded packets |
| A | 0 | 13899 | 2 |
| B | 0 | 13791 | 2 |
| C | 0 | 13365 | 2 |
| D | 0 | 18023 | 2 |
| Mode SS | |||
|---|---|---|---|
| Quadrant | BADHDUFLAG | Total packets | Discarded packets |
| A | 0 | 130 | 0 |
| B | 0 | 130 | 0 |
| C | 0 | 130 | 0 |
| D | 0 | 130 | 0 |
| Quadrant | Total seconds | Saturated seconds | Saturation percentage |
|---|---|---|---|
| A | 6414 | 66 | 1.028999% |
| B | 6414 | 62 | 0.966635% |
| C | 6414 | 61 | 0.951045% |
| D | 6414 | 201 | 3.133770% |
Noise dominated data is calculated using 1-second bins in cleaned event files. If a bin has >2000 counts, and if more than 50% of those come from <1% of pixels, then it is considered to be noise-dominated and hence unusable.
| Quadrant | # 1 sec bins | Bins with >0 counts | Bins with >2000 counts | High rate bins dominated by noise | Noise dominated (total time) | Noise dominated (detector-on time) | Marked lightcurve |
|---|---|---|---|---|---|---|---|
| A | 7684 | 6415 | 11 | 11 | 0.14% | 0.17% | 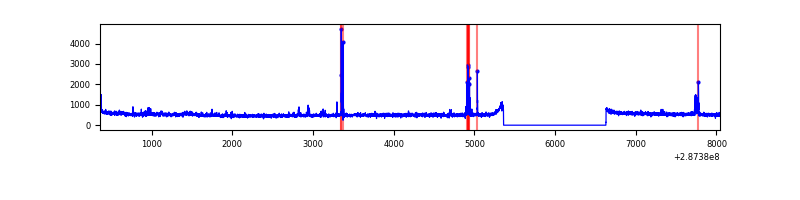 |
| B | 7684 | 6415 | 3 | 3 | 0.04% | 0.05% | 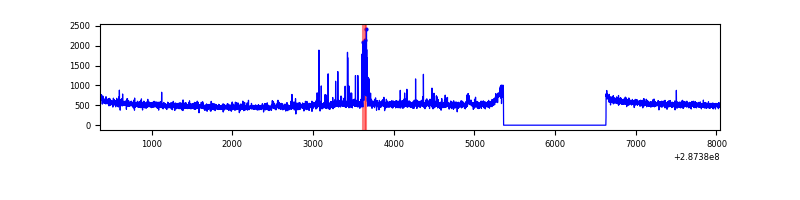 |
| C | 7684 | 6415 | 0 | 0 | 0.00% | 0.00% | 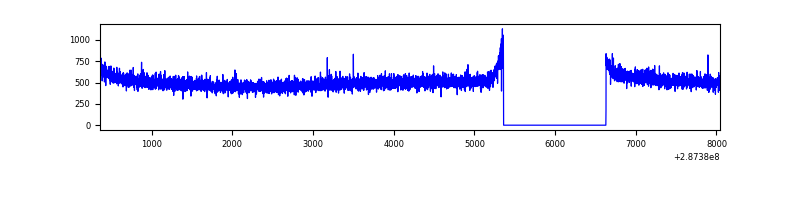 |
| D | 7684 | 6415 | 150 | 150 | 1.95% | 2.34% | 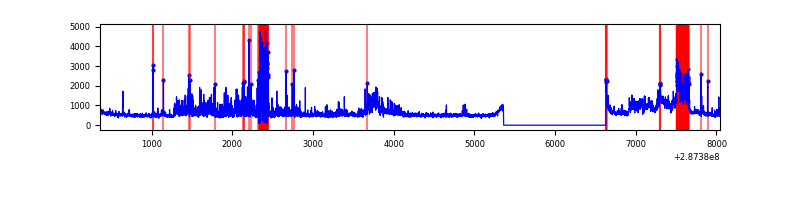 |
Top three noisy pixels from each quadrant. If the there are fewer than three noisy pixels in the level2.evt file, extra rows are filled as -1
| Pixel properties | Quadrant properties | ||||||
|---|---|---|---|---|---|---|---|
| Quadrant | DetID | PixID | Counts | Sigma | Mean | Median | Sigma |
| A | 15 | 174 | 159688 | 934.89 | 848 | 833 | 169.9 |
| A | 0 | 226 | 7585 | 39.74 | 848 | 833 | 169.9 |
| A | 12 | 194 | 6289 | 32.11 | 848 | 833 | 169.9 |
| B | 7 | 220 | 69006 | 431.03 | 834 | 815 | 158.2 |
| B | 0 | 189 | 45251 | 280.88 | 834 | 815 | 158.2 |
| B | 12 | 111 | 17912 | 108.07 | 834 | 815 | 158.2 |
| C | 14 | 238 | 126806 | 684.12 | 798 | 806 | 184.2 |
| C | 3 | 233 | 6164 | 29.09 | 798 | 806 | 184.2 |
| C | 13 | 61 | 5654 | 26.32 | 798 | 806 | 184.2 |
| D | 7 | 238 | 650348 | 3295.49 | 810 | 788 | 197.1 |
| D | 1 | 52 | 451263 | 2285.45 | 810 | 788 | 197.1 |
| D | 5 | 222 | 425270 | 2153.57 | 810 | 788 | 197.1 |
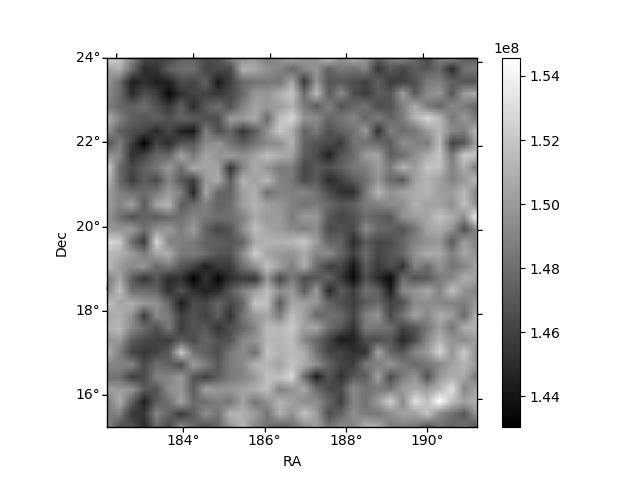
Histogram calculated using DETX and DETY for each event in the final _common_clean file
| Quadrant A | 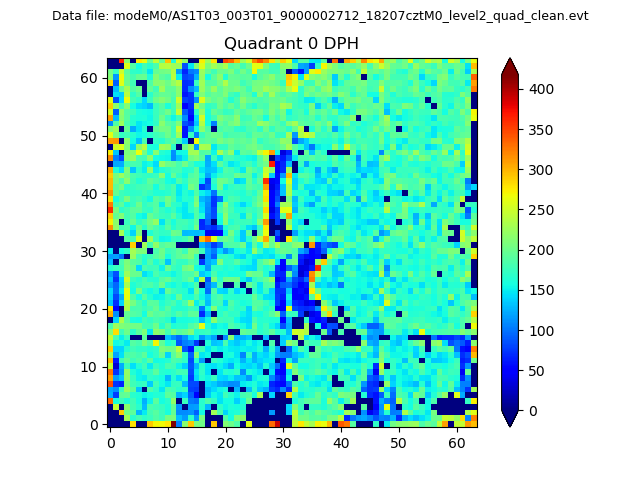 |
 |
Quadrant B |
|---|---|---|---|
| Quadrant D | 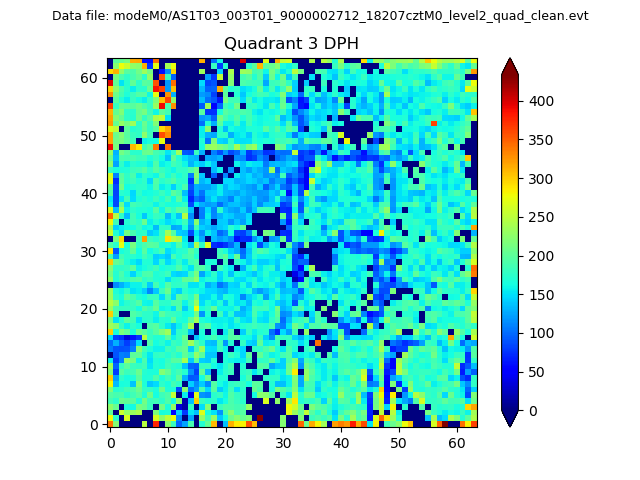 |
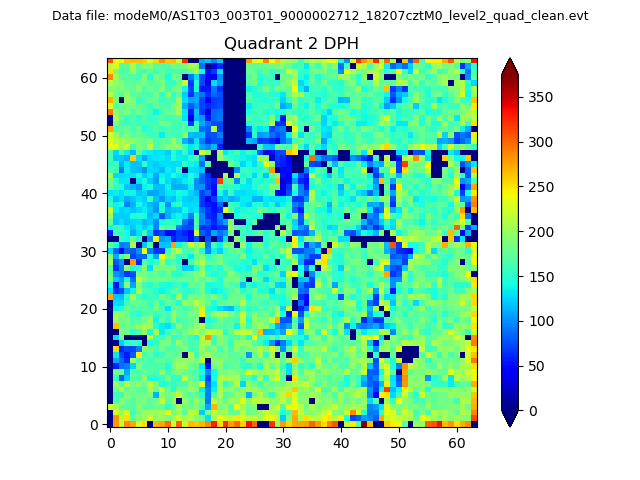 |
Quadrant C |
| Plot type | Count rate plots | Images |
|---|---|---|
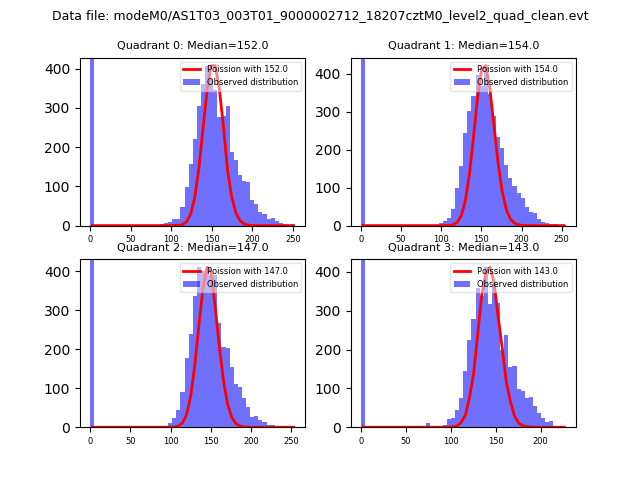
| Comparison with Poisson distribution Blue bars denote a histogram of data divided into 1 sec bins. Red curve is a Poisson curve with rate = median count rate of data. |
 |
 |
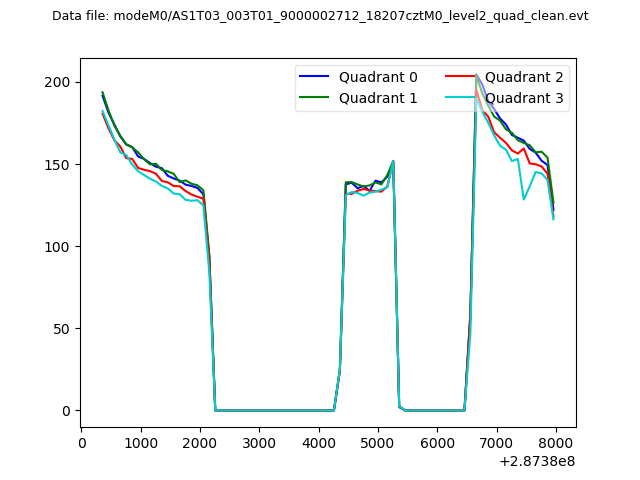
| Quadrant-wise count rates Data is divided into 100 sec bins |
 |
|
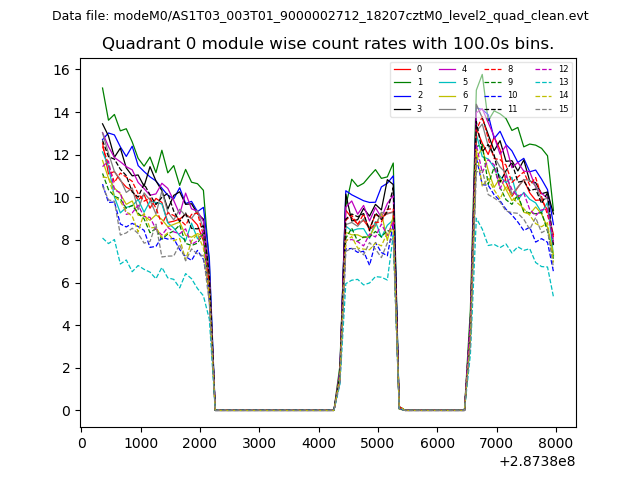
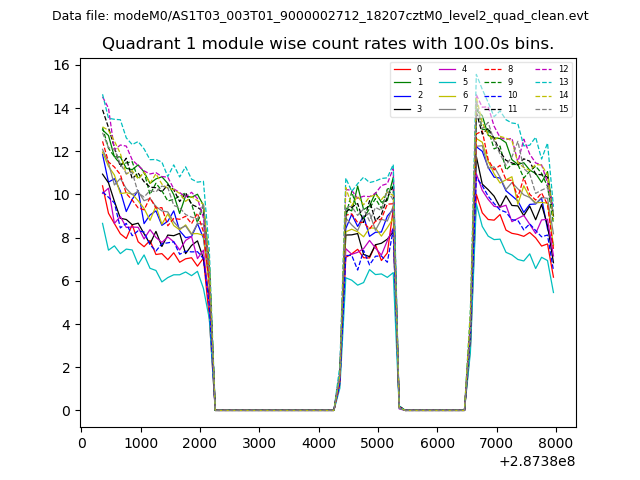
| Module-wise count rates for Quadrant A Data is divided into 100 sec bins |
 |
 |
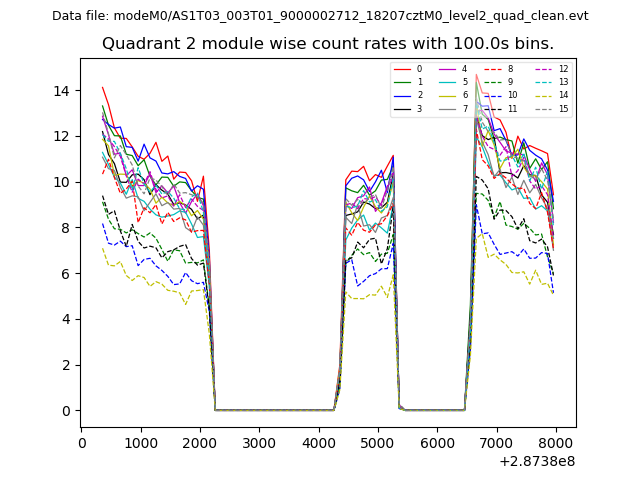
| Module-wise count rates for Quadrant B Data is divided into 100 sec bins |
 |
 |
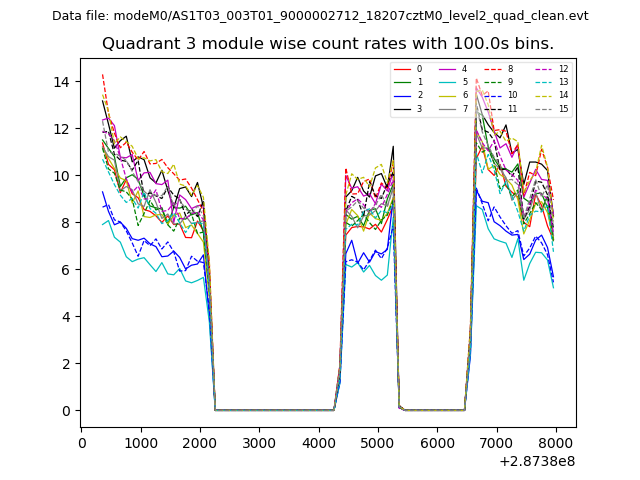
| Module-wise count rates for Quadrant C Data is divided into 100 sec bins |
 |
 |
| Module-wise count rates for Quadrant D Data is divided into 100 sec bins |
 |
 |
| Parameter | Plot |
|---|---|
| CZT HV Monitor | 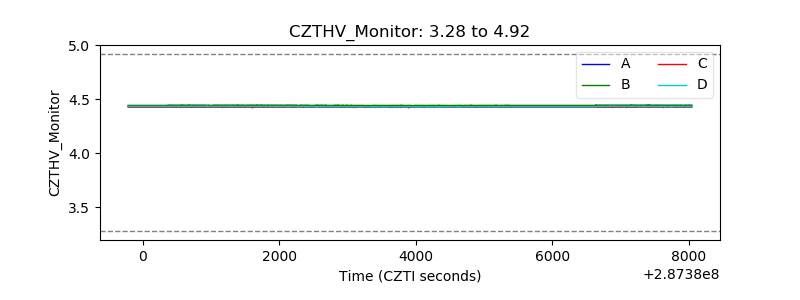 |
| D_VDD | 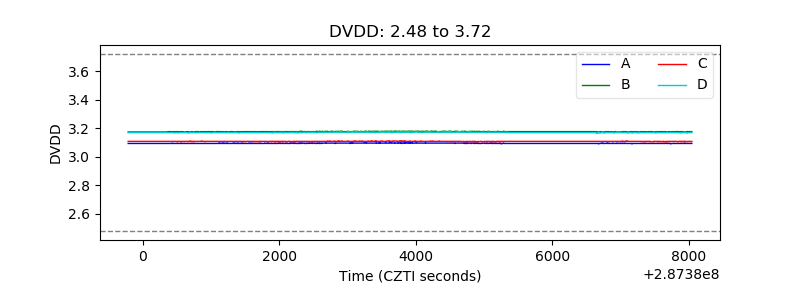 |
| Temperature 1 | 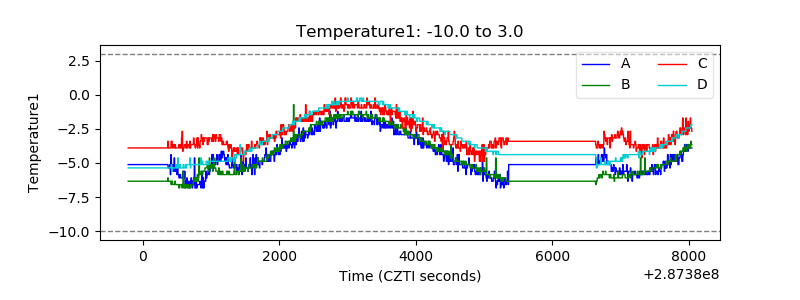 |
| Veto HV Monitor |  |
| Veto LLD | 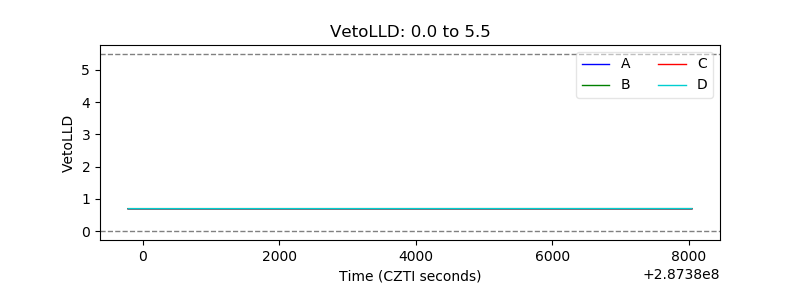 |
| Alpha Counter |  |
| _CPM_Rate | 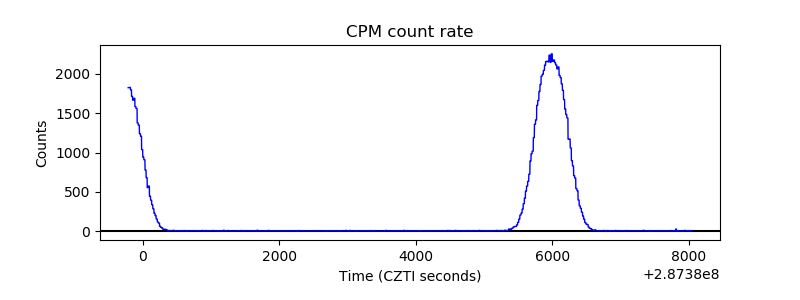 |
| CZT Counter | 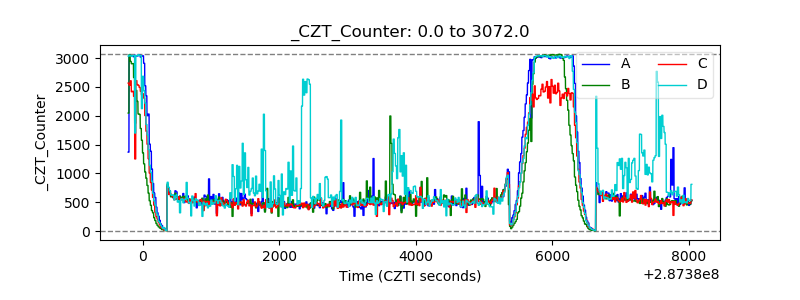 |
| +2.5 Volts monitor |  |
| +5 Volts monitor |  |
| _ROLL_ROT | 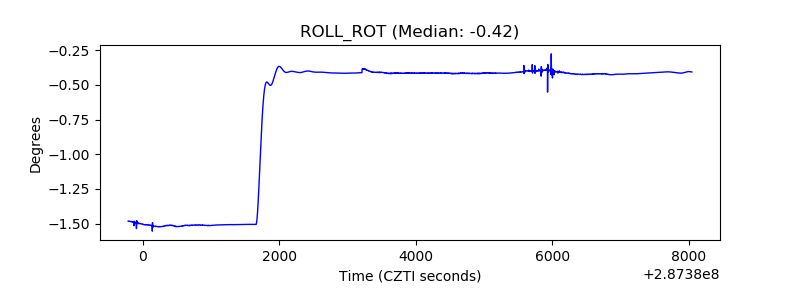 |
| _Roll_DEC | 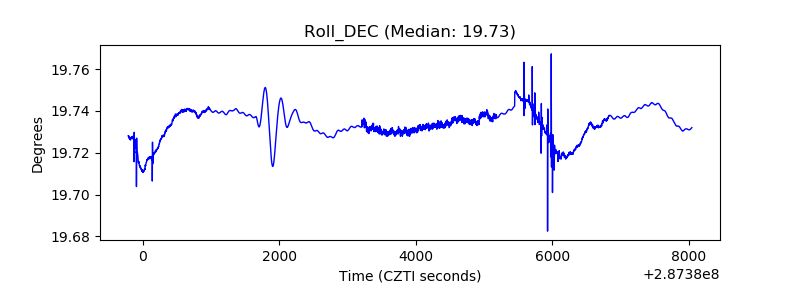 |
| _Roll_RA |  |
| Veto Counter | 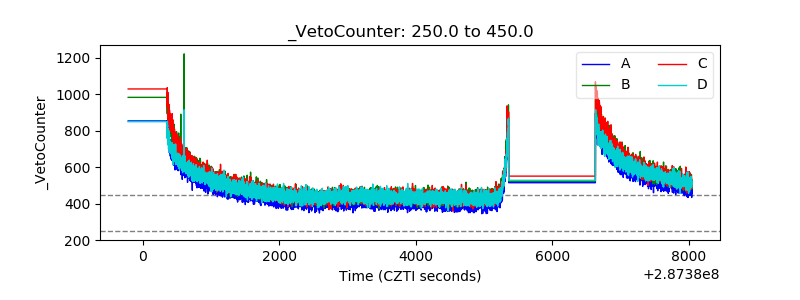 |