| Param | Original file | Final file |
|---|---|---|
| Filename | modeM0/AS1T03_003T01_9000002712_18210cztM0_level2.evt | modeM0/AS1T03_003T01_9000002712_18210cztM0_level2_quad_clean.evt |
| Size (bytes) | 579,015,360 | 70,824,960 |
| Size | 552.2 MB | 67.5 MB |
| Events in quadrant A | 3,825,108 | 440,186 |
| Events in quadrant B | 3,525,366 | 444,509 |
| Events in quadrant C | 3,361,878 | 429,373 |
| Events in quadrant D | 6,387,455 | 381,495 |
| Mode M9 | |||
|---|---|---|---|
| Quadrant | BADHDUFLAG | Total packets | Discarded packets |
| A | 0 | 12 | 0 |
| B | 0 | 12 | 0 |
| C | 0 | 12 | 0 |
| D | 0 | 12 | 0 |
| Mode M0 | |||
|---|---|---|---|
| Quadrant | BADHDUFLAG | Total packets | Discarded packets |
| A | 0 | 15133 | 5 |
| B | 0 | 14049 | 2 |
| C | 0 | 13593 | 2 |
| D | 0 | 23131 | 2 |
| Mode SS | |||
|---|---|---|---|
| Quadrant | BADHDUFLAG | Total packets | Discarded packets |
| A | 0 | 132 | 0 |
| B | 0 | 132 | 0 |
| C | 0 | 132 | 0 |
| D | 0 | 132 | 0 |
| Quadrant | Total seconds | Saturated seconds | Saturation percentage |
|---|---|---|---|
| A | 6426 | 245 | 3.812636% |
| B | 6426 | 118 | 1.836290% |
| C | 6427 | 107 | 1.664851% |
| D | 6427 | 937 | 14.579119% |
Noise dominated data is calculated using 1-second bins in cleaned event files. If a bin has >2000 counts, and if more than 50% of those come from <1% of pixels, then it is considered to be noise-dominated and hence unusable.
| Quadrant | # 1 sec bins | Bins with >0 counts | Bins with >2000 counts | High rate bins dominated by noise | Noise dominated (total time) | Noise dominated (detector-on time) | Marked lightcurve |
|---|---|---|---|---|---|---|---|
| A | 7685 | 6426 | 96 | 96 | 1.25% | 1.49% | 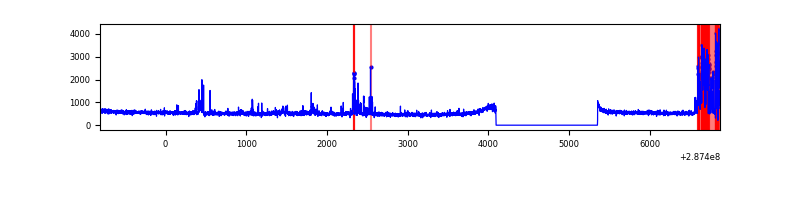 |
| B | 7685 | 6426 | 11 | 11 | 0.14% | 0.17% | 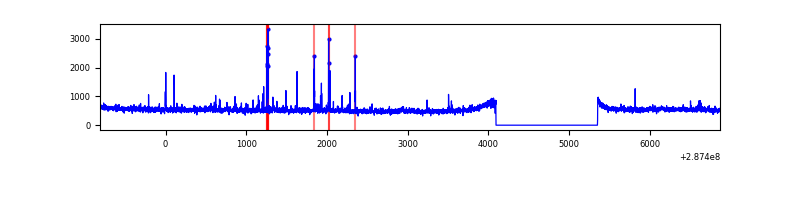 |
| C | 7687 | 6428 | 0 | 0 | 0.00% | 0.00% | 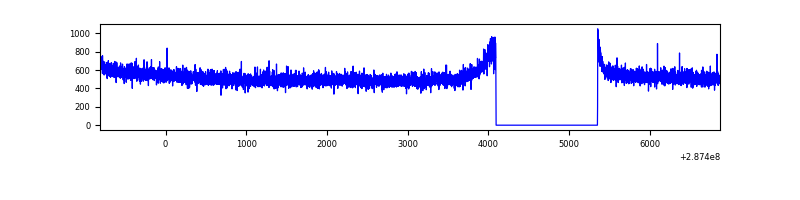 |
| D | 7687 | 6427 | 811 | 811 | 10.55% | 12.62% | 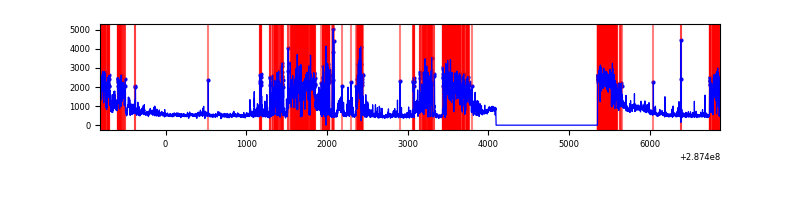 |
Top three noisy pixels from each quadrant. If the there are fewer than three noisy pixels in the level2.evt file, extra rows are filled as -1
| Pixel properties | Quadrant properties | ||||||
|---|---|---|---|---|---|---|---|
| Quadrant | DetID | PixID | Counts | Sigma | Mean | Median | Sigma |
| A | 15 | 174 | 523294 | 3043.17 | 857 | 841 | 171.7 |
| A | 0 | 226 | 7450 | 38.5 | 857 | 841 | 171.7 |
| A | 12 | 194 | 6400 | 32.38 | 857 | 841 | 171.7 |
| B | 7 | 220 | 79284 | 493.2 | 852 | 832 | 159.1 |
| B | 4 | 171 | 42700 | 263.21 | 852 | 832 | 159.1 |
| B | 3 | 209 | 22561 | 136.6 | 852 | 832 | 159.1 |
| C | 14 | 238 | 130616 | 684.26 | 823 | 831 | 189.7 |
| C | 8 | 128 | 9397 | 45.16 | 823 | 831 | 189.7 |
| C | 3 | 233 | 6453 | 29.64 | 823 | 831 | 189.7 |
| D | 7 | 238 | 2405202 | 12377.02 | 806 | 785 | 194.3 |
| D | 1 | 52 | 429794 | 2208.38 | 806 | 785 | 194.3 |
| D | 5 | 51 | 248937 | 1277.39 | 806 | 785 | 194.3 |
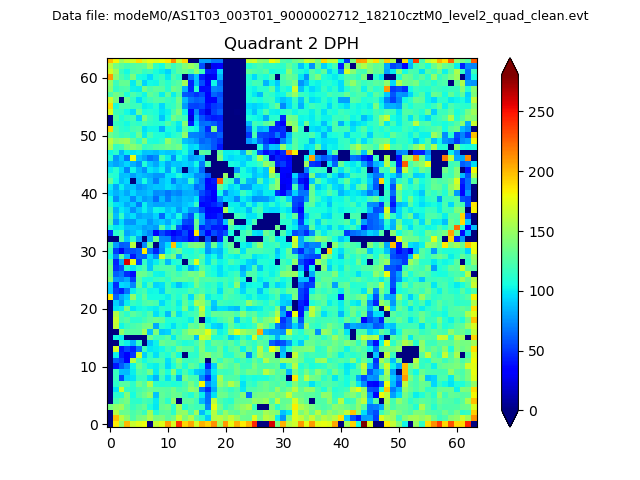
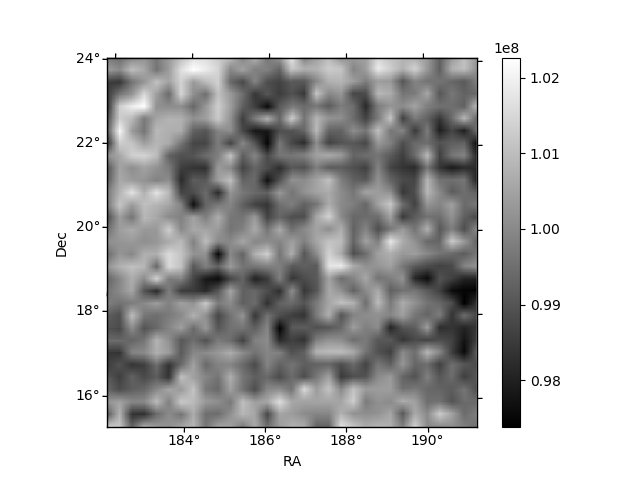
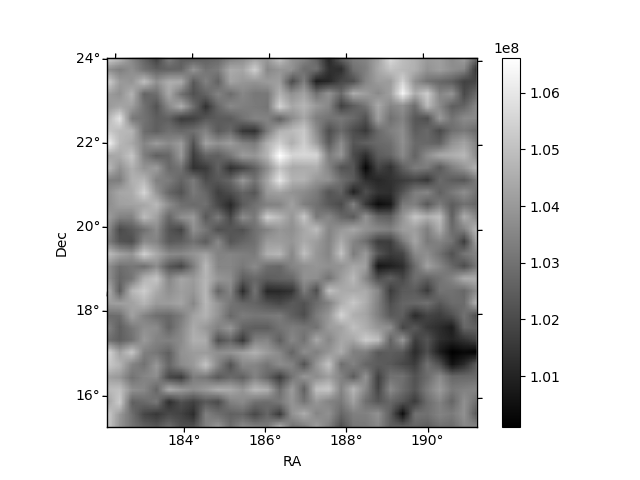
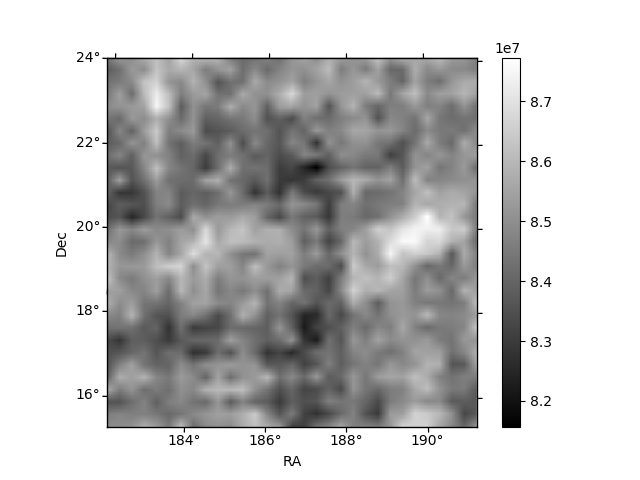
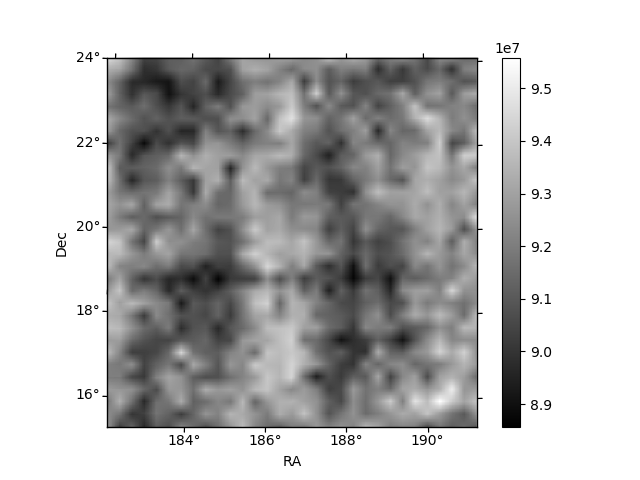
Histogram calculated using DETX and DETY for each event in the final _common_clean file
| Quadrant A | 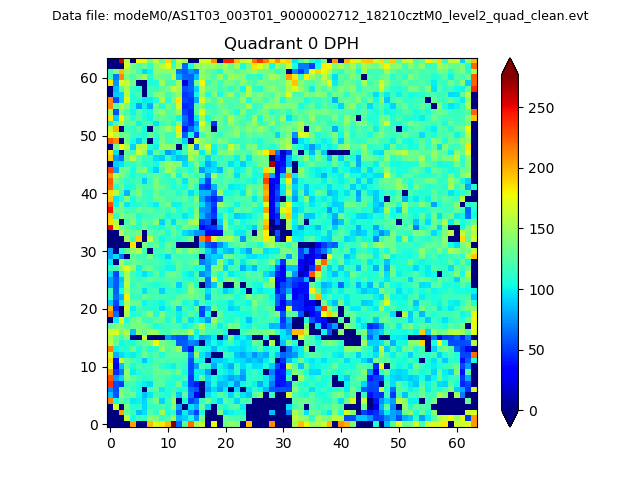 |
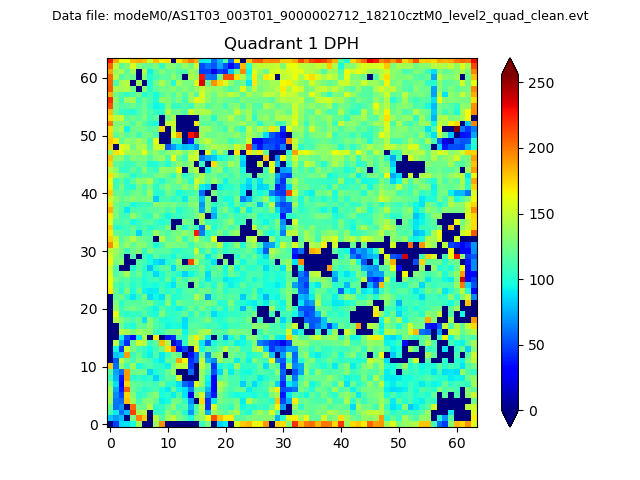 |
Quadrant B |
|---|---|---|---|
| Quadrant D | 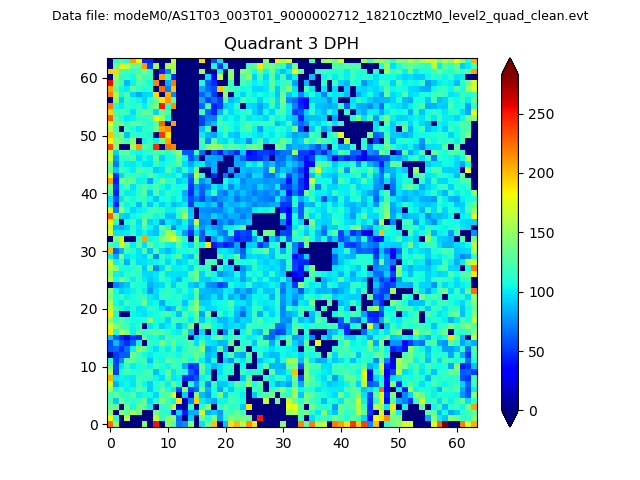 |
 |
Quadrant C |
| Plot type | Count rate plots | Images |
|---|---|---|
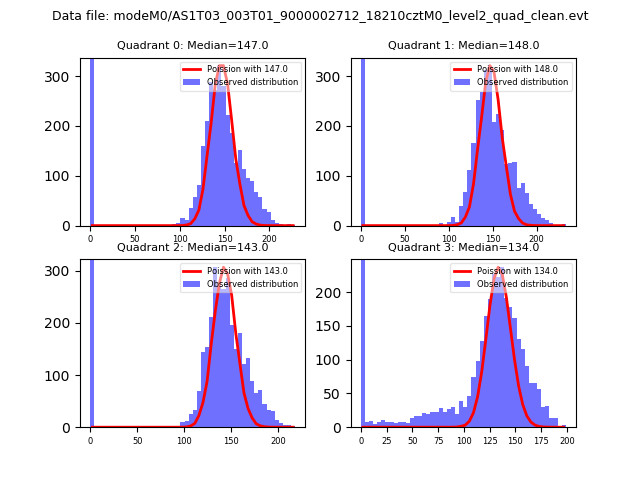
| Comparison with Poisson distribution Blue bars denote a histogram of data divided into 1 sec bins. Red curve is a Poisson curve with rate = median count rate of data. |
 |
 |
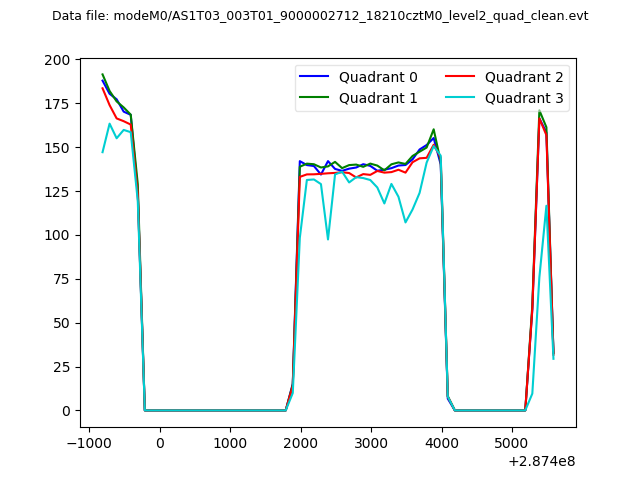
| Quadrant-wise count rates Data is divided into 100 sec bins |
 |
|
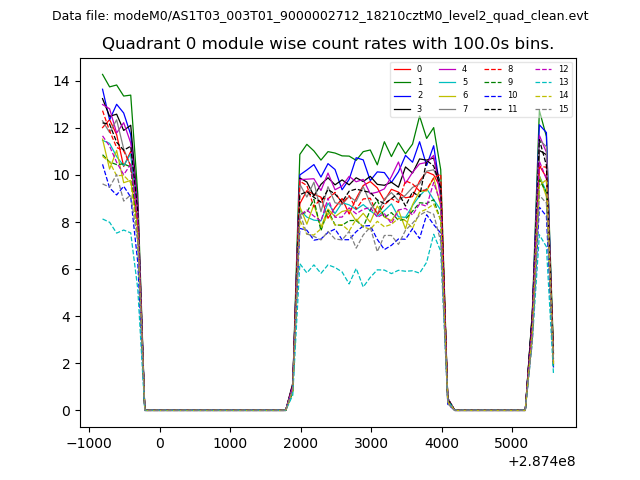
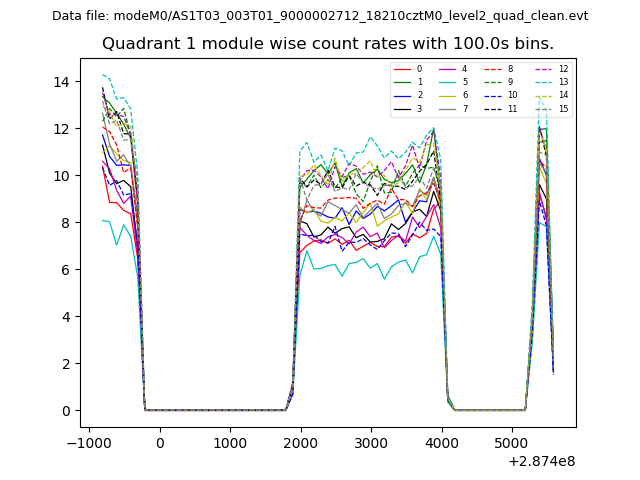
| Module-wise count rates for Quadrant A Data is divided into 100 sec bins |
 |
 |
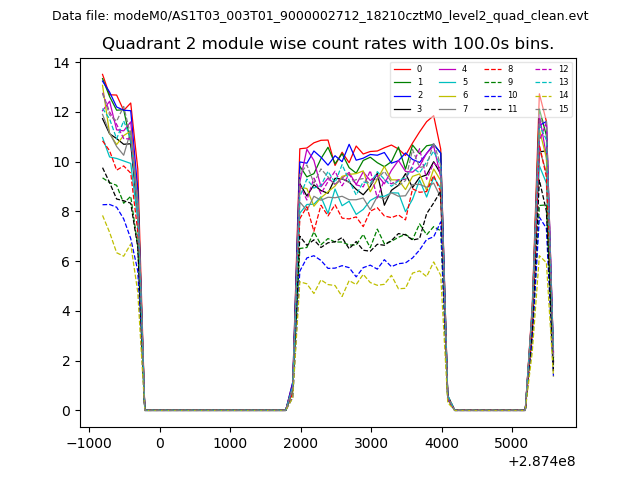
| Module-wise count rates for Quadrant B Data is divided into 100 sec bins |
 |
 |
| Module-wise count rates for Quadrant C Data is divided into 100 sec bins |
 |
 |
| Module-wise count rates for Quadrant D Data is divided into 100 sec bins |
 |
 |
| Parameter | Plot |
|---|---|
| CZT HV Monitor |  |
| D_VDD | 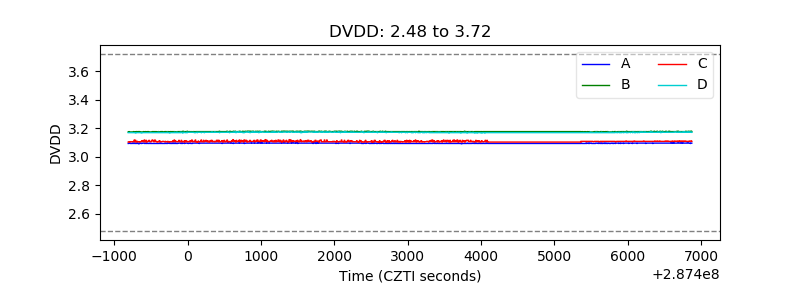 |
| Temperature 1 | 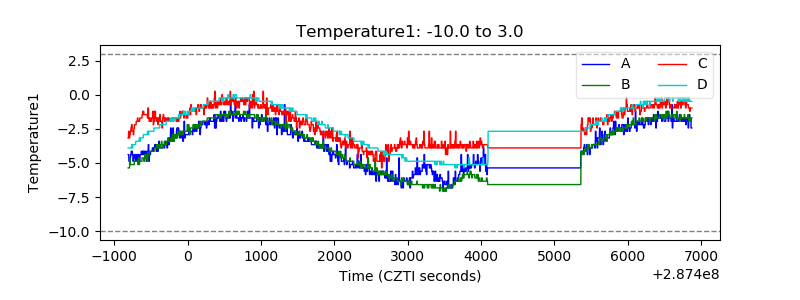 |
| Veto HV Monitor | 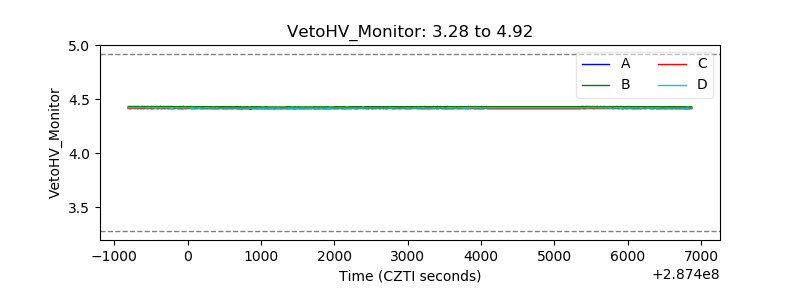 |
| Veto LLD |  |
| Alpha Counter | 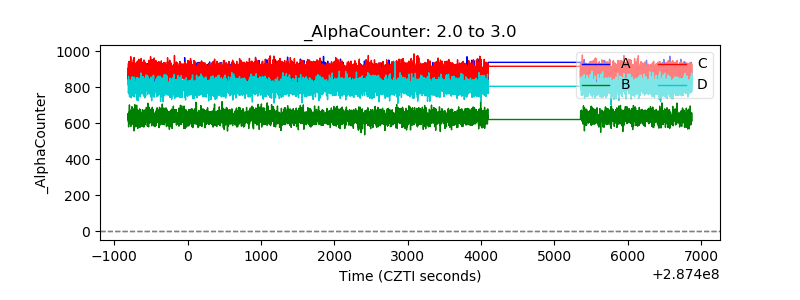 |
| _CPM_Rate | 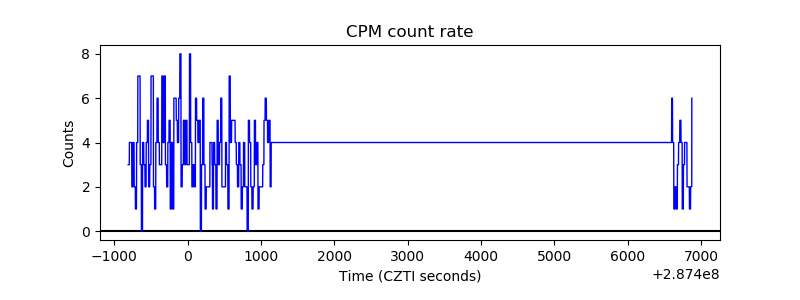 |
| CZT Counter | 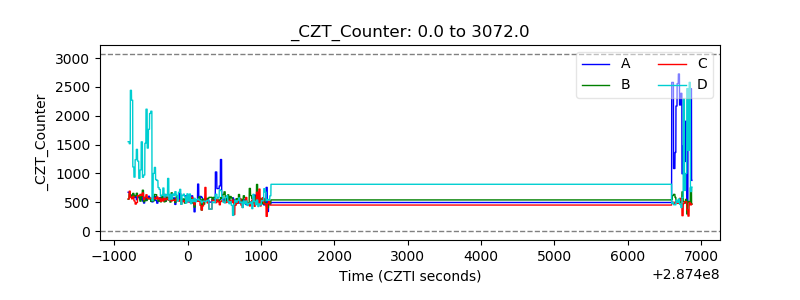 |
| +2.5 Volts monitor |  |
| +5 Volts monitor |  |
| _ROLL_ROT |  |
| _Roll_DEC | 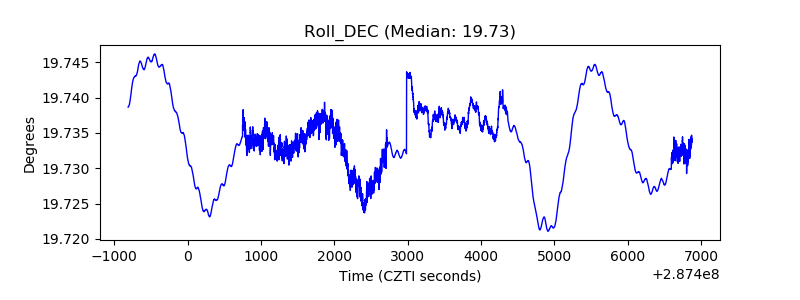 |
| _Roll_RA | 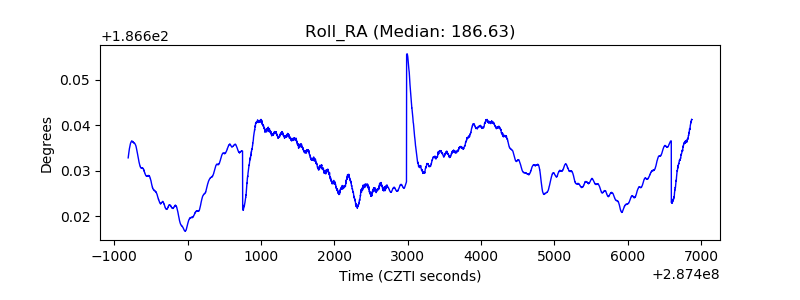 |
| Veto Counter | 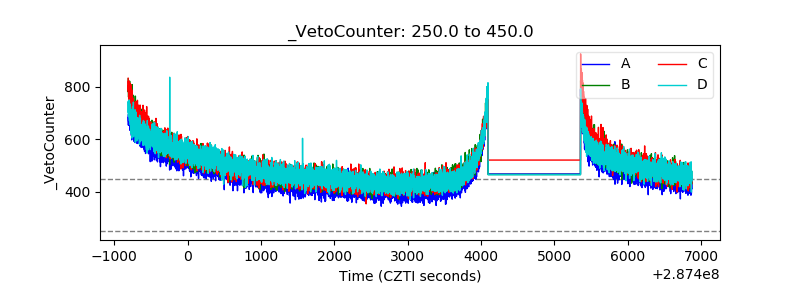 |