| Param | Original file | Final file |
|---|---|---|
| Filename | modeM0/AS1T03_003T01_9000002712_18211cztM0_level2.evt | modeM0/AS1T03_003T01_9000002712_18211cztM0_level2_quad_clean.evt |
| Size (bytes) | 576,000,000 | 68,662,080 |
| Size | 549.3 MB | 65.5 MB |
| Events in quadrant A | 4,078,792 | 409,442 |
| Events in quadrant B | 3,642,287 | 413,805 |
| Events in quadrant C | 3,423,507 | 401,204 |
| Events in quadrant D | 5,838,181 | 379,661 |
| Mode M9 | |||
|---|---|---|---|
| Quadrant | BADHDUFLAG | Total packets | Discarded packets |
| A | 0 | 9 | 0 |
| B | 0 | 9 | 0 |
| C | 0 | 9 | 0 |
| D | 0 | 9 | 0 |
| Mode M0 | |||
|---|---|---|---|
| Quadrant | BADHDUFLAG | Total packets | Discarded packets |
| A | 0 | 16322 | 1 |
| B | 0 | 14668 | 1 |
| C | 0 | 14135 | 1 |
| D | 0 | 21817 | 1 |
| Mode SS | |||
|---|---|---|---|
| Quadrant | BADHDUFLAG | Total packets | Discarded packets |
| A | 0 | 138 | 0 |
| B | 0 | 138 | 0 |
| C | 0 | 138 | 0 |
| D | 0 | 138 | 0 |
| Quadrant | Total seconds | Saturated seconds | Saturation percentage |
|---|---|---|---|
| A | 6811 | 326 | 4.786375% |
| B | 6812 | 113 | 1.658837% |
| C | 6812 | 109 | 1.600117% |
| D | 6812 | 529 | 7.765708% |
Noise dominated data is calculated using 1-second bins in cleaned event files. If a bin has >2000 counts, and if more than 50% of those come from <1% of pixels, then it is considered to be noise-dominated and hence unusable.
| Quadrant | # 1 sec bins | Bins with >0 counts | Bins with >2000 counts | High rate bins dominated by noise | Noise dominated (total time) | Noise dominated (detector-on time) | Marked lightcurve |
|---|---|---|---|---|---|---|---|
| A | 7786 | 6812 | 123 | 123 | 1.58% | 1.81% | 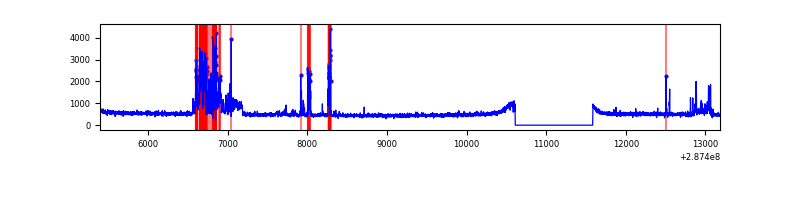 |
| B | 7787 | 6813 | 15 | 15 | 0.19% | 0.22% | 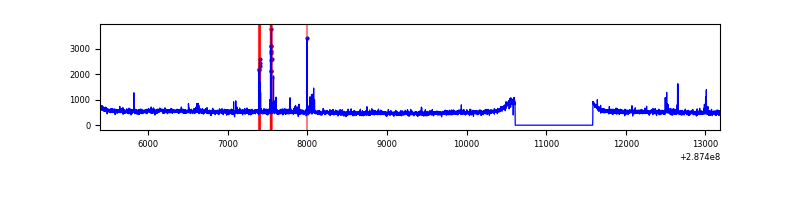 |
| C | 7787 | 6813 | 0 | 0 | 0.00% | 0.00% | 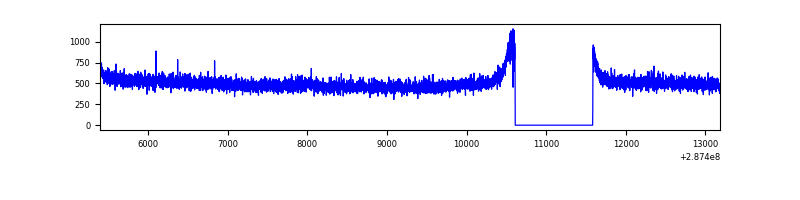 |
| D | 7787 | 6813 | 468 | 468 | 6.01% | 6.87% | 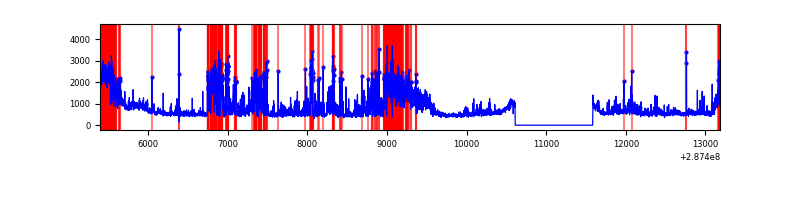 |
Top three noisy pixels from each quadrant. If the there are fewer than three noisy pixels in the level2.evt file, extra rows are filled as -1
| Pixel properties | Quadrant properties | ||||||
|---|---|---|---|---|---|---|---|
| Quadrant | DetID | PixID | Counts | Sigma | Mean | Median | Sigma |
| A | 15 | 174 | 710983 | 4042.25 | 868 | 849 | 175.7 |
| A | 4 | 208 | 21361 | 116.76 | 868 | 849 | 175.7 |
| A | 0 | 226 | 7486 | 37.78 | 868 | 849 | 175.7 |
| B | 4 | 171 | 86370 | 512.1 | 872 | 851 | 167.0 |
| B | 7 | 220 | 72575 | 429.49 | 872 | 851 | 167.0 |
| B | 12 | 111 | 19220 | 110.0 | 872 | 851 | 167.0 |
| C | 14 | 238 | 131425 | 662.76 | 841 | 846 | 197.0 |
| C | 3 | 233 | 14326 | 68.42 | 841 | 846 | 197.0 |
| C | 13 | 61 | 6048 | 26.4 | 841 | 846 | 197.0 |
| D | 7 | 238 | 2224191 | 10658.88 | 845 | 819 | 208.6 |
| D | 5 | 222 | 194854 | 930.2 | 845 | 819 | 208.6 |
| D | 5 | 51 | 76624 | 363.41 | 845 | 819 | 208.6 |
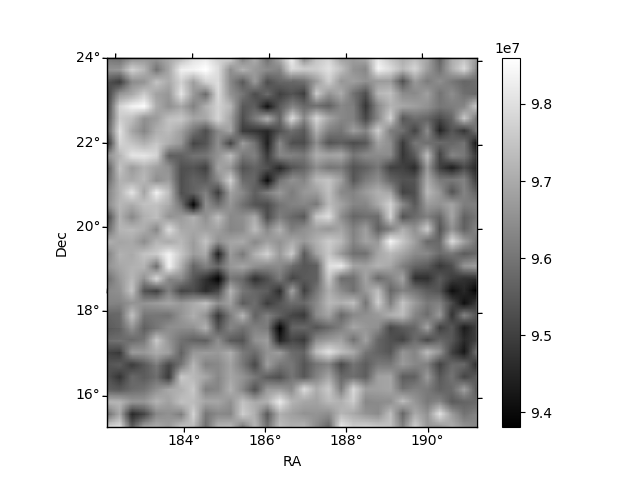
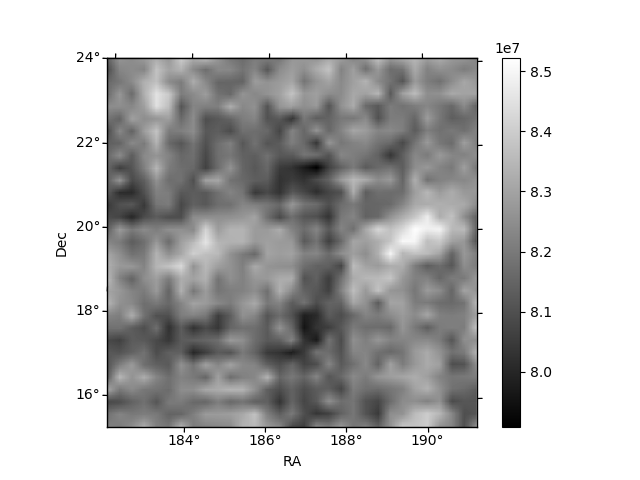
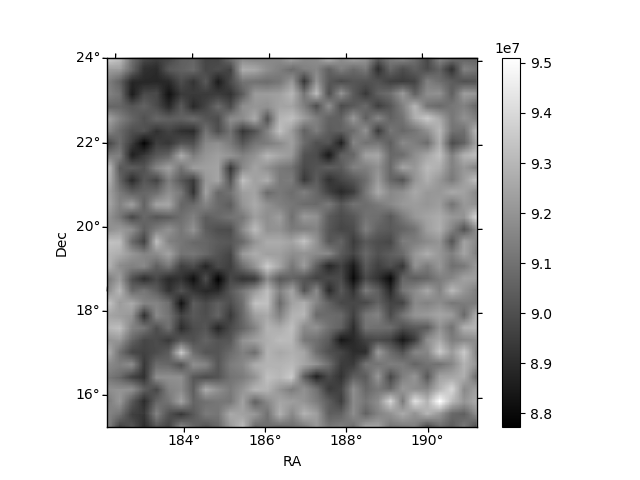
Histogram calculated using DETX and DETY for each event in the final _common_clean file
| Quadrant A | 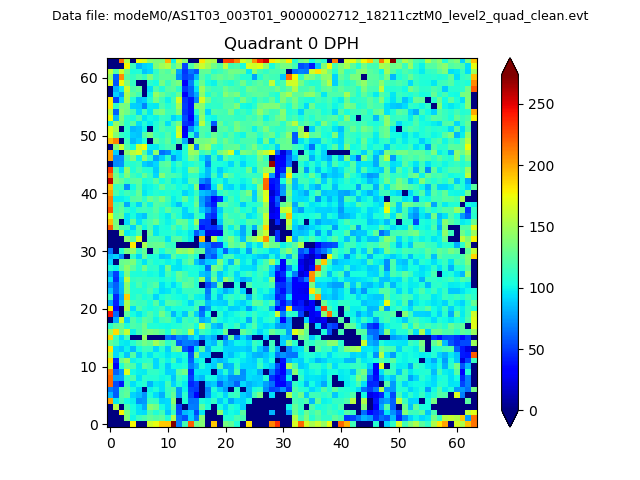 |
 |
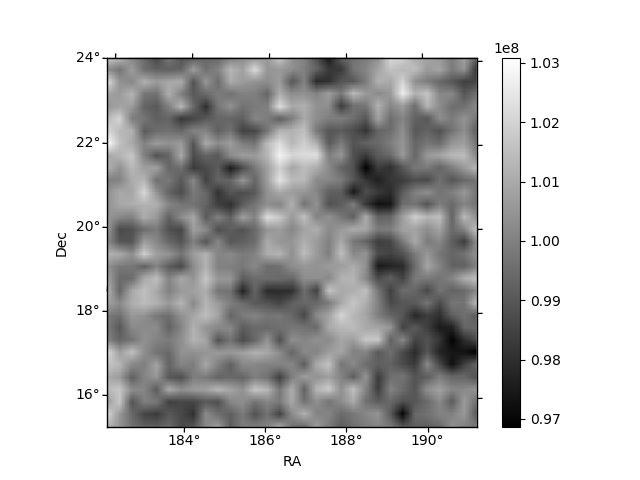
Quadrant B |
|---|---|---|---|
| Quadrant D | 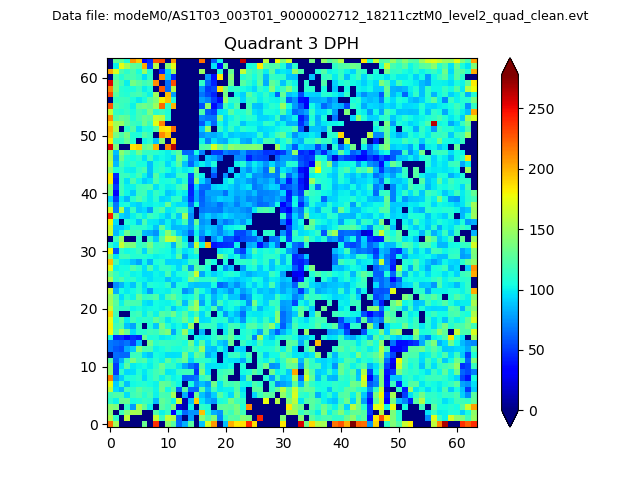 |
 |
Quadrant C |
| Plot type | Count rate plots | Images |
|---|---|---|
| Comparison with Poisson distribution Blue bars denote a histogram of data divided into 1 sec bins. Red curve is a Poisson curve with rate = median count rate of data. |
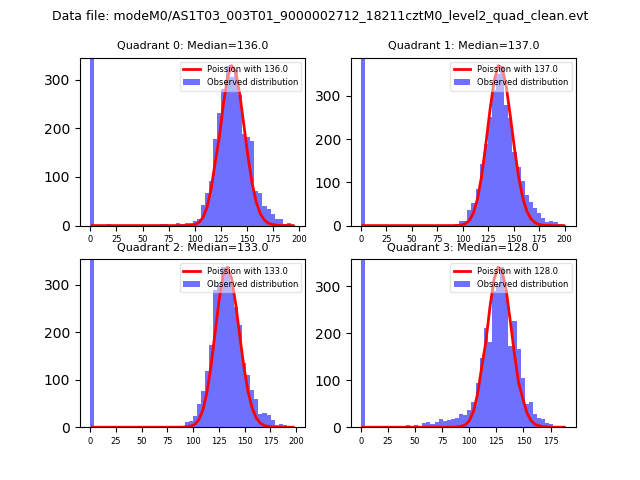 |
 |
| Quadrant-wise count rates Data is divided into 100 sec bins |
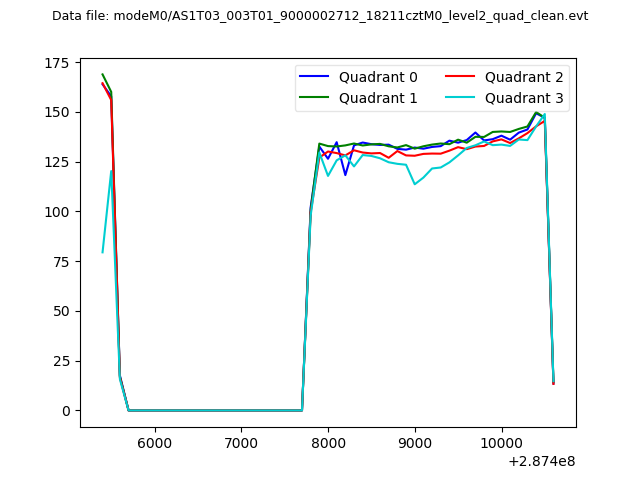 |
|
| Module-wise count rates for Quadrant A Data is divided into 100 sec bins |
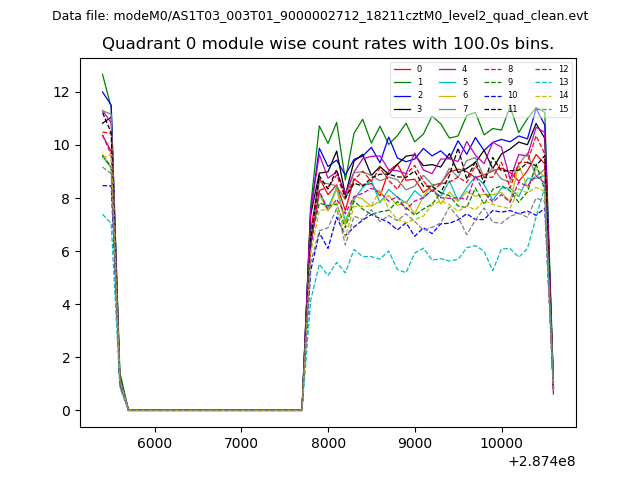 |
 |
| Module-wise count rates for Quadrant B Data is divided into 100 sec bins |
 |
 |
| Module-wise count rates for Quadrant C Data is divided into 100 sec bins |
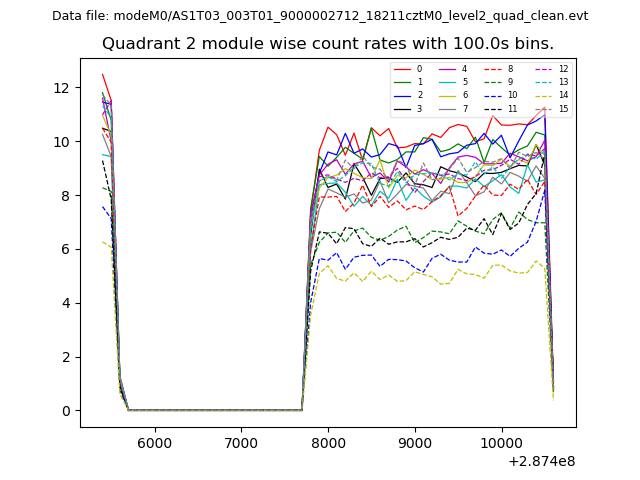 |
 |
| Module-wise count rates for Quadrant D Data is divided into 100 sec bins |
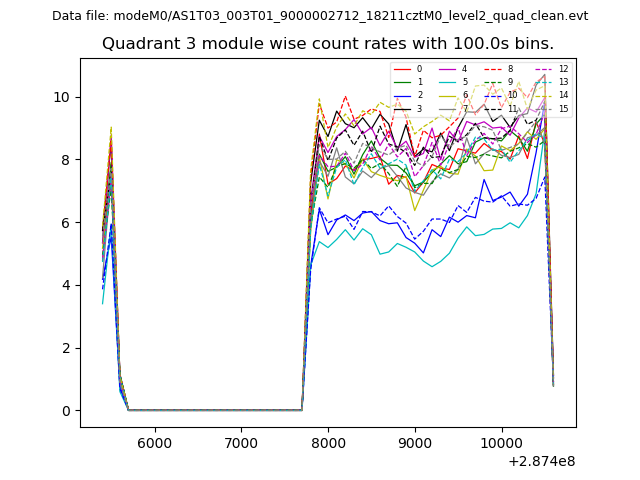 |
 |
| Parameter | Plot |
|---|---|
| CZT HV Monitor | 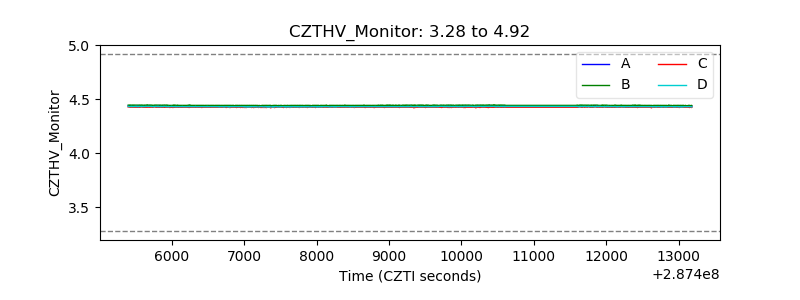 |
| D_VDD | 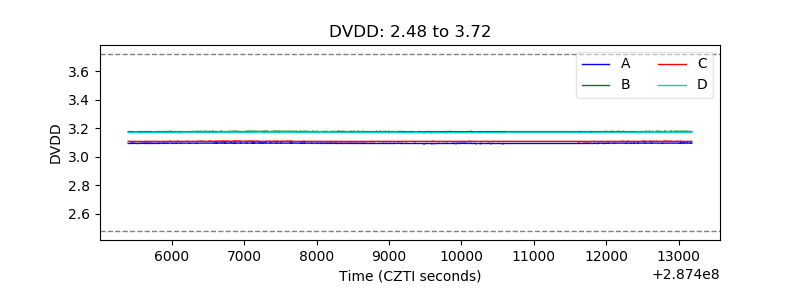 |
| Temperature 1 | 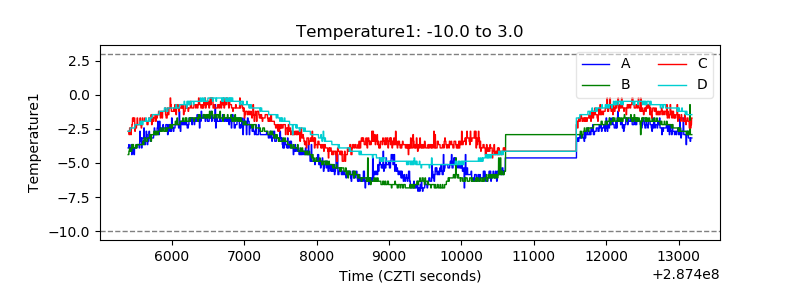 |
| Veto HV Monitor | 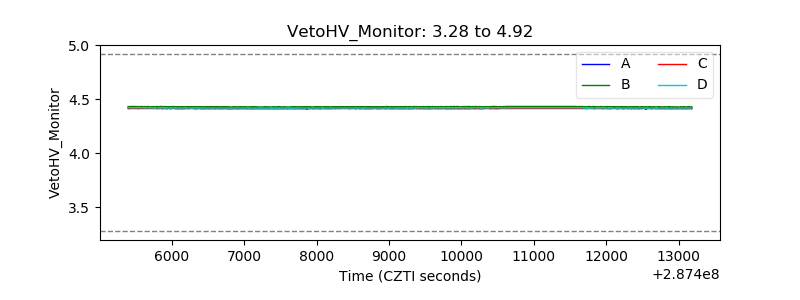 |
| Veto LLD | 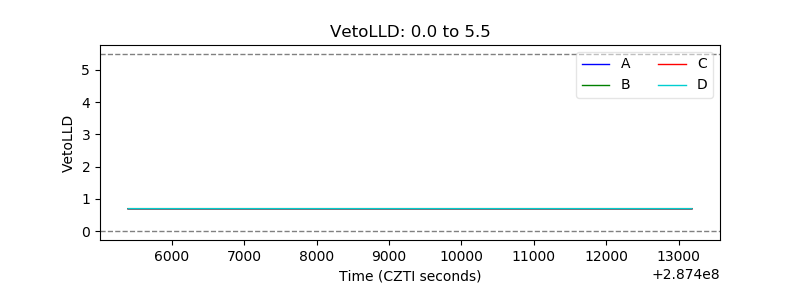 |
| Alpha Counter |  |
| _CPM_Rate | 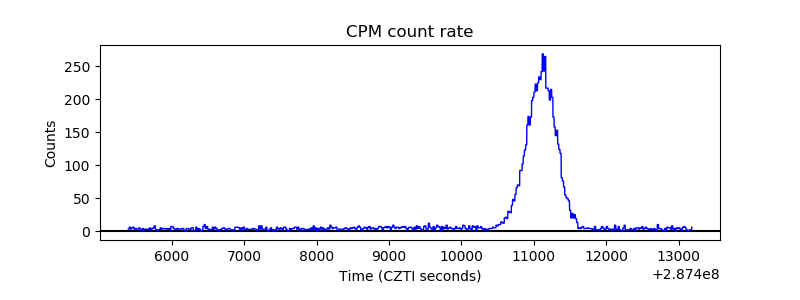 |
| CZT Counter |  |
| +2.5 Volts monitor |  |
| +5 Volts monitor |  |
| _ROLL_ROT | 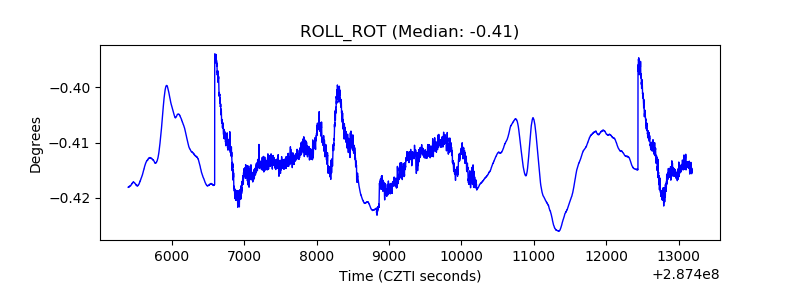 |
| _Roll_DEC | 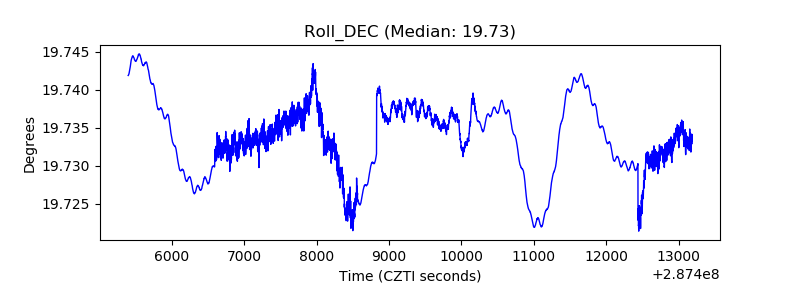 |
| _Roll_RA | 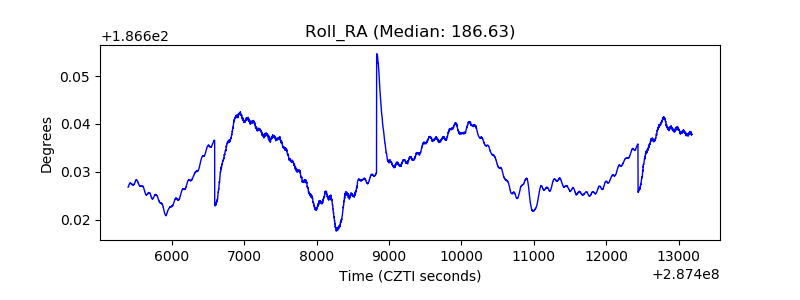 |
| Veto Counter | 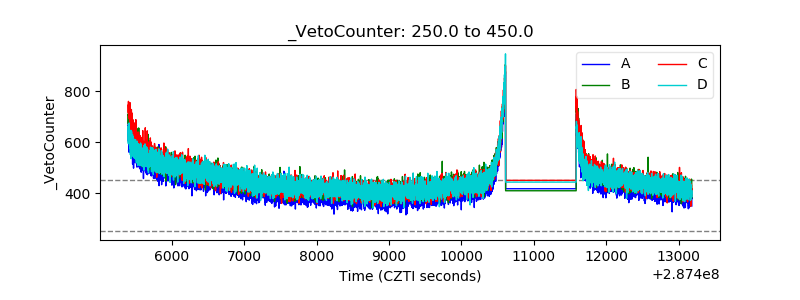 |