| Param | Original file | Final file |
|---|---|---|
| Filename | modeM0/AS1T03_003T01_9000002712_18212cztM0_level2.evt | modeM0/AS1T03_003T01_9000002712_18212cztM0_level2_quad_clean.evt |
| Size (bytes) | 589,095,360 | 76,844,160 |
| Size | 561.8 MB | 73.3 MB |
| Events in quadrant A | 4,152,098 | 459,231 |
| Events in quadrant B | 3,660,468 | 468,869 |
| Events in quadrant C | 3,534,898 | 455,383 |
| Events in quadrant D | 6,004,252 | 440,916 |
| Mode M9 | |||
|---|---|---|---|
| Quadrant | BADHDUFLAG | Total packets | Discarded packets |
| A | 0 | 15 | 0 |
| B | 0 | 15 | 0 |
| C | 0 | 15 | 0 |
| D | 0 | 15 | 0 |
| Mode M0 | |||
|---|---|---|---|
| Quadrant | BADHDUFLAG | Total packets | Discarded packets |
| A | 0 | 16905 | 2 |
| B | 0 | 15335 | 2 |
| C | 0 | 14942 | 2 |
| D | 0 | 22622 | 2 |
| Mode SS | |||
|---|---|---|---|
| Quadrant | BADHDUFLAG | Total packets | Discarded packets |
| A | 0 | 150 | 0 |
| B | 0 | 150 | 0 |
| C | 0 | 150 | 0 |
| D | 0 | 150 | 0 |
| Quadrant | Total seconds | Saturated seconds | Saturation percentage |
|---|---|---|---|
| A | 7206 | 227 | 3.150153% |
| B | 7206 | 148 | 2.053844% |
| C | 7205 | 167 | 2.317835% |
| D | 7205 | 686 | 9.521166% |
Noise dominated data is calculated using 1-second bins in cleaned event files. If a bin has >2000 counts, and if more than 50% of those come from <1% of pixels, then it is considered to be noise-dominated and hence unusable.
| Quadrant | # 1 sec bins | Bins with >0 counts | Bins with >2000 counts | High rate bins dominated by noise | Noise dominated (total time) | Noise dominated (detector-on time) | Marked lightcurve |
|---|---|---|---|---|---|---|---|
| A | 8756 | 7208 | 62 | 62 | 0.71% | 0.86% | 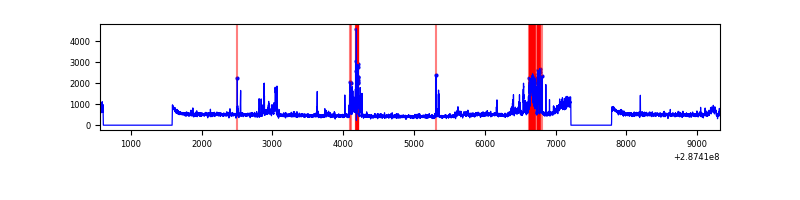 |
| B | 8756 | 7208 | 5 | 5 | 0.06% | 0.07% | 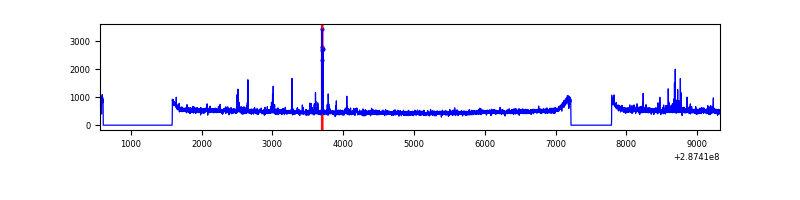 |
| C | 8755 | 7207 | 0 | 0 | 0.00% | 0.00% | 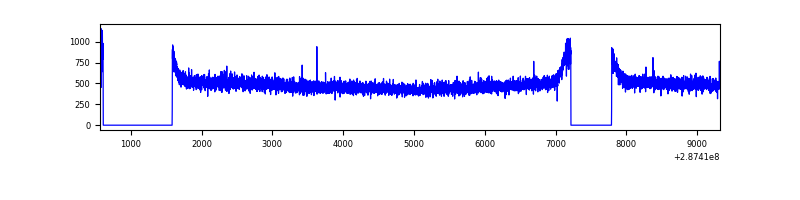 |
| D | 8755 | 7207 | 521 | 521 | 5.95% | 7.23% | 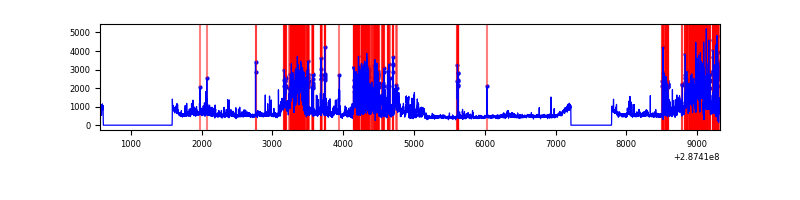 |
Top three noisy pixels from each quadrant. If the there are fewer than three noisy pixels in the level2.evt file, extra rows are filled as -1
| Pixel properties | Quadrant properties | ||||||
|---|---|---|---|---|---|---|---|
| Quadrant | DetID | PixID | Counts | Sigma | Mean | Median | Sigma |
| A | 15 | 174 | 640373 | 3470.57 | 906 | 885 | 184.3 |
| A | 4 | 208 | 21441 | 111.56 | 906 | 885 | 184.3 |
| A | 4 | 2 | 10402 | 51.65 | 906 | 885 | 184.3 |
| B | 7 | 220 | 73288 | 410.28 | 904 | 881 | 176.5 |
| B | 12 | 111 | 20670 | 112.13 | 904 | 881 | 176.5 |
| B | 11 | 111 | 17726 | 95.45 | 904 | 881 | 176.5 |
| C | 14 | 238 | 133918 | 647.1 | 868 | 873 | 205.6 |
| C | 3 | 233 | 13252 | 60.21 | 868 | 873 | 205.6 |
| C | 13 | 61 | 6203 | 25.92 | 868 | 873 | 205.6 |
| D | 7 | 238 | 2299057 | 10879.25 | 861 | 836 | 211.2 |
| D | 5 | 222 | 222669 | 1050.11 | 861 | 836 | 211.2 |
| D | 5 | 51 | 57761 | 269.47 | 861 | 836 | 211.2 |
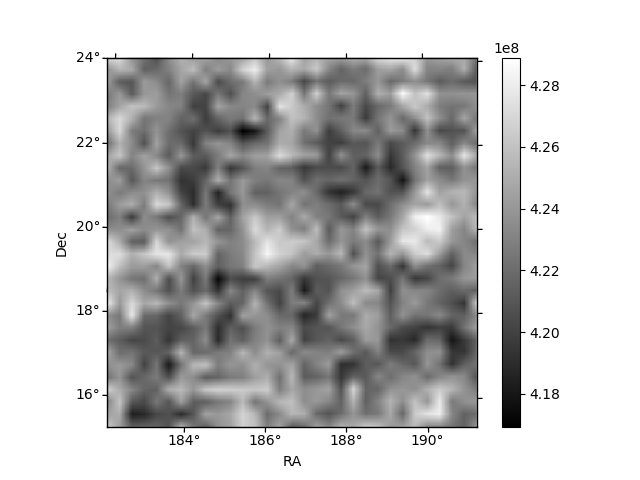
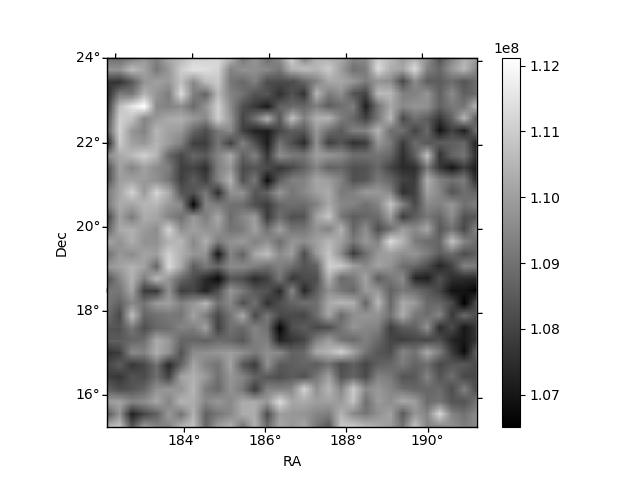
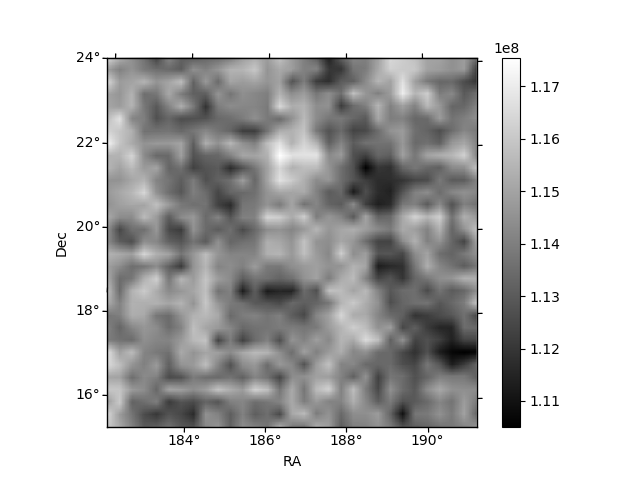
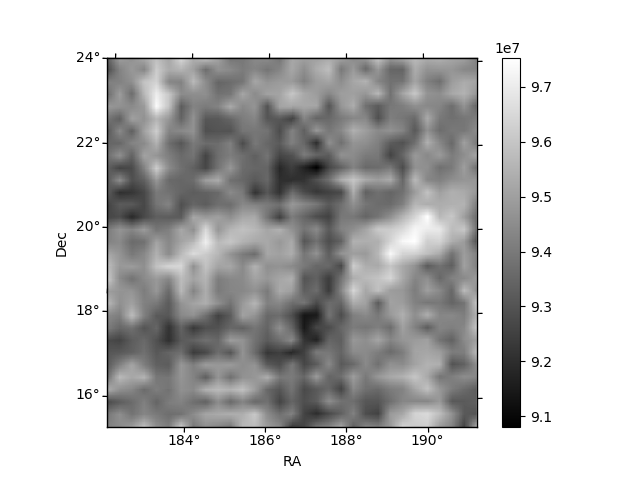
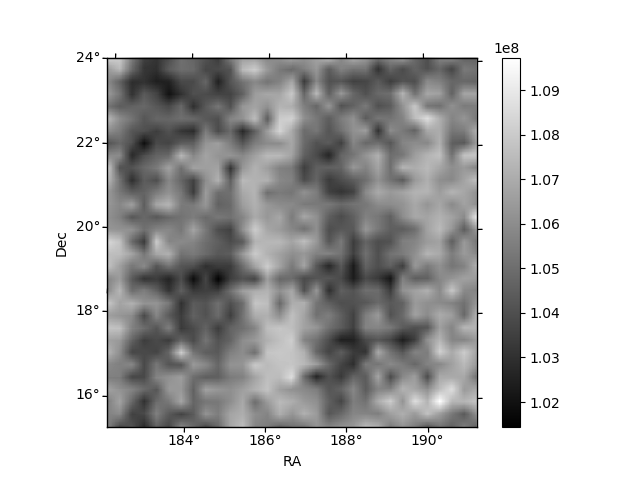
Histogram calculated using DETX and DETY for each event in the final _common_clean file
| Quadrant A | 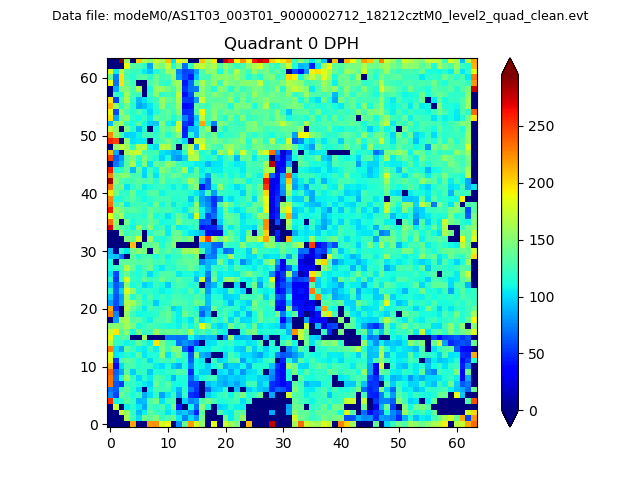 |
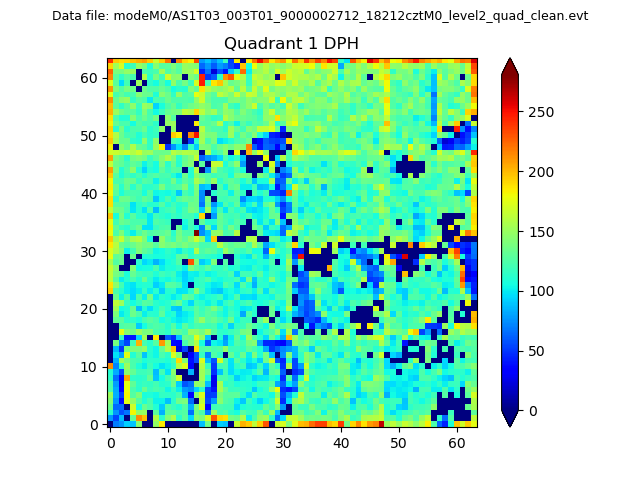 |
Quadrant B |
|---|---|---|---|
| Quadrant D | 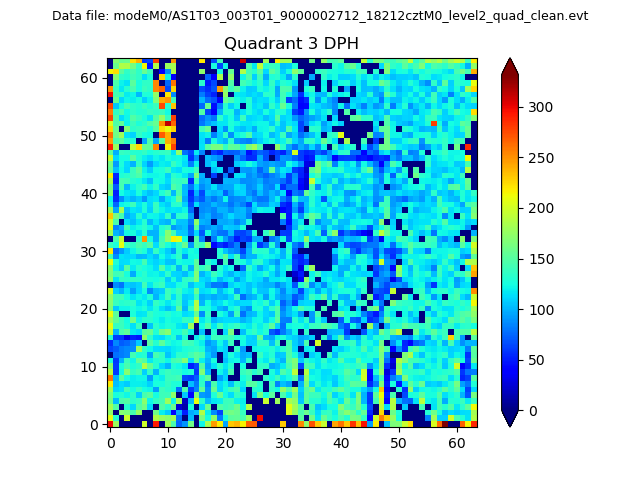 |
 |
Quadrant C |
| Plot type | Count rate plots | Images |
|---|---|---|
| Comparison with Poisson distribution Blue bars denote a histogram of data divided into 1 sec bins. Red curve is a Poisson curve with rate = median count rate of data. |
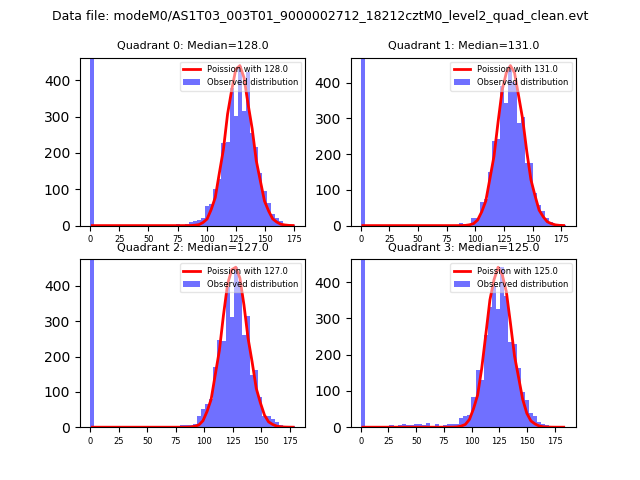 |
 |
| Quadrant-wise count rates Data is divided into 100 sec bins |
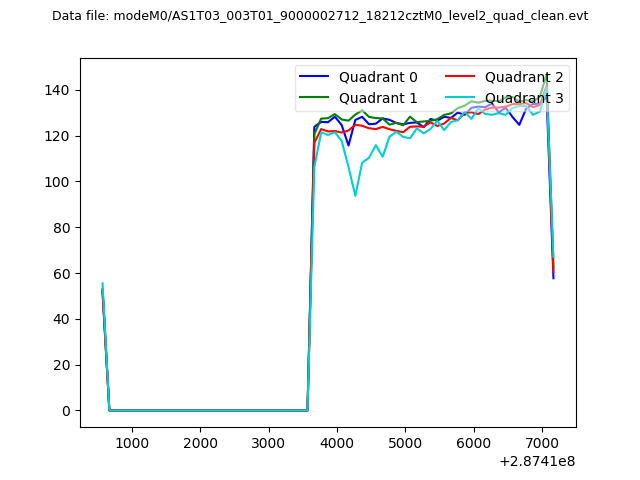 |
|
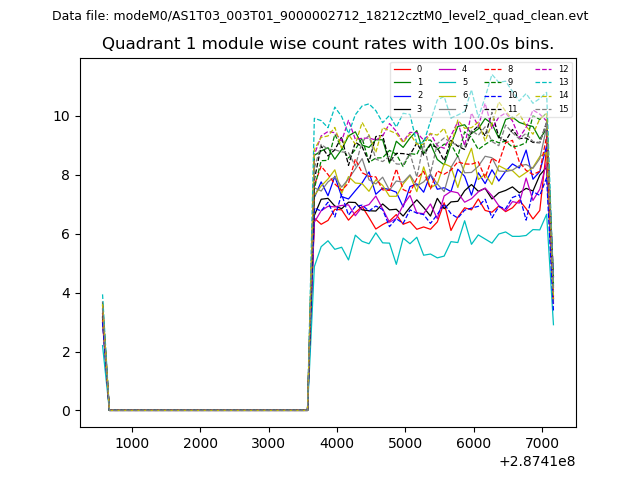
| Module-wise count rates for Quadrant A Data is divided into 100 sec bins |
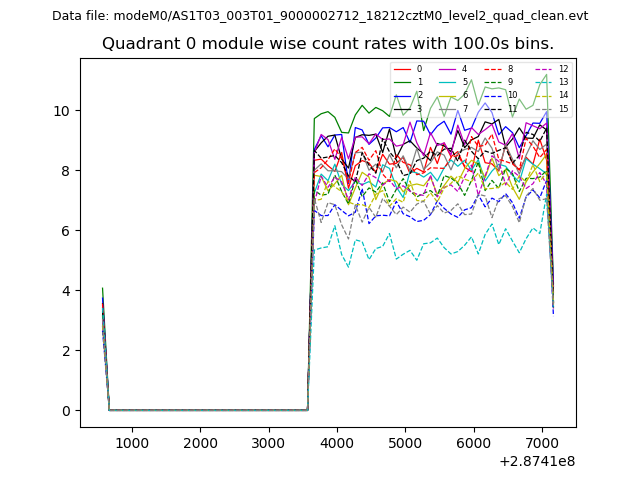 |
 |
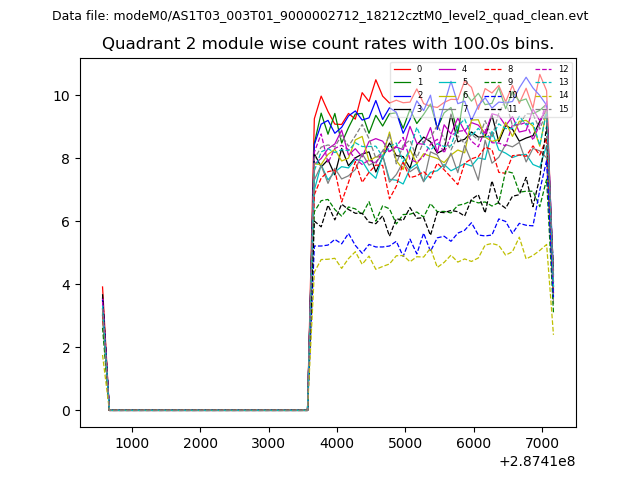
| Module-wise count rates for Quadrant B Data is divided into 100 sec bins |
 |
 |
| Module-wise count rates for Quadrant C Data is divided into 100 sec bins |
 |
 |
| Module-wise count rates for Quadrant D Data is divided into 100 sec bins |
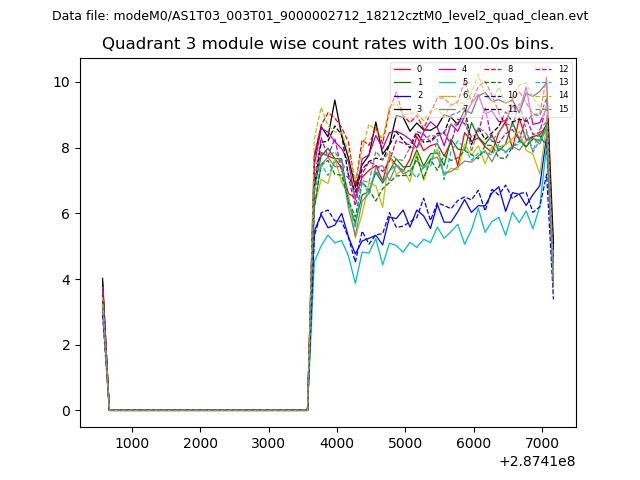 |
 |
| Parameter | Plot |
|---|---|
| CZT HV Monitor | 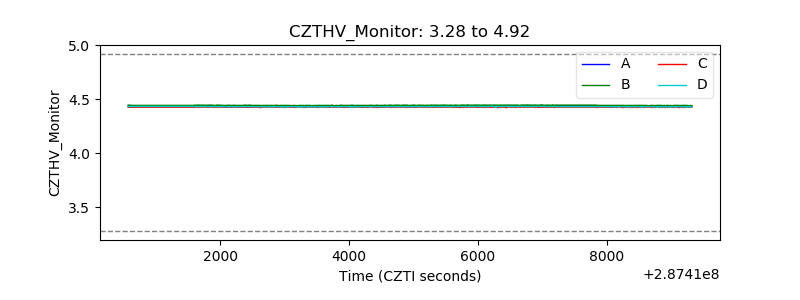 |
| D_VDD | 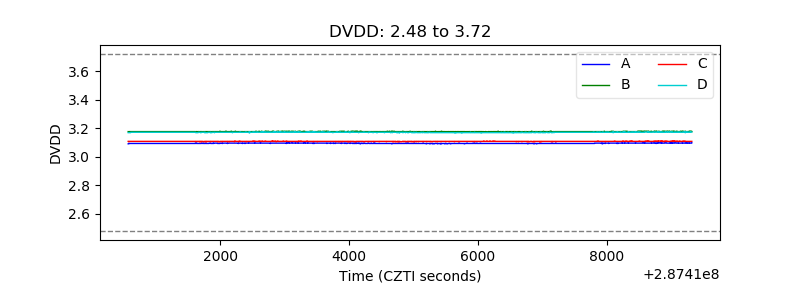 |
| Temperature 1 | 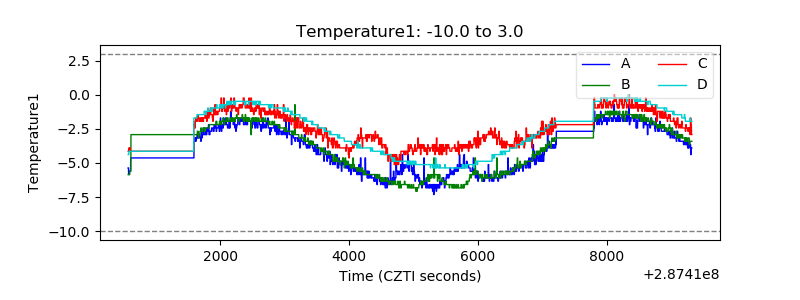 |
| Veto HV Monitor | 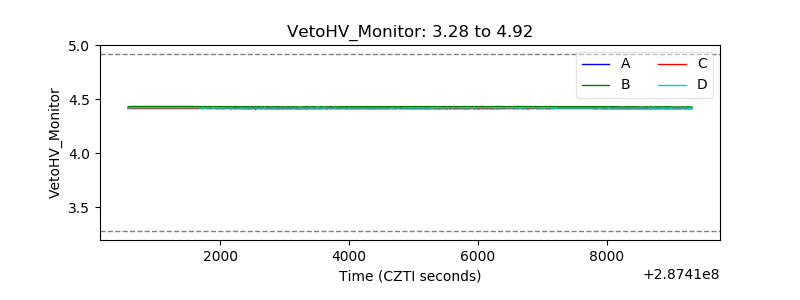 |
| Veto LLD | 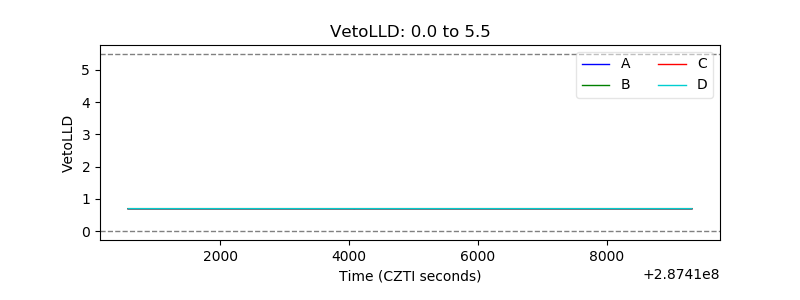 |
| Alpha Counter | 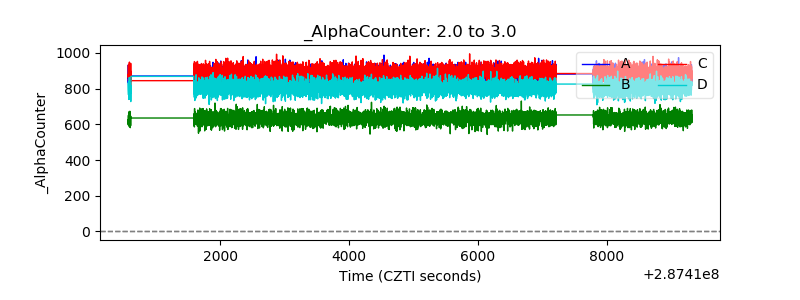 |
| _CPM_Rate | 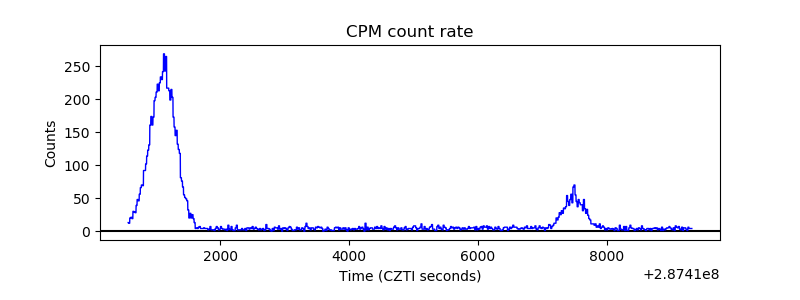 |
| CZT Counter |  |
| +2.5 Volts monitor |  |
| +5 Volts monitor | 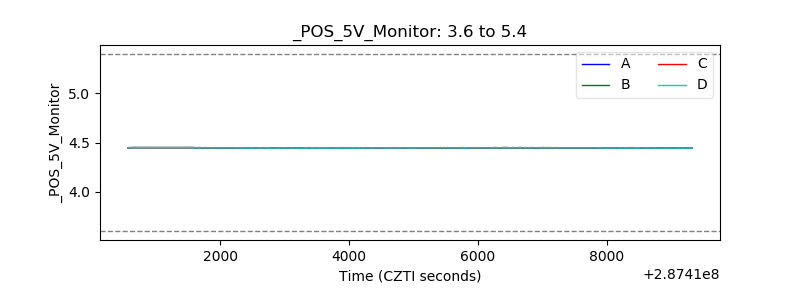 |
| _ROLL_ROT | 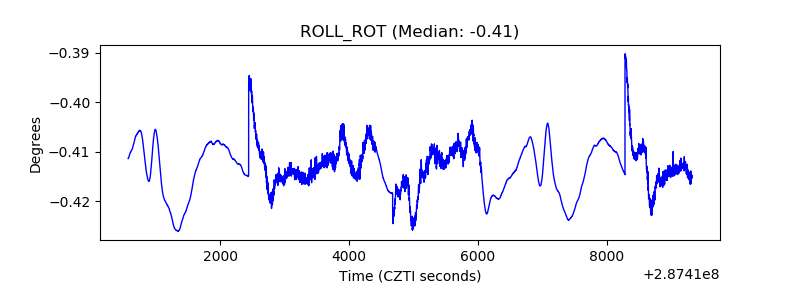 |
| _Roll_DEC | 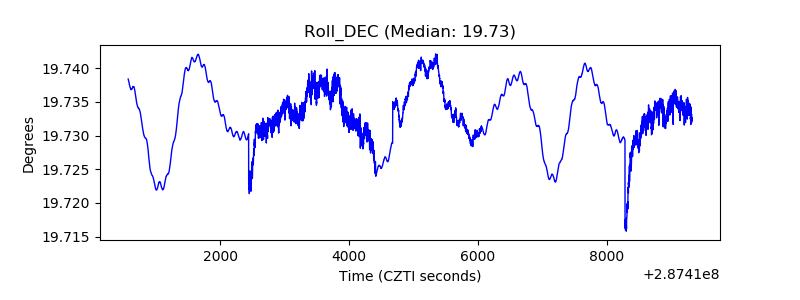 |
| _Roll_RA | 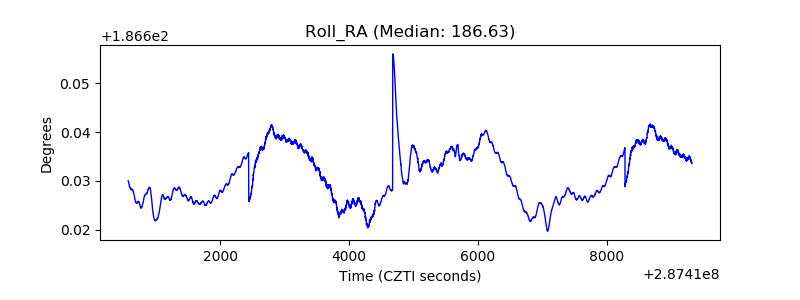 |
| Veto Counter | 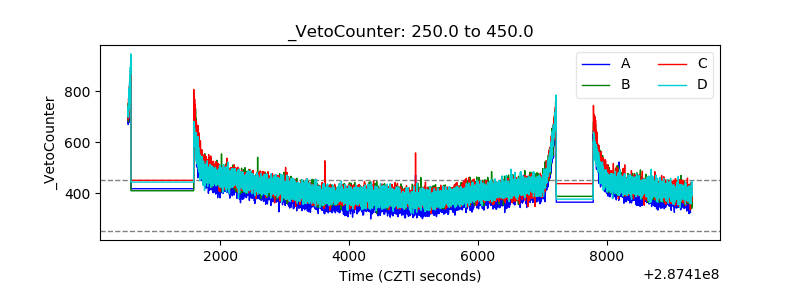 |