| Param | Original file | Final file |
|---|---|---|
| Filename | modeM0/AS1T03_003T01_9000002712_18213cztM0_level2.evt | modeM0/AS1T03_003T01_9000002712_18213cztM0_level2_quad_clean.evt |
| Size (bytes) | 668,966,400 | 86,319,360 |
| Size | 638.0 MB | 82.3 MB |
| Events in quadrant A | 4,966,630 | 529,060 |
| Events in quadrant B | 4,086,652 | 533,327 |
| Events in quadrant C | 3,887,974 | 516,955 |
| Events in quadrant D | 6,782,752 | 484,769 |
| Mode M9 | |||
|---|---|---|---|
| Quadrant | BADHDUFLAG | Total packets | Discarded packets |
| A | 0 | 8 | 0 |
| B | 0 | 8 | 0 |
| C | 0 | 8 | 0 |
| D | 0 | 8 | 0 |
| Mode M0 | |||
|---|---|---|---|
| Quadrant | BADHDUFLAG | Total packets | Discarded packets |
| A | 0 | 20036 | 2 |
| B | 0 | 17158 | 2 |
| C | 0 | 16566 | 2 |
| D | 0 | 25484 | 3 |
| Mode SS | |||
|---|---|---|---|
| Quadrant | BADHDUFLAG | Total packets | Discarded packets |
| A | 0 | 162 | 0 |
| B | 0 | 162 | 0 |
| C | 0 | 162 | 0 |
| D | 0 | 162 | 0 |
| Quadrant | Total seconds | Saturated seconds | Saturation percentage |
|---|---|---|---|
| A | 7905 | 481 | 6.084756% |
| B | 7905 | 197 | 2.492094% |
| C | 7905 | 218 | 2.757748% |
| D | 7904 | 1045 | 13.221154% |
Noise dominated data is calculated using 1-second bins in cleaned event files. If a bin has >2000 counts, and if more than 50% of those come from <1% of pixels, then it is considered to be noise-dominated and hence unusable.
| Quadrant | # 1 sec bins | Bins with >0 counts | Bins with >2000 counts | High rate bins dominated by noise | Noise dominated (total time) | Noise dominated (detector-on time) | Marked lightcurve |
|---|---|---|---|---|---|---|---|
| A | 8710 | 7908 | 182 | 182 | 2.09% | 2.30% | 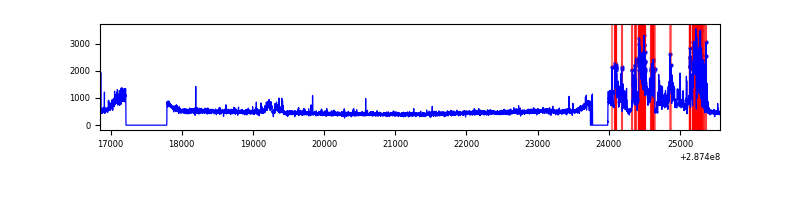 |
| B | 8710 | 7908 | 5 | 5 | 0.06% | 0.06% | 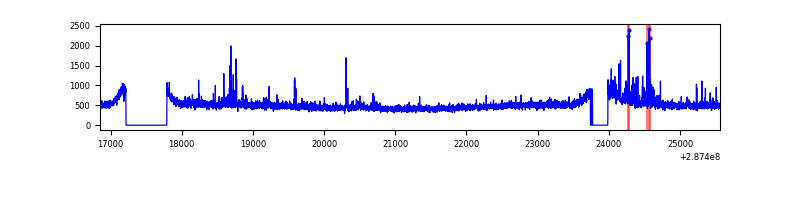 |
| C | 8710 | 7908 | 0 | 0 | 0.00% | 0.00% | 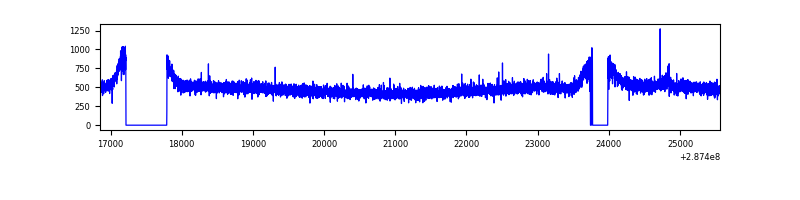 |
| D | 8708 | 7906 | 771 | 771 | 8.85% | 9.75% | 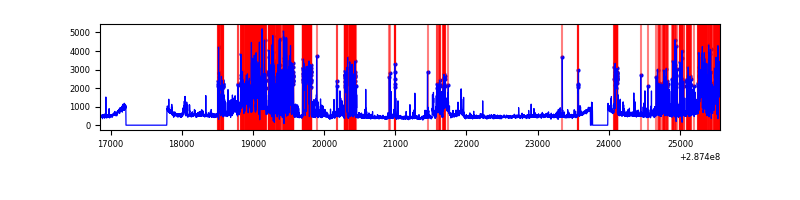 |
Top three noisy pixels from each quadrant. If the there are fewer than three noisy pixels in the level2.evt file, extra rows are filled as -1
| Pixel properties | Quadrant properties | ||||||
|---|---|---|---|---|---|---|---|
| Quadrant | DetID | PixID | Counts | Sigma | Mean | Median | Sigma |
| A | 15 | 174 | 1168687 | 5863.97 | 981 | 960 | 199.1 |
| A | 11 | 47 | 17569 | 83.41 | 981 | 960 | 199.1 |
| A | 0 | 226 | 8652 | 38.63 | 981 | 960 | 199.1 |
| B | 7 | 220 | 98591 | 511.28 | 986 | 961 | 191.0 |
| B | 3 | 64 | 30755 | 156.03 | 986 | 961 | 191.0 |
| B | 0 | 244 | 23582 | 118.46 | 986 | 961 | 191.0 |
| C | 14 | 238 | 145925 | 648.5 | 948 | 950 | 223.6 |
| C | 3 | 233 | 39879 | 174.13 | 948 | 950 | 223.6 |
| C | 13 | 61 | 6983 | 26.98 | 948 | 950 | 223.6 |
| D | 7 | 238 | 2113193 | 9365.33 | 913 | 884 | 225.5 |
| D | 5 | 222 | 918593 | 4068.84 | 913 | 884 | 225.5 |
| D | 5 | 51 | 111962 | 492.49 | 913 | 884 | 225.5 |
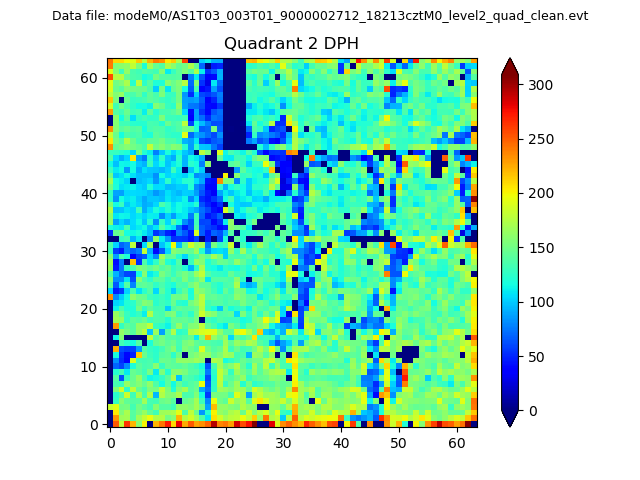
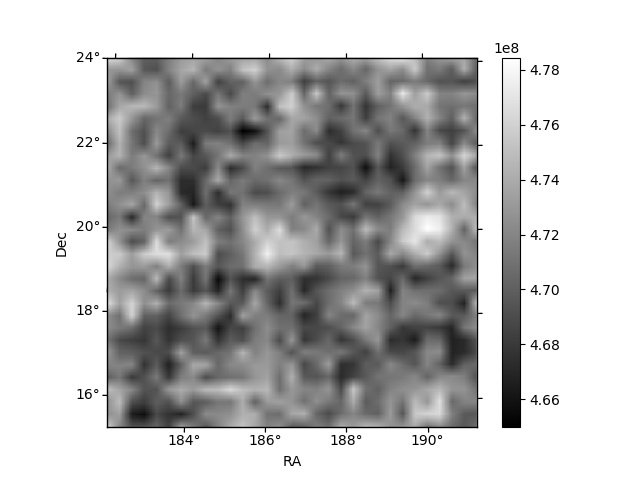
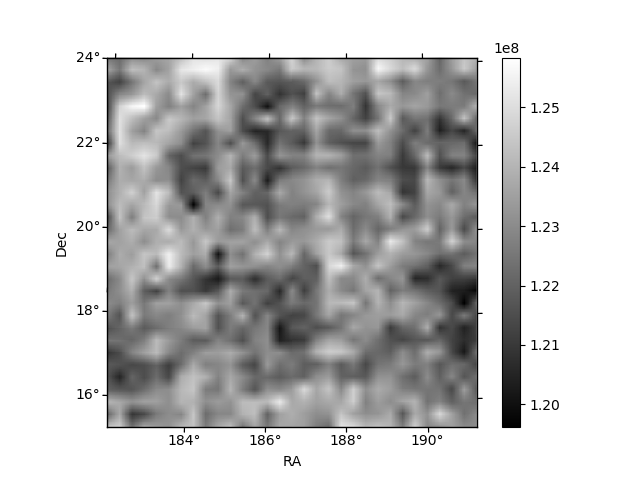
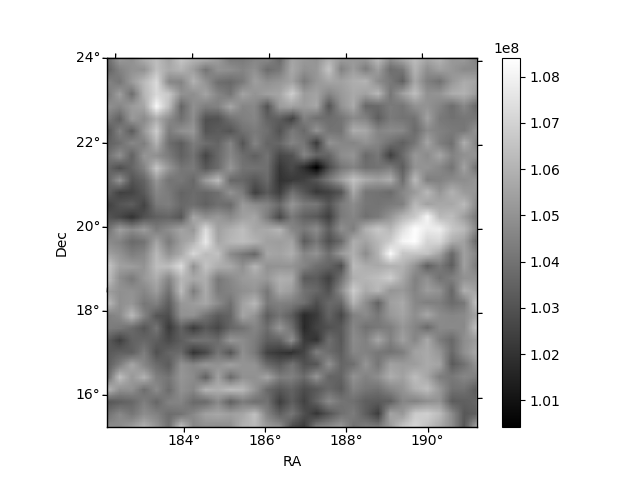
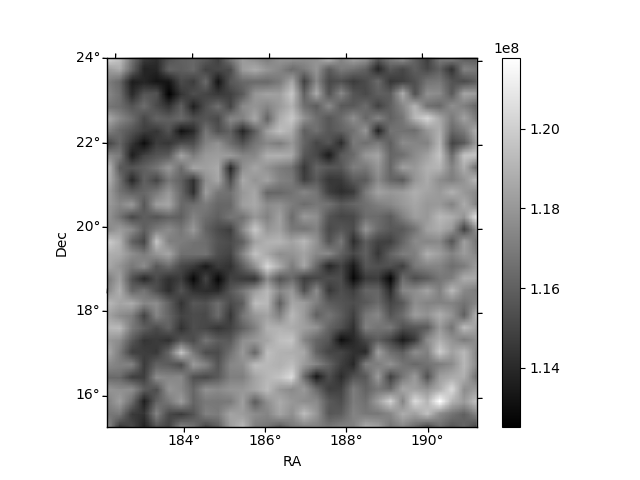
Histogram calculated using DETX and DETY for each event in the final _common_clean file
| Quadrant A | 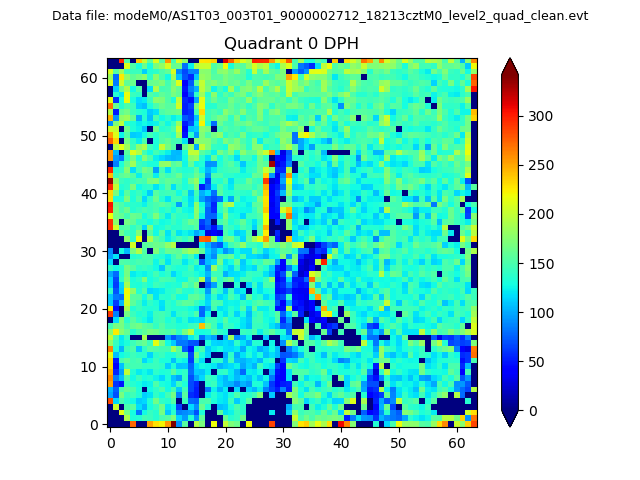 |
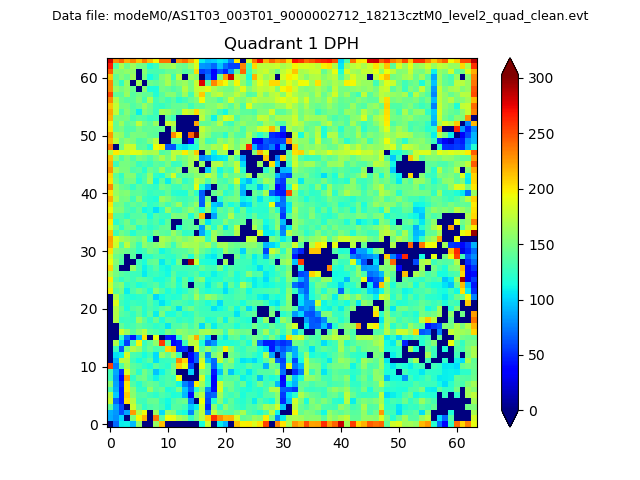 |
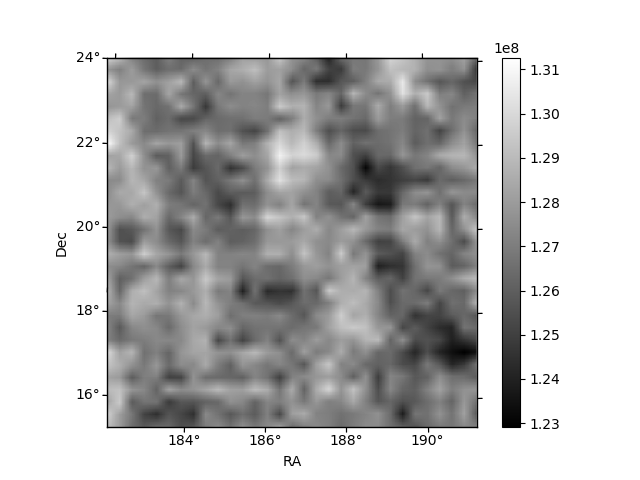
Quadrant B |
|---|---|---|---|
| Quadrant D | 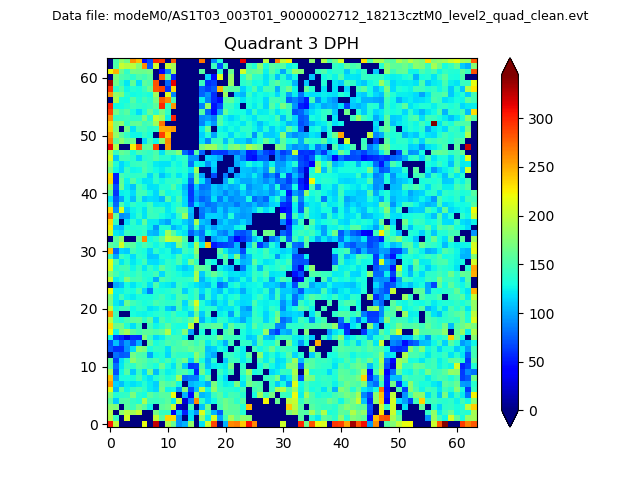 |
 |
Quadrant C |
| Plot type | Count rate plots | Images |
|---|---|---|
| Comparison with Poisson distribution Blue bars denote a histogram of data divided into 1 sec bins. Red curve is a Poisson curve with rate = median count rate of data. |
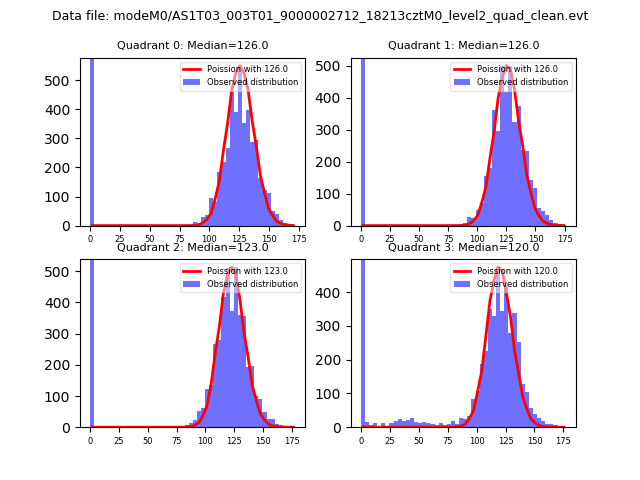 |
 |
| Quadrant-wise count rates Data is divided into 100 sec bins |
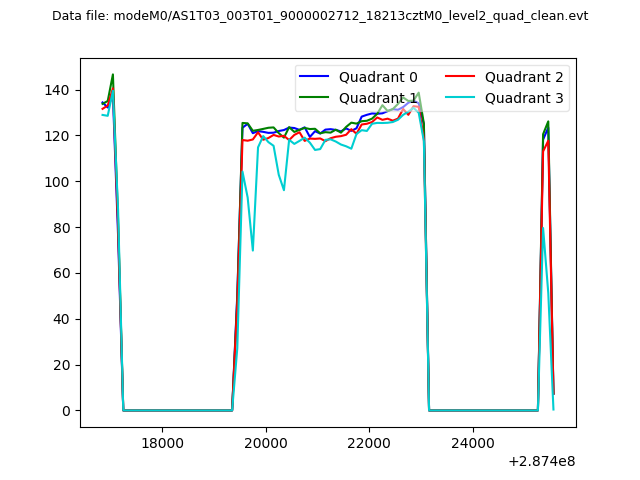 |
|
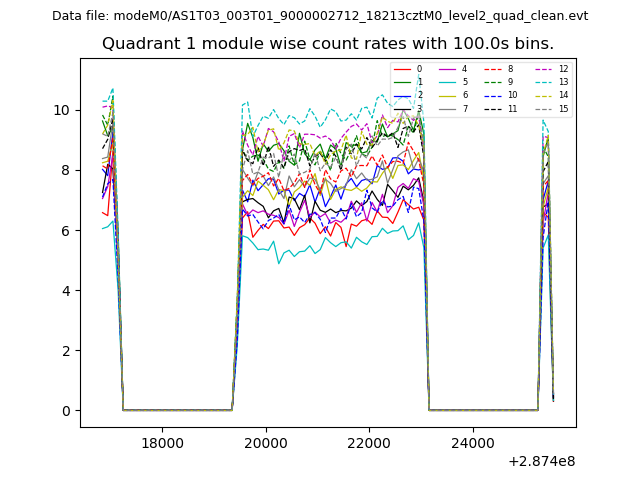
| Module-wise count rates for Quadrant A Data is divided into 100 sec bins |
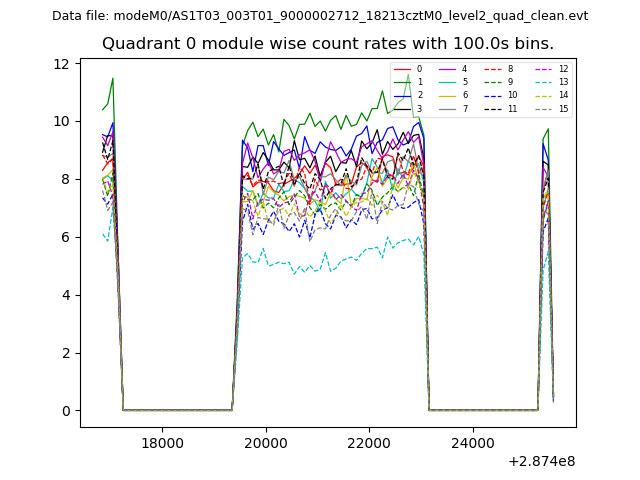 |
 |
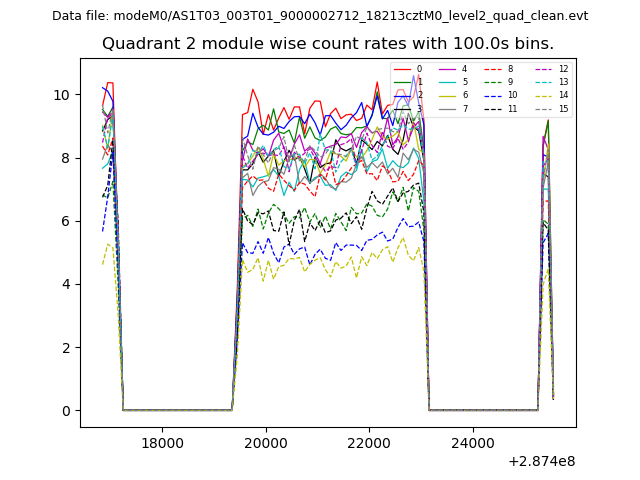
| Module-wise count rates for Quadrant B Data is divided into 100 sec bins |
 |
 |
| Module-wise count rates for Quadrant C Data is divided into 100 sec bins |
 |
 |
| Module-wise count rates for Quadrant D Data is divided into 100 sec bins |
 |
 |
| Parameter | Plot |
|---|---|
| CZT HV Monitor | 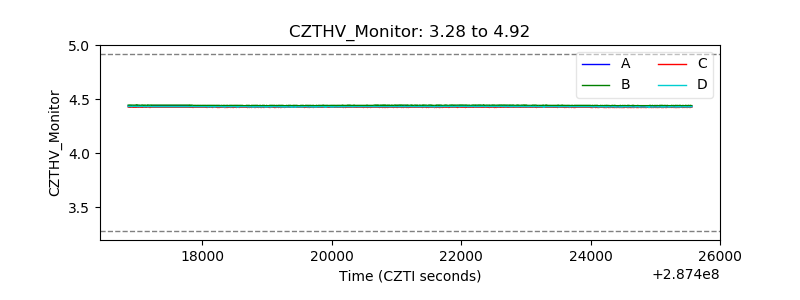 |
| D_VDD | 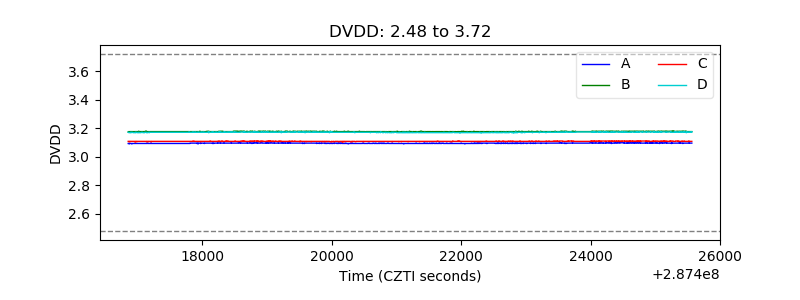 |
| Temperature 1 | 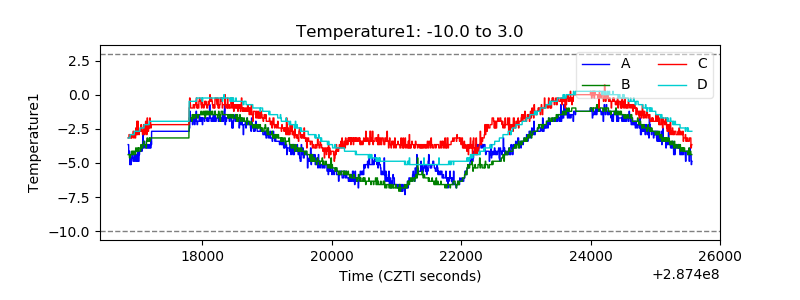 |
| Veto HV Monitor | 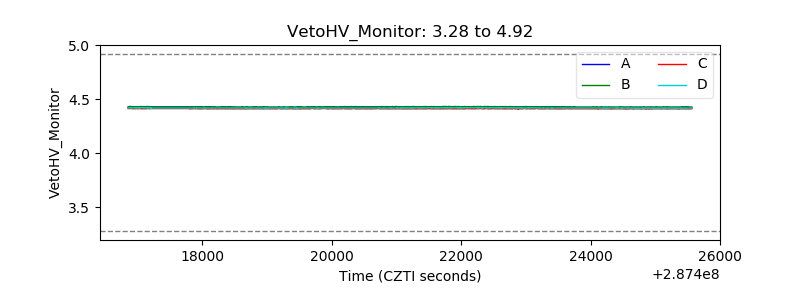 |
| Veto LLD | 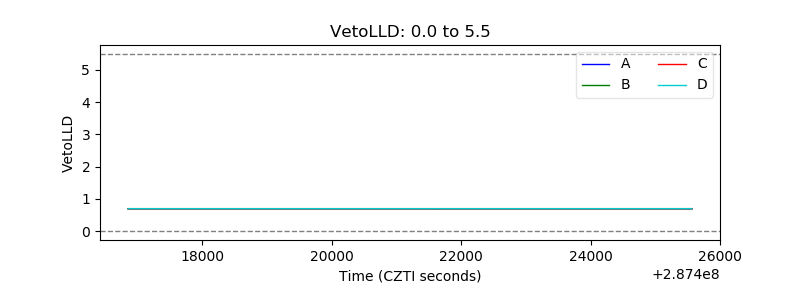 |
| Alpha Counter | 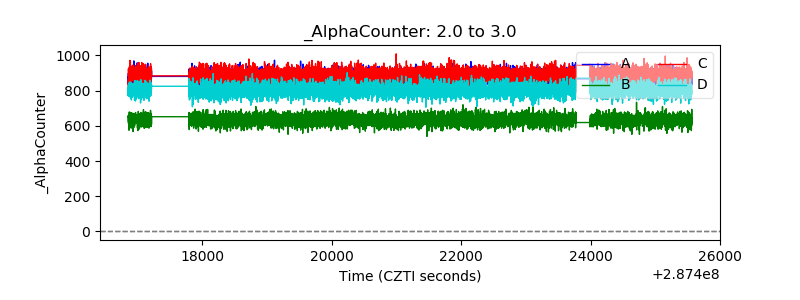 |
| _CPM_Rate | 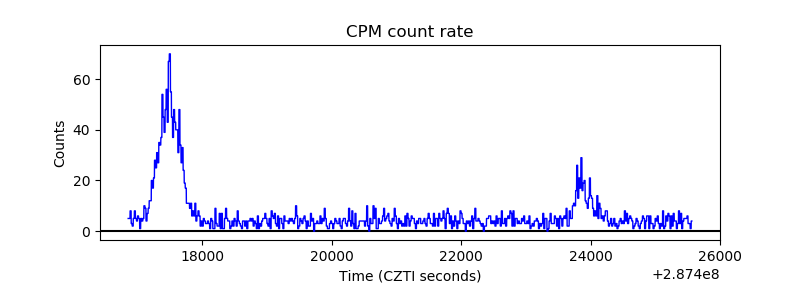 |
| CZT Counter | 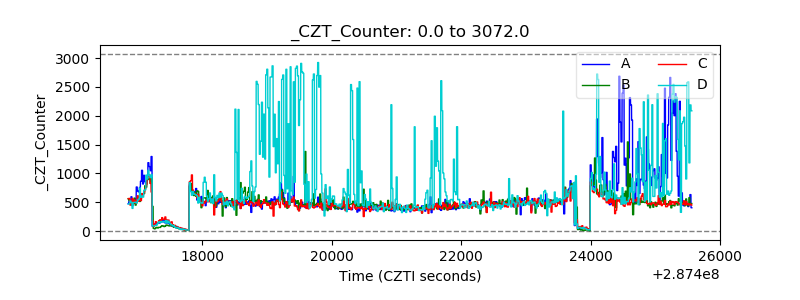 |
| +2.5 Volts monitor | 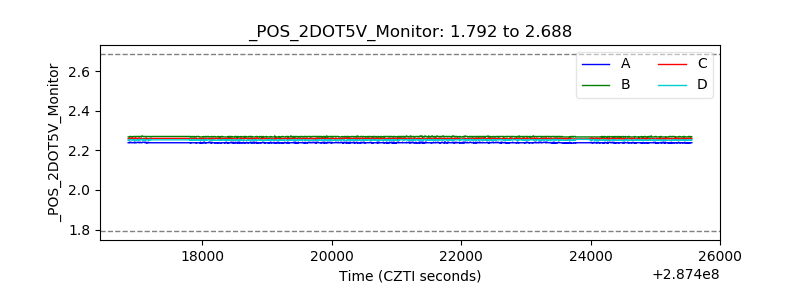 |
| +5 Volts monitor |  |
| _ROLL_ROT | 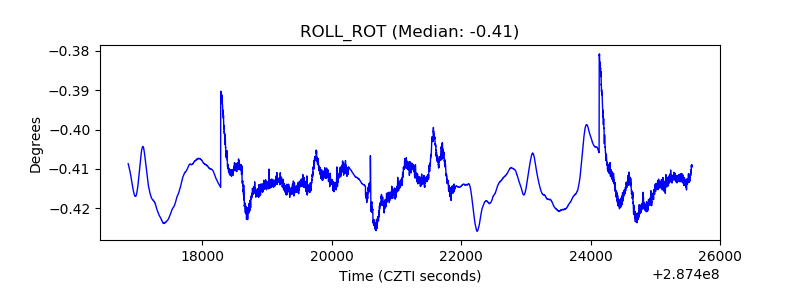 |
| _Roll_DEC |  |
| _Roll_RA | 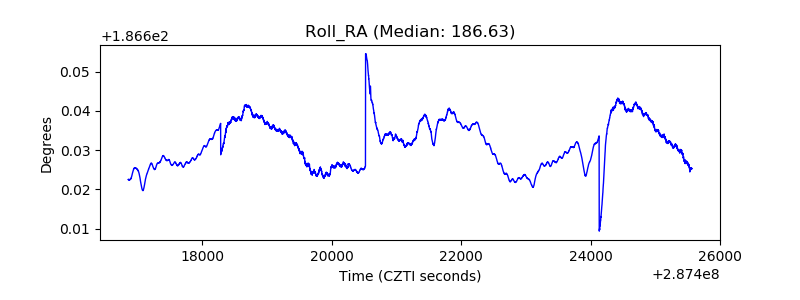 |
| Veto Counter | 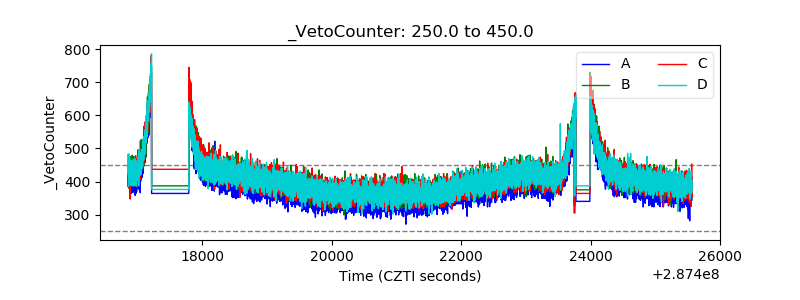 |