| Param | Original file | Final file |
|---|---|---|
| Filename | modeM0/AS1T03_003T01_9000002712_18214cztM0_level2.evt | modeM0/AS1T03_003T01_9000002712_18214cztM0_level2_quad_clean.evt |
| Size (bytes) | 637,600,320 | 83,465,280 |
| Size | 608.1 MB | 79.6 MB |
| Events in quadrant A | 4,425,874 | 520,515 |
| Events in quadrant B | 3,548,310 | 541,705 |
| Events in quadrant C | 3,383,214 | 524,781 |
| Events in quadrant D | 7,472,814 | 446,782 |
| Mode M9 | |||
|---|---|---|---|
| Quadrant | BADHDUFLAG | Total packets | Discarded packets |
| A | 0 | 3 | 0 |
| B | 0 | 3 | 0 |
| C | 0 | 3 | 0 |
| D | 0 | 3 | 0 |
| Mode M0 | |||
|---|---|---|---|
| Quadrant | BADHDUFLAG | Total packets | Discarded packets |
| A | 0 | 17924 | 1 |
| B | 0 | 15157 | 1 |
| C | 0 | 14623 | 1 |
| D | 0 | 27052 | 1 |
| Mode SS | |||
|---|---|---|---|
| Quadrant | BADHDUFLAG | Total packets | Discarded packets |
| A | 0 | 142 | 0 |
| B | 0 | 142 | 0 |
| C | 0 | 142 | 0 |
| D | 0 | 142 | 0 |
| Quadrant | Total seconds | Saturated seconds | Saturation percentage |
|---|---|---|---|
| A | 7084 | 431 | 6.084133% |
| B | 7085 | 138 | 1.947777% |
| C | 7085 | 119 | 1.679605% |
| D | 7085 | 1174 | 16.570219% |
Noise dominated data is calculated using 1-second bins in cleaned event files. If a bin has >2000 counts, and if more than 50% of those come from <1% of pixels, then it is considered to be noise-dominated and hence unusable.
| Quadrant | # 1 sec bins | Bins with >0 counts | Bins with >2000 counts | High rate bins dominated by noise | Noise dominated (total time) | Noise dominated (detector-on time) | Marked lightcurve |
|---|---|---|---|---|---|---|---|
| A | 7324 | 7085 | 250 | 250 | 3.41% | 3.53% | 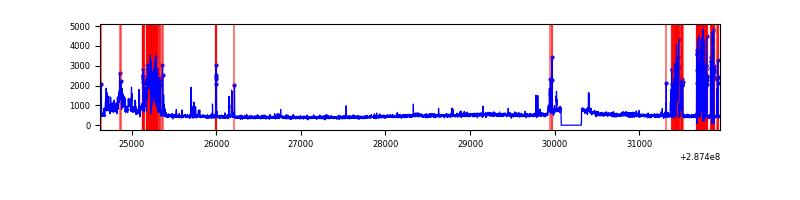 |
| B | 7325 | 7086 | 10 | 10 | 0.14% | 0.14% | 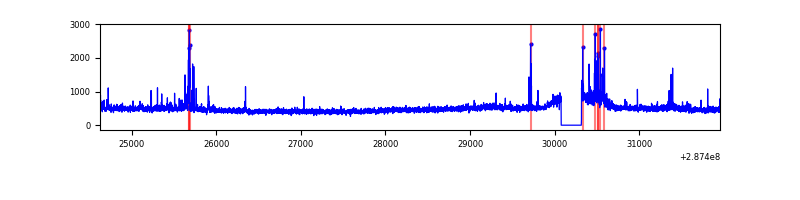 |
| C | 7325 | 7086 | 0 | 0 | 0.00% | 0.00% | 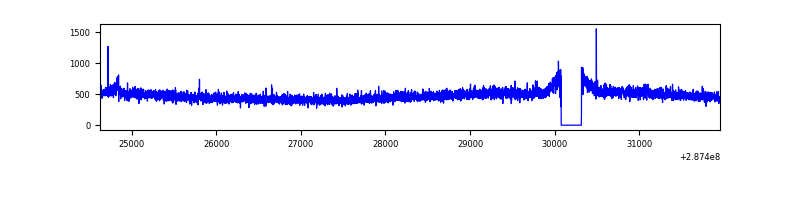 |
| D | 7325 | 7086 | 877 | 877 | 11.97% | 12.38% | 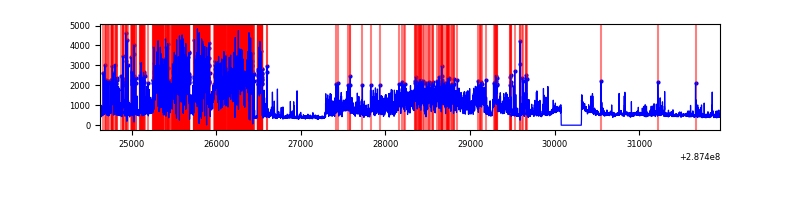 |
Top three noisy pixels from each quadrant. If the there are fewer than three noisy pixels in the level2.evt file, extra rows are filled as -1
| Pixel properties | Quadrant properties | ||||||
|---|---|---|---|---|---|---|---|
| Quadrant | DetID | PixID | Counts | Sigma | Mean | Median | Sigma |
| A | 15 | 174 | 1180759 | 6926.22 | 835 | 816 | 170.4 |
| A | 4 | 2 | 14764 | 81.87 | 835 | 816 | 170.4 |
| A | 11 | 47 | 13902 | 76.81 | 835 | 816 | 170.4 |
| B | 7 | 220 | 113340 | 687.39 | 851 | 832 | 163.7 |
| B | 0 | 197 | 40770 | 244.01 | 851 | 832 | 163.7 |
| B | 15 | 35 | 21767 | 127.91 | 851 | 832 | 163.7 |
| C | 14 | 238 | 127217 | 653.79 | 820 | 826 | 193.3 |
| C | 3 | 233 | 49353 | 251.02 | 820 | 826 | 193.3 |
| C | 0 | 207 | 6714 | 30.46 | 820 | 826 | 193.3 |
| D | 5 | 222 | 2610564 | 13758.32 | 768 | 744 | 189.7 |
| D | 1 | 52 | 1516717 | 7991.83 | 768 | 744 | 189.7 |
| D | 7 | 238 | 271204 | 1425.8 | 768 | 744 | 189.7 |
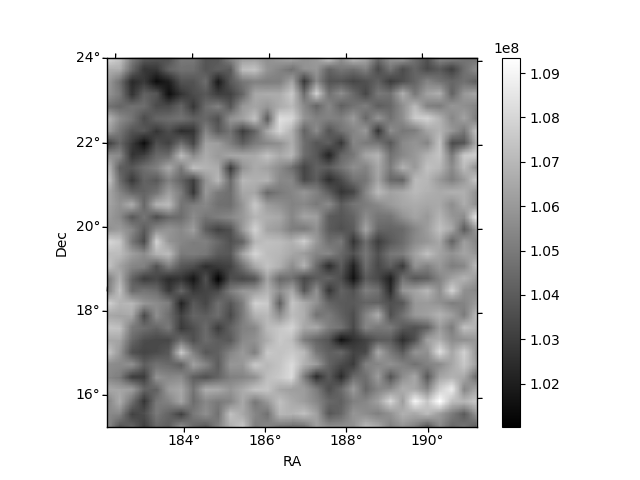
Histogram calculated using DETX and DETY for each event in the final _common_clean file
| Quadrant A | 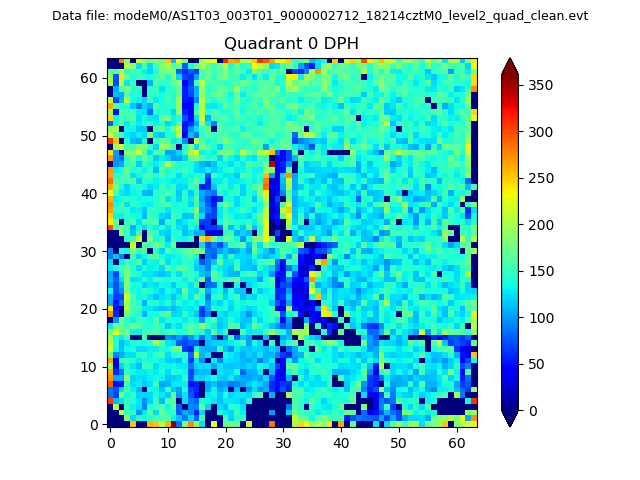 |
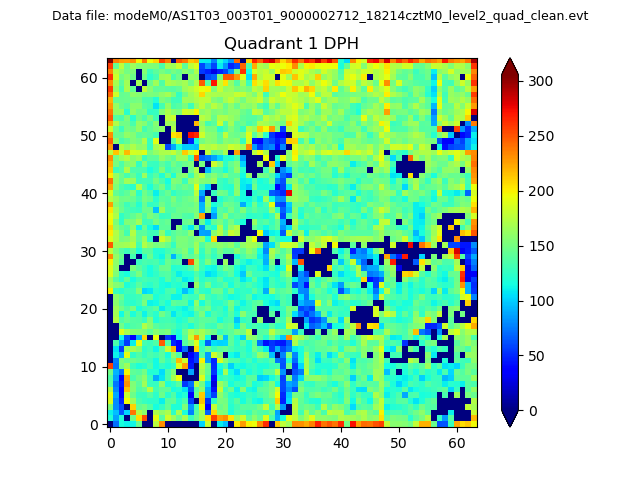 |
Quadrant B |
|---|---|---|---|
| Quadrant D | 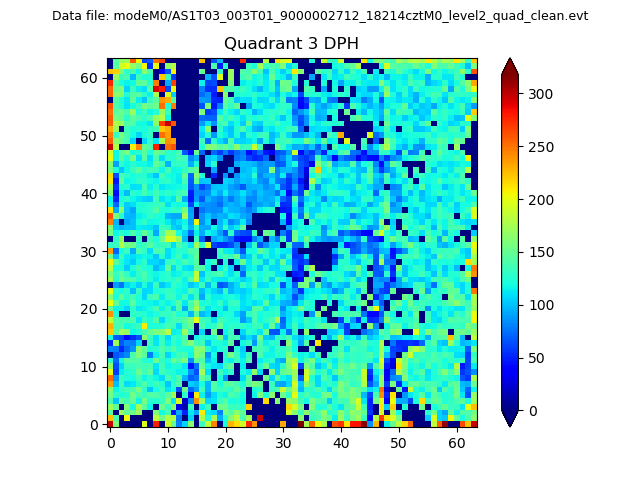 |
 |
Quadrant C |
| Plot type | Count rate plots | Images |
|---|---|---|
| Comparison with Poisson distribution Blue bars denote a histogram of data divided into 1 sec bins. Red curve is a Poisson curve with rate = median count rate of data. |
 |
 |
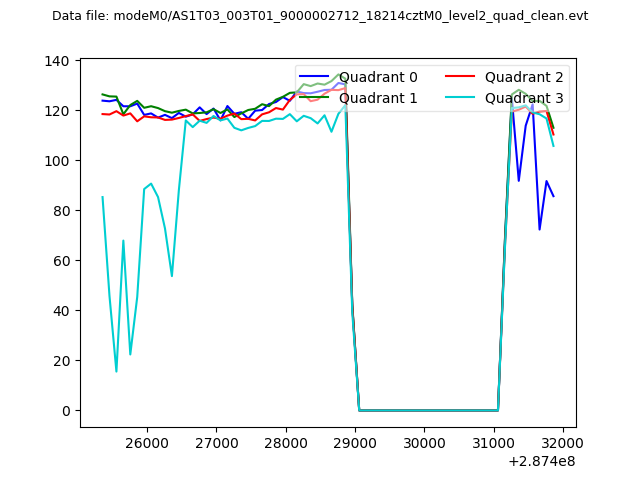
| Quadrant-wise count rates Data is divided into 100 sec bins |
 |
|
| Module-wise count rates for Quadrant A Data is divided into 100 sec bins |
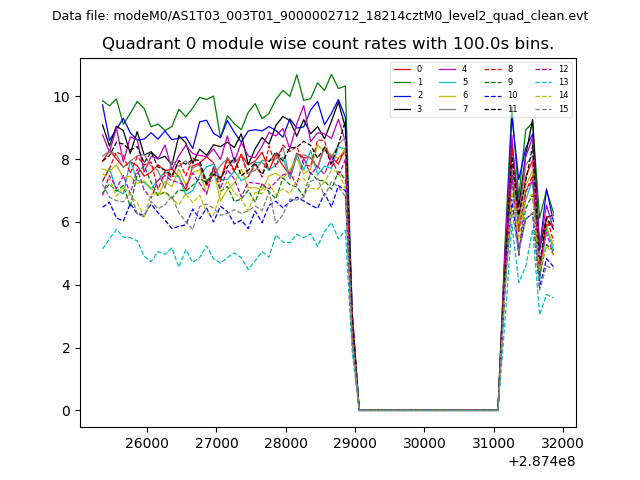 |
 |
| Module-wise count rates for Quadrant B Data is divided into 100 sec bins |
 |
 |
| Module-wise count rates for Quadrant C Data is divided into 100 sec bins |
 |
 |
| Module-wise count rates for Quadrant D Data is divided into 100 sec bins |
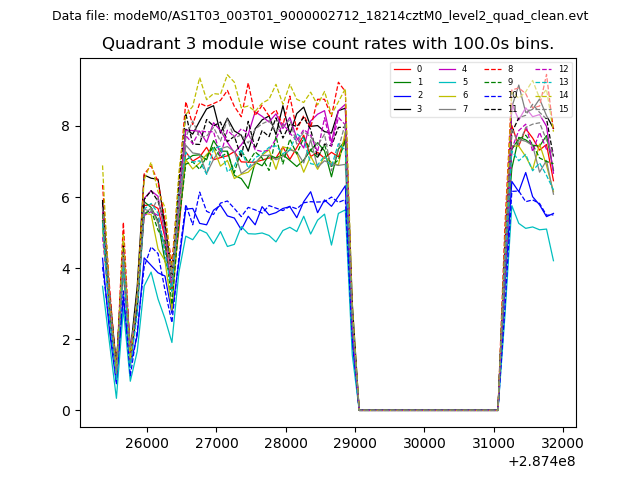 |
 |
| Parameter | Plot |
|---|---|
| CZT HV Monitor | 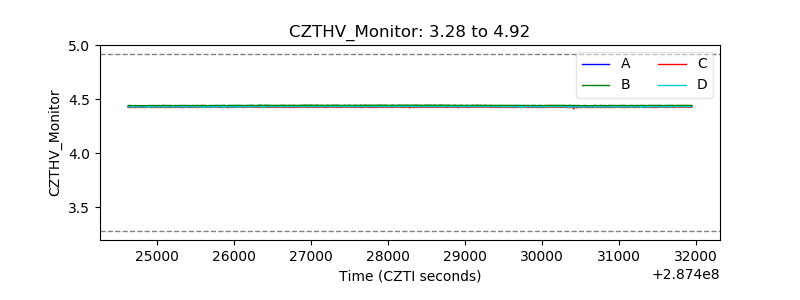 |
| D_VDD | 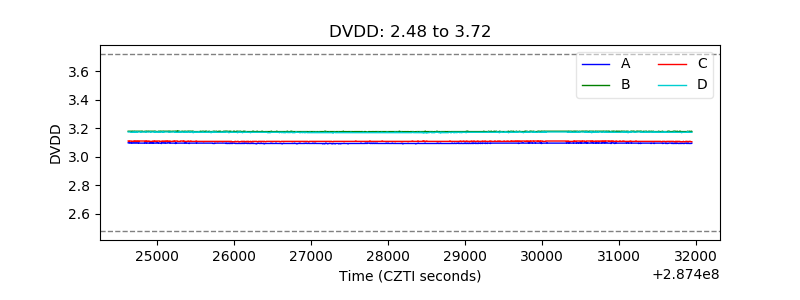 |
| Temperature 1 | 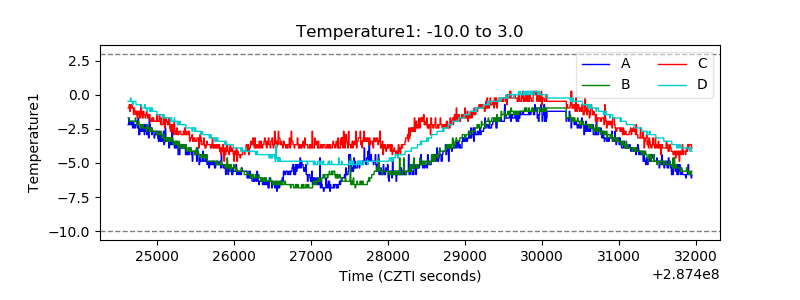 |
| Veto HV Monitor | 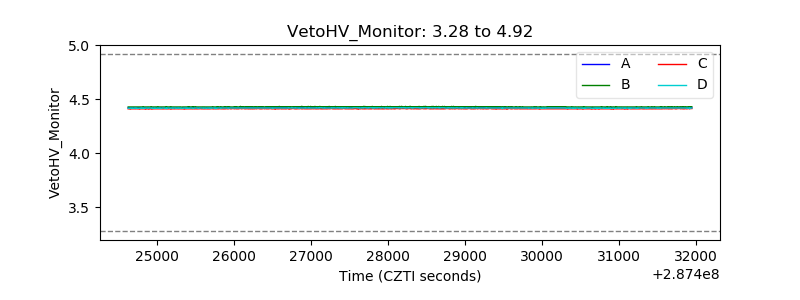 |
| Veto LLD | 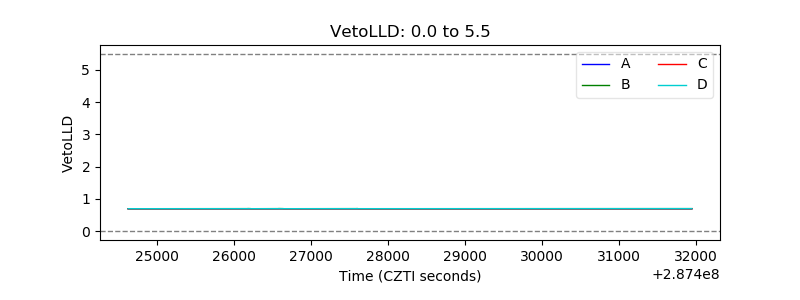 |
| Alpha Counter | 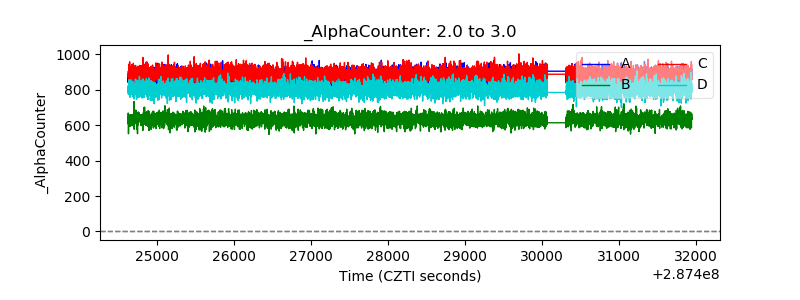 |
| _CPM_Rate | 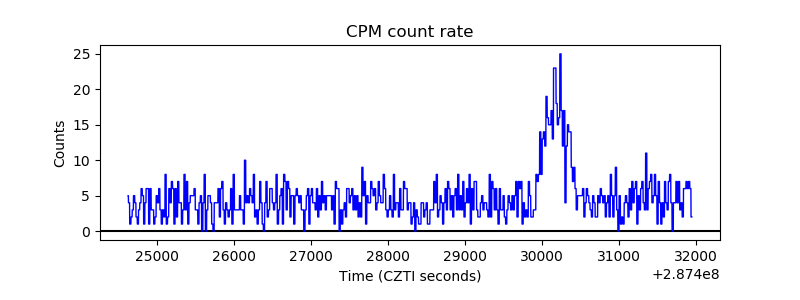 |
| CZT Counter | 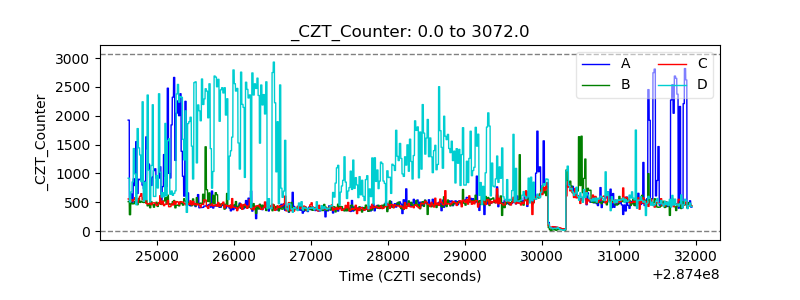 |
| +2.5 Volts monitor |  |
| +5 Volts monitor |  |
| _ROLL_ROT | 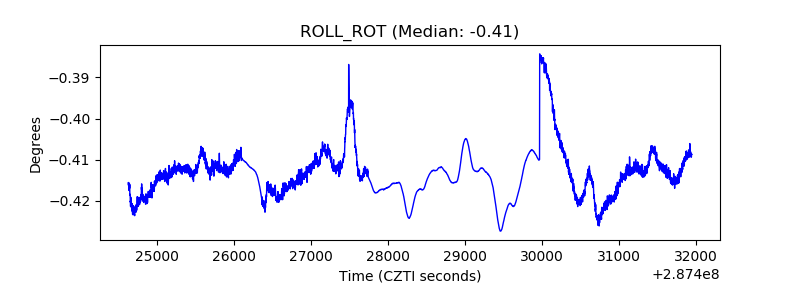 |
| _Roll_DEC | 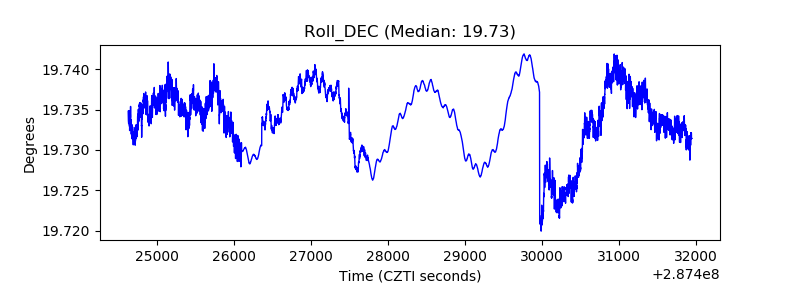 |
| _Roll_RA | 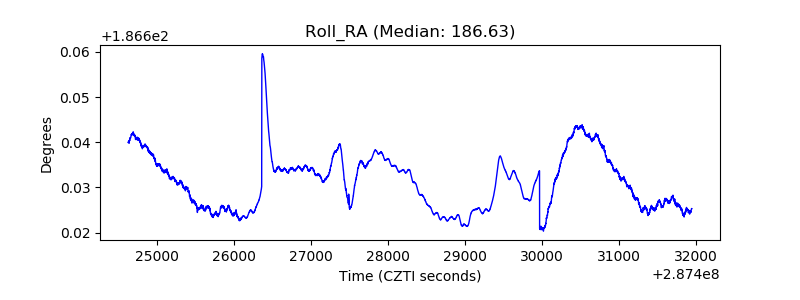 |
| Veto Counter | 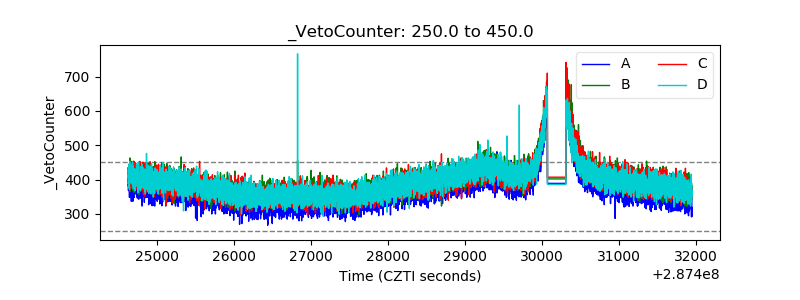 |