| Param | Original file | Final file |
|---|---|---|
| Filename | modeM0/AS1C04_009T03_9000002714cztM0_level2.fits | modeM0/AS1C04_009T03_9000002714cztM0_level2_quad_clean.evt |
| Size (bytes) | 220,746,240 | 256,659,840 |
| Size | 210.5 MB | 244.8 MB |
| Events in quadrant A | 1,351,042 | 1,601,517 |
| Events in quadrant B | 1,294,326 | 1,619,148 |
| Events in quadrant C | 1,305,904 | 1,543,388 |
| Events in quadrant D | 1,138,338 | 1,413,044 |
| Mode M0 | |||
|---|---|---|---|
| Quadrant | BADHDUFLAG | Total packets | Discarded packets |
| A | 0 | 48952 | 0 |
| B | 0 | 48469 | 0 |
| C | 0 | 47232 | 0 |
| D | 0 | 55678 | 0 |
| Mode SS | |||
|---|---|---|---|
| Quadrant | BADHDUFLAG | Total packets | Discarded packets |
| A | 0 | 474 | 0 |
| B | 0 | 474 | 0 |
| C | 0 | 474 | 0 |
| D | 0 | 474 | 0 |
| Mode M9 | |||
|---|---|---|---|
| Quadrant | BADHDUFLAG | Total packets | Discarded packets |
| A | 0 | 40 | 0 |
| B | 0 | 40 | 0 |
| C | 0 | 40 | 0 |
| D | 0 | 40 | 0 |
| Quadrant | Total seconds | Saturated seconds | Saturation percentage |
|---|---|---|---|
| A | 23184 | 203 | 0.875604% |
| B | 23184 | 173 | 0.746204% |
| C | 23184 | 157 | 0.677191% |
| D | 23184 | 460 | 1.984127% |
Noise dominated data is calculated using 1-second bins in cleaned event files. If a bin has >2000 counts, and if more than 50% of those come from <1% of pixels, then it is considered to be noise-dominated and hence unusable.
| Quadrant | # 1 sec bins | Bins with >0 counts | Bins with >2000 counts | High rate bins dominated by noise | Noise dominated (total time) | Noise dominated (detector-on time) | Marked lightcurve |
|---|---|---|---|---|---|---|---|
| A | 27254 | 23165 | 0 | 0 | 0.00% | 0.00% |  |
| B | 27254 | 23184 | 0 | 0 | 0.00% | 0.00% |  |
| C | 27254 | 23184 | 0 | 0 | 0.00% | 0.00% |  |
| D | 27254 | 23183 | 0 | 0 | 0.00% | 0.00% |  |
Top three noisy pixels from each quadrant. If the there are fewer than three noisy pixels in the level2.evt file, extra rows are filled as -1
| Pixel properties | Quadrant properties | ||||||
|---|---|---|---|---|---|---|---|
| Quadrant | DetID | PixID | Counts | Sigma | Mean | Median | Sigma |
| A | 0 | 29 | 1230 | 10.21 | 351 | 331 | 88.0 |
| A | 7 | 110 | 1117 | 8.93 | 351 | 331 | 88.0 |
| A | 9 | 19 | 1013 | 7.75 | 351 | 331 | 88.0 |
| B | 2 | 9 | 1077 | 10.73 | 342 | 328 | 69.8 |
| B | 2 | 8 | 917 | 8.44 | 342 | 328 | 69.8 |
| B | 5 | 128 | 868 | 7.74 | 342 | 328 | 69.8 |
| C | 12 | 241 | 958 | 7.11 | 345 | 325 | 89.0 |
| C | 3 | 126 | 879 | 6.23 | 345 | 325 | 89.0 |
| C | 7 | 111 | 874 | 6.17 | 345 | 325 | 89.0 |
| D | 10 | 190 | 904 | 6.79 | 325 | 295 | 89.7 |
| D | 10 | 189 | 871 | 6.42 | 325 | 295 | 89.7 |
| D | 3 | 14 | 839 | 6.07 | 325 | 295 | 89.7 |
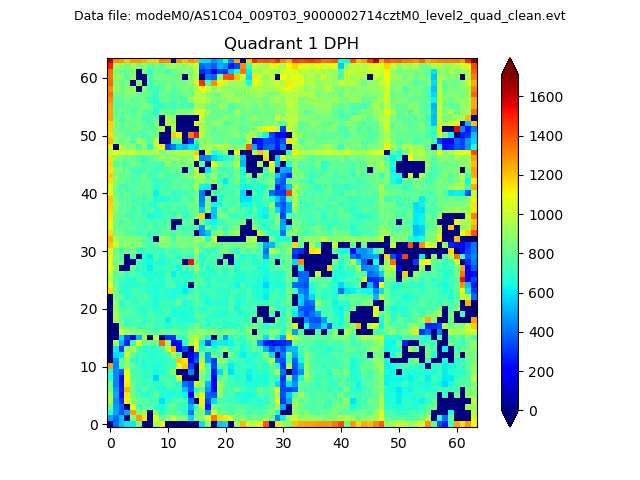
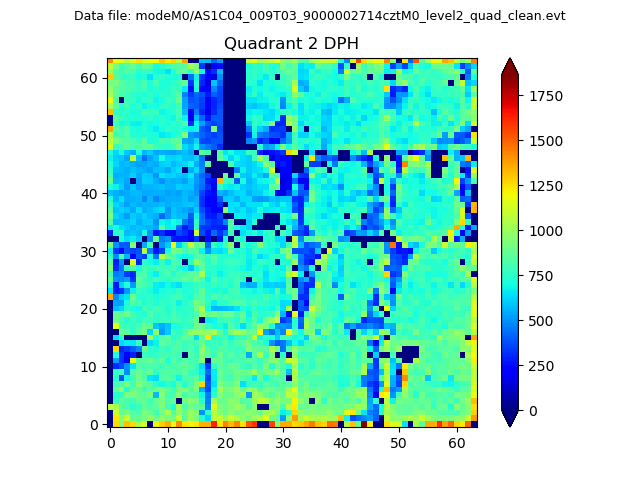
Histogram calculated using DETX and DETY for each event in the final _common_clean file
| Quadrant A |  |
 |
Quadrant B |
|---|---|---|---|
| Quadrant D |  |
 |
Quadrant C |
| Plot type | Count rate plots | Images |
|---|---|---|
| Comparison with Poisson distribution Blue bars denote a histogram of data divided into 1 sec bins. Red curve is a Poisson curve with rate = median count rate of data. |
 |
 |
| Quadrant-wise count rates Data is divided into 100 sec bins |
 |
|
| Module-wise count rates for Quadrant A Data is divided into 100 sec bins |
 |
 |
| Module-wise count rates for Quadrant B Data is divided into 100 sec bins |
 |
 |
| Module-wise count rates for Quadrant C Data is divided into 100 sec bins |
 |
 |
| Module-wise count rates for Quadrant D Data is divided into 100 sec bins |
 |
 |
| Parameter | Plot |
|---|---|
| CZT HV Monitor | 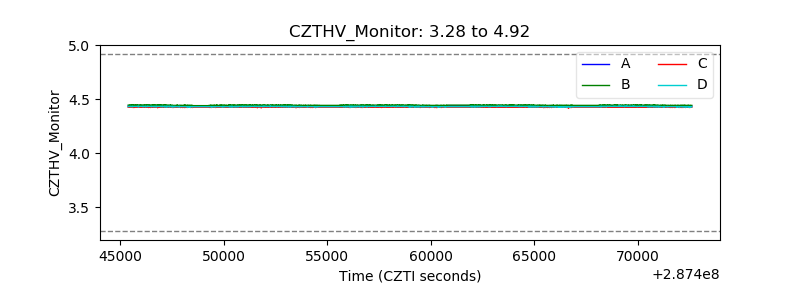 |
| D_VDD | 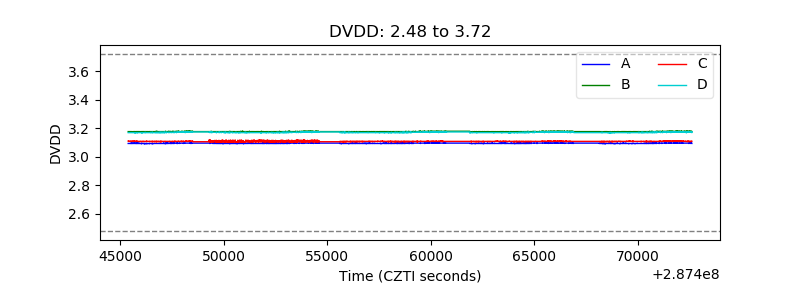 |
| Temperature 1 |  |
| Veto HV Monitor |  |
| Veto LLD |  |
| Alpha Counter |  |
| _CPM_Rate |  |
| CZT Counter |  |
| +2.5 Volts monitor |  |
| +5 Volts monitor |  |
| _ROLL_ROT | 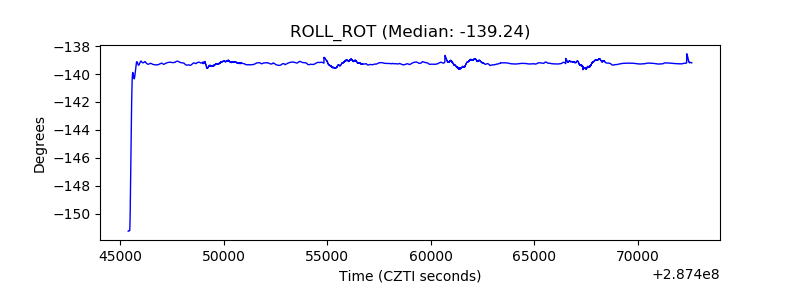 |
| _Roll_DEC | 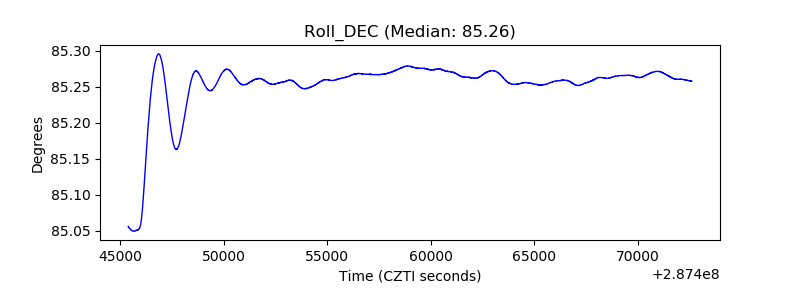 |
| _Roll_RA |  |
| Veto Counter |  |