| Param | Original file | Final file |
|---|---|---|
| Filename | modeM0/AS1C04_009T03_9000002714_18218cztM0_level2.evt | modeM0/AS1C04_009T03_9000002714_18218cztM0_level2_quad_clean.evt |
| Size (bytes) | 693,201,600 | 184,452,480 |
| Size | 661.1 MB | 175.9 MB |
| Events in quadrant A | 4,557,840 | 1,236,821 |
| Events in quadrant B | 4,668,928 | 1,255,437 |
| Events in quadrant C | 4,596,387 | 1,218,289 |
| Events in quadrant D | 6,491,600 | 1,182,358 |
| Mode M0 | |||
|---|---|---|---|
| Quadrant | BADHDUFLAG | Total packets | Discarded packets |
| A | 0 | 20483 | 2 |
| B | 0 | 20790 | 2 |
| C | 0 | 20388 | 2 |
| D | 0 | 26390 | 2 |
| Mode SS | |||
|---|---|---|---|
| Quadrant | BADHDUFLAG | Total packets | Discarded packets |
| A | 0 | 206 | 0 |
| B | 0 | 206 | 0 |
| C | 0 | 206 | 0 |
| D | 0 | 206 | 0 |
| Mode M9 | |||
|---|---|---|---|
| Quadrant | BADHDUFLAG | Total packets | Discarded packets |
| A | 0 | 17 | 0 |
| B | 0 | 17 | 0 |
| C | 0 | 17 | 0 |
| D | 0 | 17 | 0 |
| Quadrant | Total seconds | Saturated seconds | Saturation percentage |
|---|---|---|---|
| A | 10013 | 30 | 0.299611% |
| B | 10013 | 46 | 0.459403% |
| C | 10013 | 73 | 0.729052% |
| D | 10013 | 323 | 3.225806% |
Noise dominated data is calculated using 1-second bins in cleaned event files. If a bin has >2000 counts, and if more than 50% of those come from <1% of pixels, then it is considered to be noise-dominated and hence unusable.
| Quadrant | # 1 sec bins | Bins with >0 counts | Bins with >2000 counts | High rate bins dominated by noise | Noise dominated (total time) | Noise dominated (detector-on time) | Marked lightcurve |
|---|---|---|---|---|---|---|---|
| A | 11758 | 10015 | 1 | 1 | 0.01% | 0.01% |  |
| B | 11758 | 10015 | 4 | 4 | 0.03% | 0.04% |  |
| C | 11758 | 10015 | 0 | 0 | 0.00% | 0.00% | 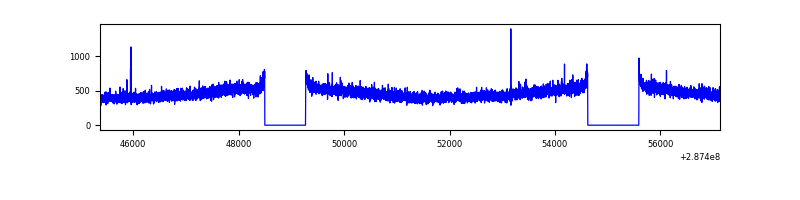 |
| D | 11758 | 10015 | 212 | 212 | 1.80% | 2.12% | 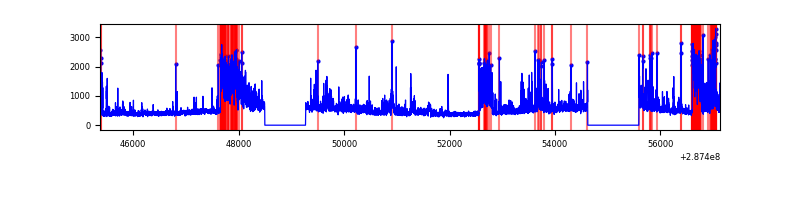 |
Top three noisy pixels from each quadrant. If the there are fewer than three noisy pixels in the level2.evt file, extra rows are filled as -1
| Pixel properties | Quadrant properties | ||||||
|---|---|---|---|---|---|---|---|
| Quadrant | DetID | PixID | Counts | Sigma | Mean | Median | Sigma |
| A | 15 | 174 | 73306 | 309.29 | 1164 | 1140 | 233.3 |
| A | 0 | 226 | 10182 | 38.75 | 1164 | 1140 | 233.3 |
| A | 3 | 137 | 8925 | 33.36 | 1164 | 1140 | 233.3 |
| B | 0 | 189 | 48566 | 213.0 | 1163 | 1132 | 222.7 |
| B | 12 | 111 | 26341 | 113.2 | 1163 | 1132 | 222.7 |
| B | 11 | 111 | 23233 | 99.24 | 1163 | 1132 | 222.7 |
| C | 14 | 238 | 174820 | 667.76 | 1119 | 1124 | 260.1 |
| C | 3 | 233 | 28912 | 106.83 | 1119 | 1124 | 260.1 |
| C | 8 | 128 | 12036 | 41.95 | 1119 | 1124 | 260.1 |
| D | 1 | 52 | 1460258 | 5334.1 | 1125 | 1091 | 273.6 |
| D | 7 | 238 | 446445 | 1628.02 | 1125 | 1091 | 273.6 |
| D | 2 | 33 | 145100 | 526.43 | 1125 | 1091 | 273.6 |
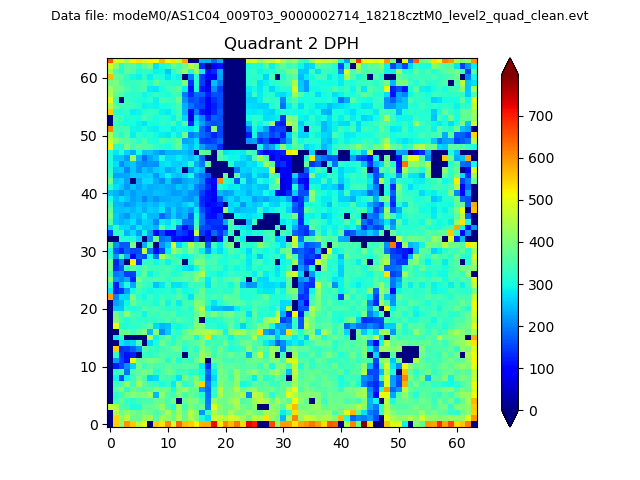
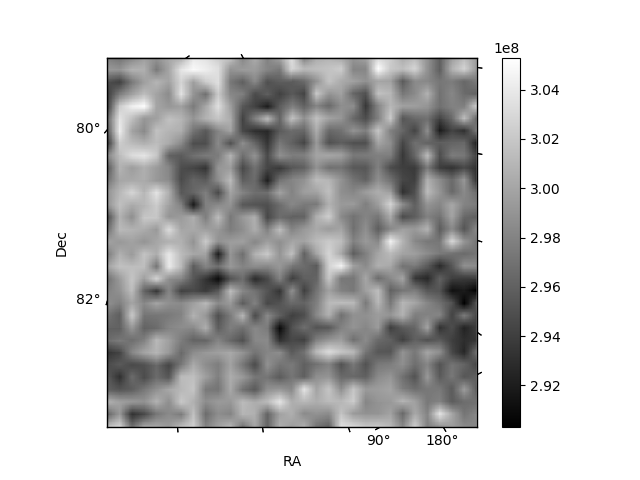
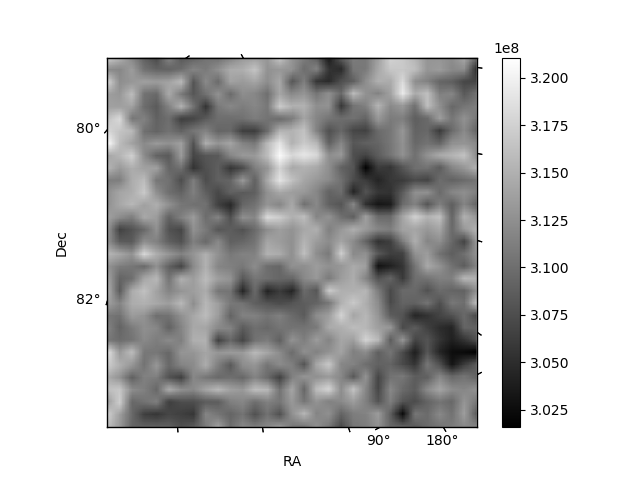
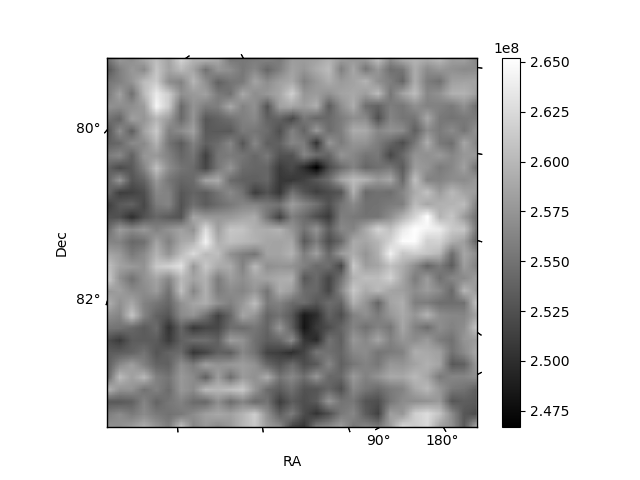
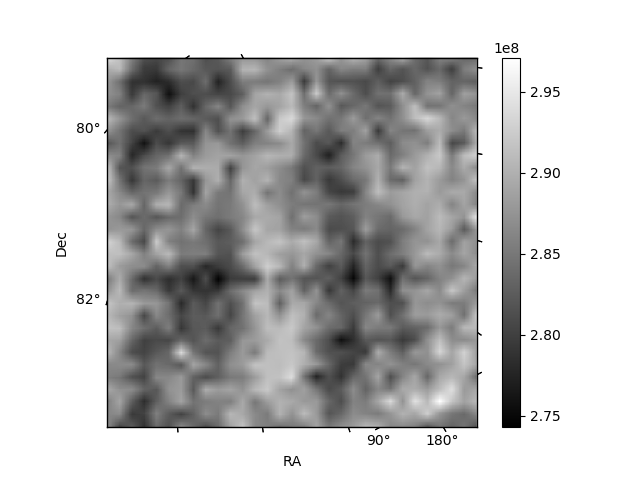
Histogram calculated using DETX and DETY for each event in the final _common_clean file
| Quadrant A | 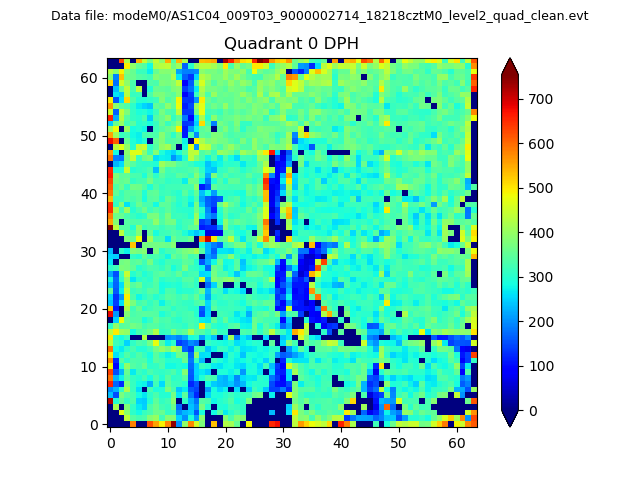 |
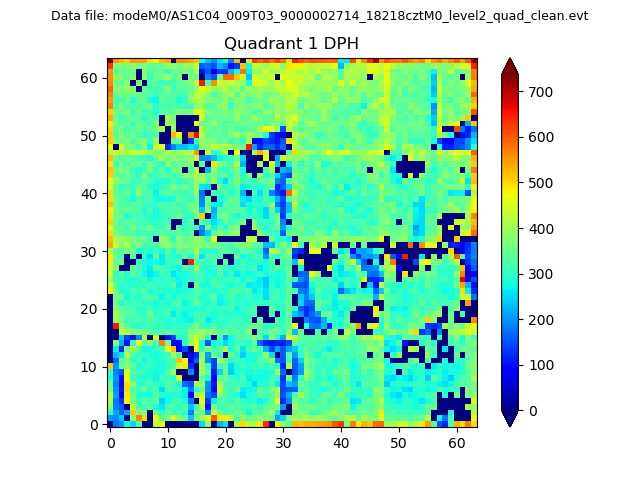 |
Quadrant B |
|---|---|---|---|
| Quadrant D | 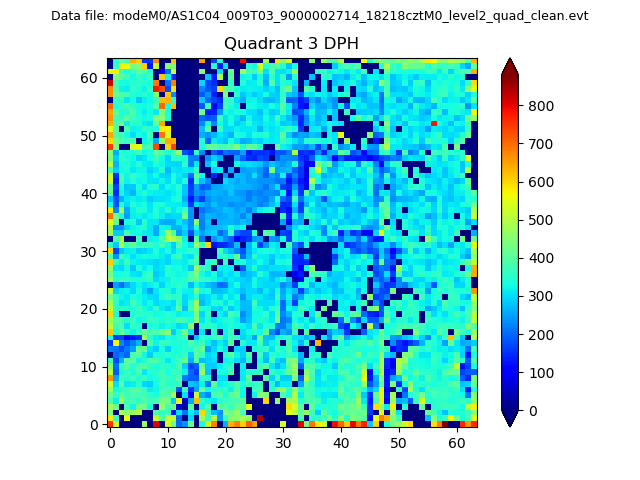 |
 |
Quadrant C |
| Plot type | Count rate plots | Images |
|---|---|---|
| Comparison with Poisson distribution Blue bars denote a histogram of data divided into 1 sec bins. Red curve is a Poisson curve with rate = median count rate of data. |
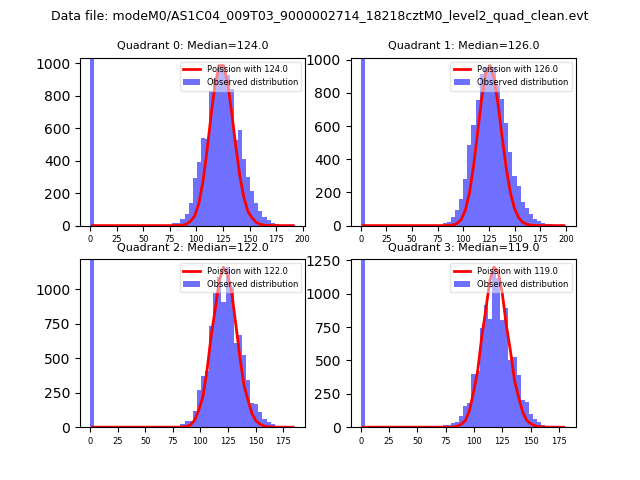 |
 |
| Quadrant-wise count rates Data is divided into 100 sec bins |
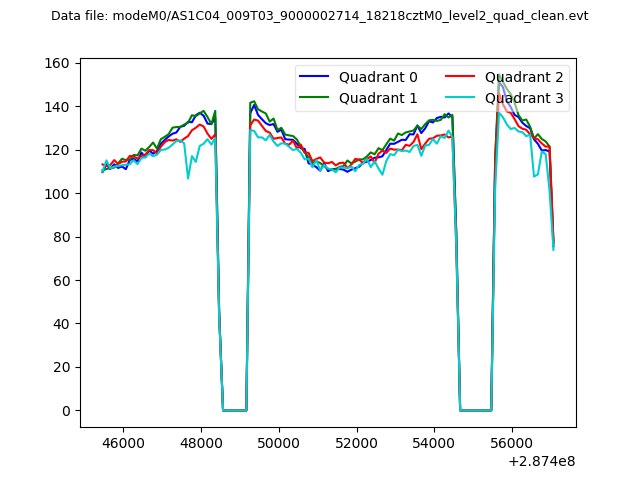 |
|
| Module-wise count rates for Quadrant A Data is divided into 100 sec bins |
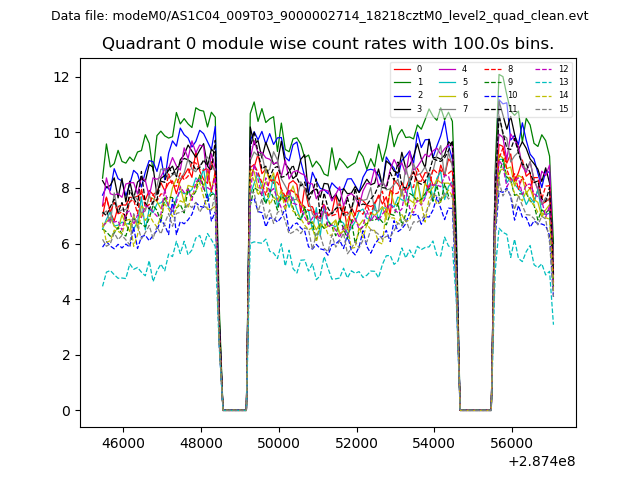 |
 |
| Module-wise count rates for Quadrant B Data is divided into 100 sec bins |
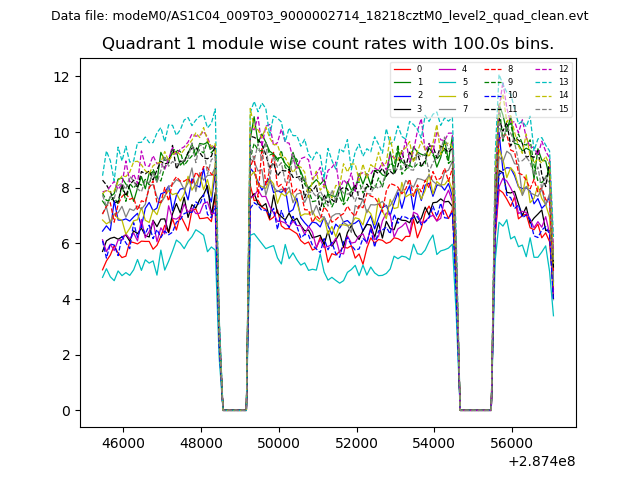 |
 |
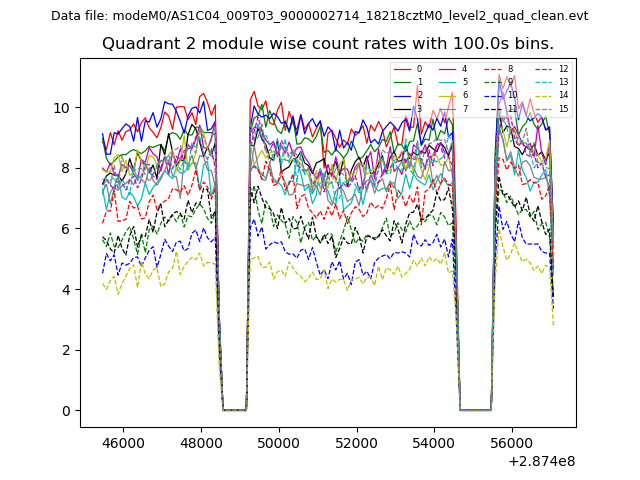
| Module-wise count rates for Quadrant C Data is divided into 100 sec bins |
 |
 |
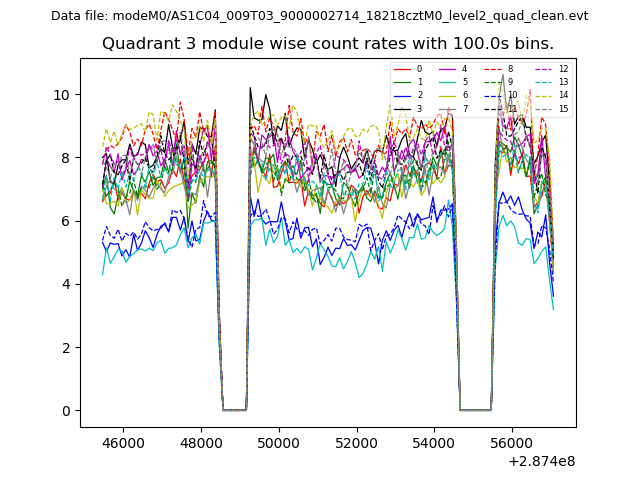
| Module-wise count rates for Quadrant D Data is divided into 100 sec bins |
 |
 |
| Parameter | Plot |
|---|---|
| CZT HV Monitor | 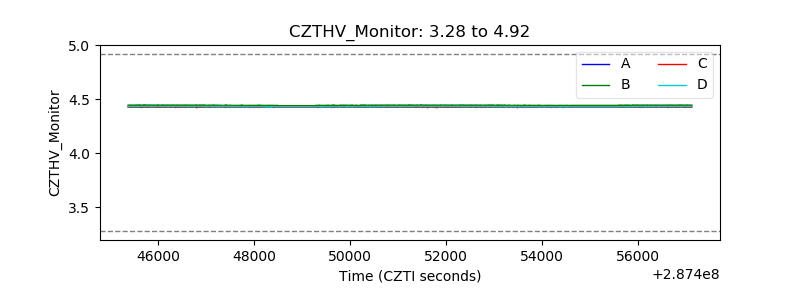 |
| D_VDD | 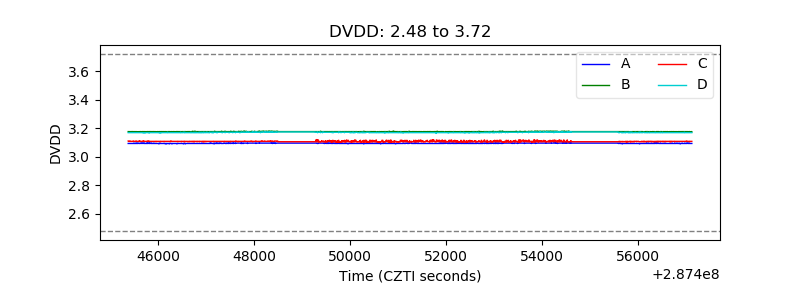 |
| Temperature 1 | 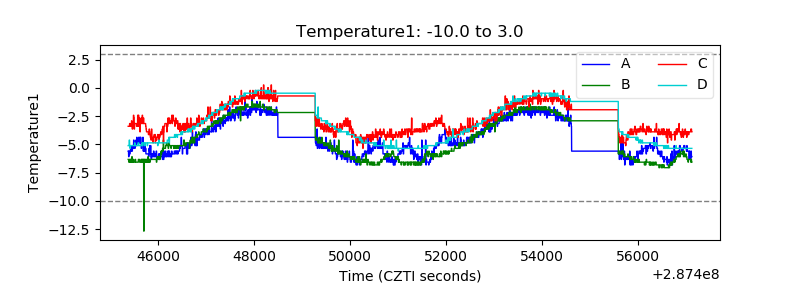 |
| Veto HV Monitor | 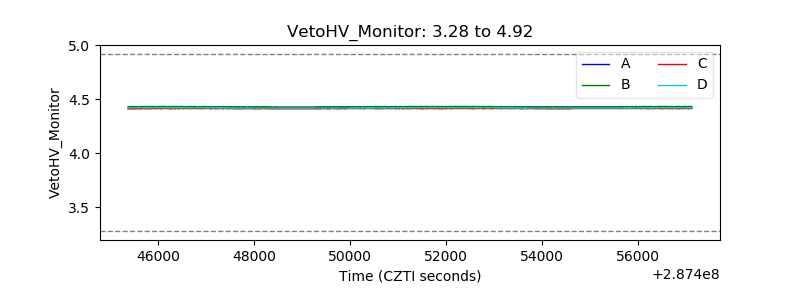 |
| Veto LLD |  |
| Alpha Counter | 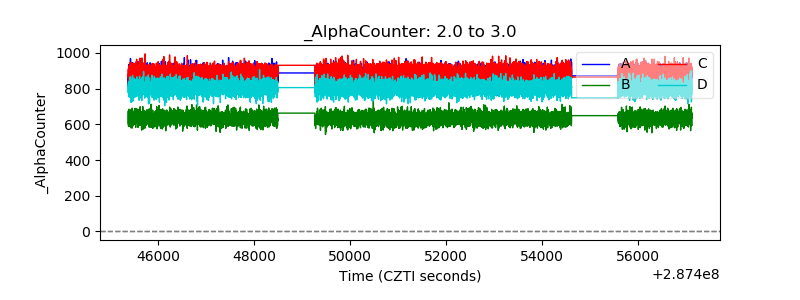 |
| _CPM_Rate | 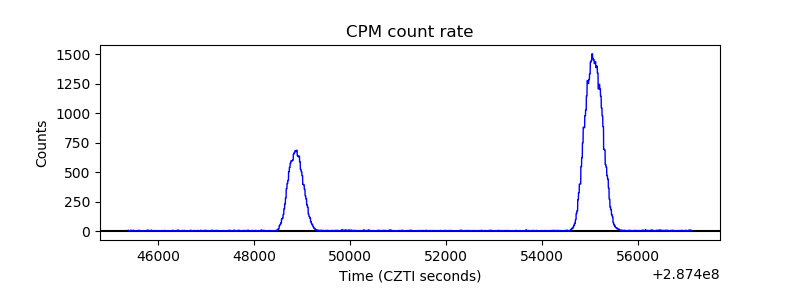 |
| CZT Counter | 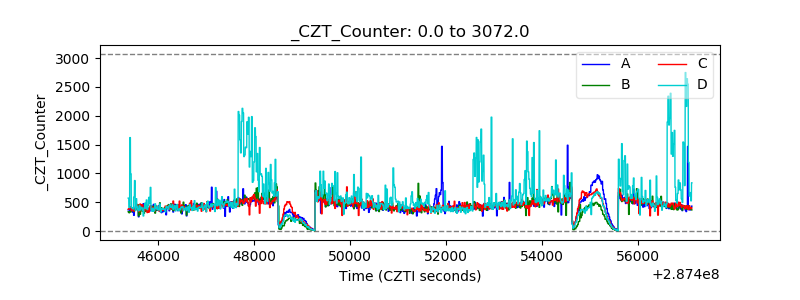 |
| +2.5 Volts monitor | 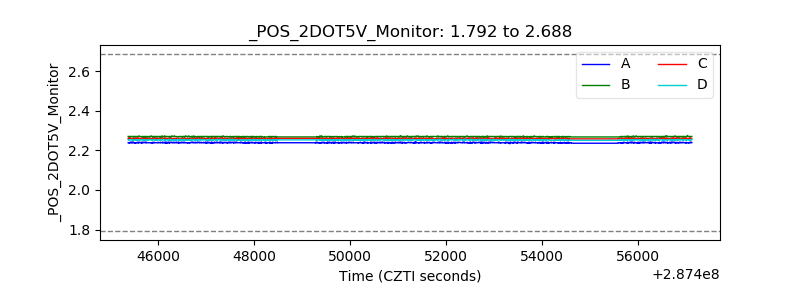 |
| +5 Volts monitor |  |
| _ROLL_ROT | 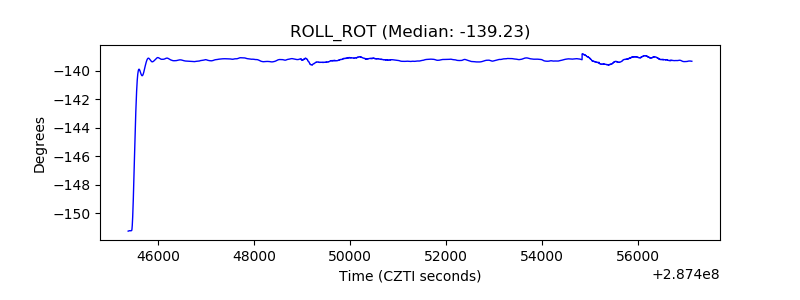 |
| _Roll_DEC | 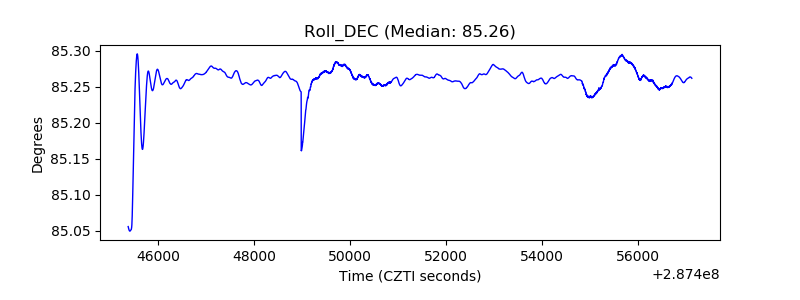 |
| _Roll_RA | 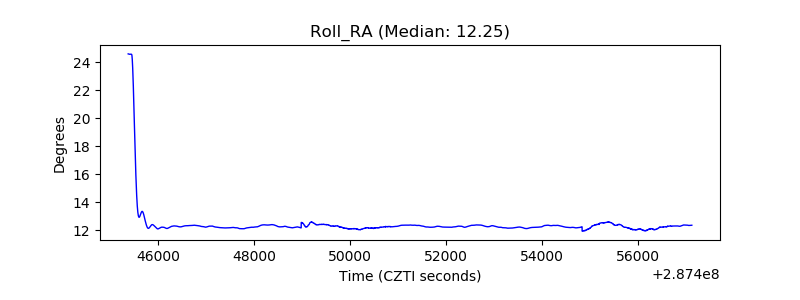 |
| Veto Counter | 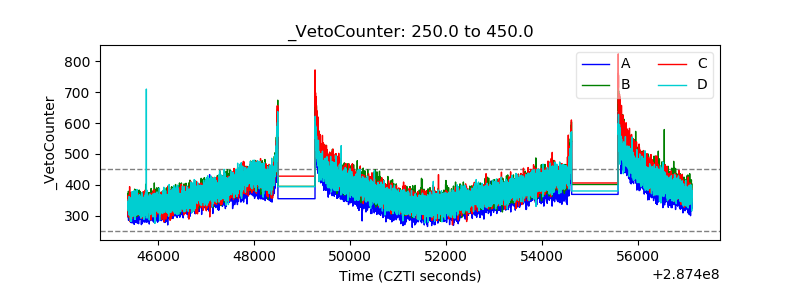 |