| Param | Original file | Final file |
|---|---|---|
| Filename | modeM0/AS1C04_009T03_9000002714_18220cztM0_level2.evt | modeM0/AS1C04_009T03_9000002714_18220cztM0_level2_quad_clean.evt |
| Size (bytes) | 456,969,600 | 128,566,080 |
| Size | 435.8 MB | 122.6 MB |
| Events in quadrant A | 3,097,492 | 867,485 |
| Events in quadrant B | 3,165,605 | 884,213 |
| Events in quadrant C | 3,095,452 | 852,468 |
| Events in quadrant D | 4,026,954 | 824,488 |
| Mode M0 | |||
|---|---|---|---|
| Quadrant | BADHDUFLAG | Total packets | Discarded packets |
| A | 0 | 13768 | 2 |
| B | 0 | 13837 | 2 |
| C | 0 | 13664 | 2 |
| D | 0 | 16518 | 2 |
| Mode SS | |||
|---|---|---|---|
| Quadrant | BADHDUFLAG | Total packets | Discarded packets |
| A | 0 | 134 | 0 |
| B | 0 | 134 | 0 |
| C | 0 | 134 | 0 |
| D | 0 | 134 | 0 |
| Mode M9 | |||
|---|---|---|---|
| Quadrant | BADHDUFLAG | Total packets | Discarded packets |
| A | 0 | 14 | 0 |
| B | 0 | 15 | 0 |
| C | 0 | 15 | 0 |
| D | 0 | 15 | 0 |
| Quadrant | Total seconds | Saturated seconds | Saturation percentage |
|---|---|---|---|
| A | 6682 | 22 | 0.329243% |
| B | 6682 | 31 | 0.463933% |
| C | 6682 | 47 | 0.703382% |
| D | 6682 | 166 | 2.484286% |
Noise dominated data is calculated using 1-second bins in cleaned event files. If a bin has >2000 counts, and if more than 50% of those come from <1% of pixels, then it is considered to be noise-dominated and hence unusable.
| Quadrant | # 1 sec bins | Bins with >0 counts | Bins with >2000 counts | High rate bins dominated by noise | Noise dominated (total time) | Noise dominated (detector-on time) | Marked lightcurve |
|---|---|---|---|---|---|---|---|
| A | 7787 | 6683 | 2 | 2 | 0.03% | 0.03% | 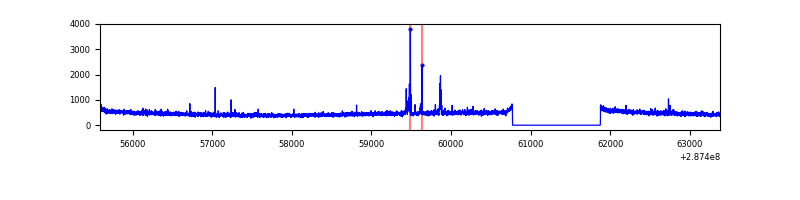 |
| B | 7787 | 6683 | 4 | 4 | 0.05% | 0.06% | 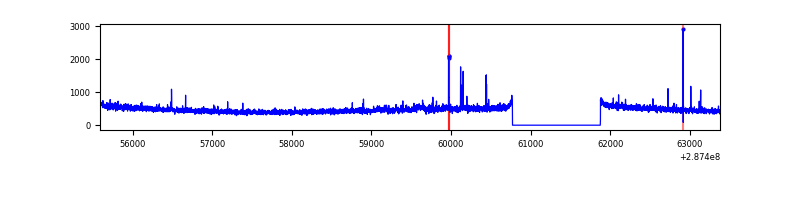 |
| C | 7787 | 6683 | 0 | 0 | 0.00% | 0.00% | 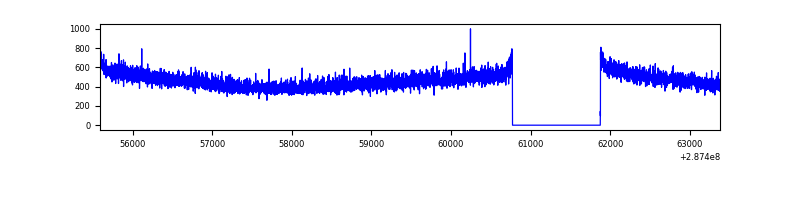 |
| D | 7787 | 6683 | 147 | 147 | 1.89% | 2.20% | 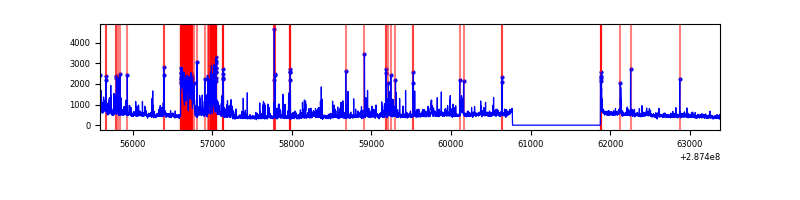 |
Top three noisy pixels from each quadrant. If the there are fewer than three noisy pixels in the level2.evt file, extra rows are filled as -1
| Pixel properties | Quadrant properties | ||||||
|---|---|---|---|---|---|---|---|
| Quadrant | DetID | PixID | Counts | Sigma | Mean | Median | Sigma |
| A | 15 | 174 | 64004 | 397.59 | 787 | 769 | 159.0 |
| A | 0 | 226 | 6936 | 38.77 | 787 | 769 | 159.0 |
| A | 3 | 137 | 5864 | 32.03 | 787 | 769 | 159.0 |
| B | 0 | 198 | 17704 | 111.97 | 793 | 773 | 151.2 |
| B | 12 | 111 | 17466 | 110.4 | 793 | 773 | 151.2 |
| B | 7 | 220 | 17247 | 108.95 | 793 | 773 | 151.2 |
| C | 14 | 238 | 118359 | 661.6 | 761 | 764 | 177.7 |
| C | 3 | 233 | 8755 | 44.96 | 761 | 764 | 177.7 |
| C | 13 | 61 | 5342 | 25.76 | 761 | 764 | 177.7 |
| D | 1 | 52 | 642843 | 3484.4 | 759 | 737 | 184.3 |
| D | 7 | 238 | 268614 | 1453.64 | 759 | 737 | 184.3 |
| D | 2 | 33 | 148066 | 799.48 | 759 | 737 | 184.3 |
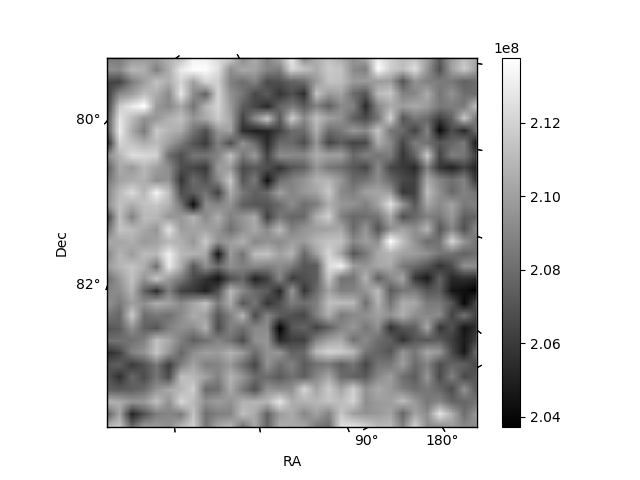
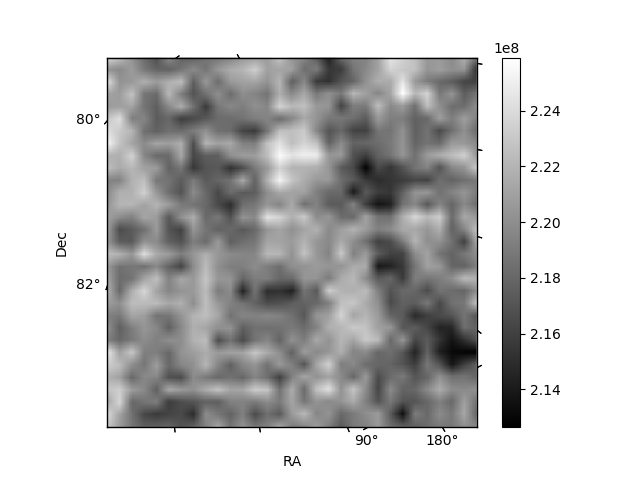
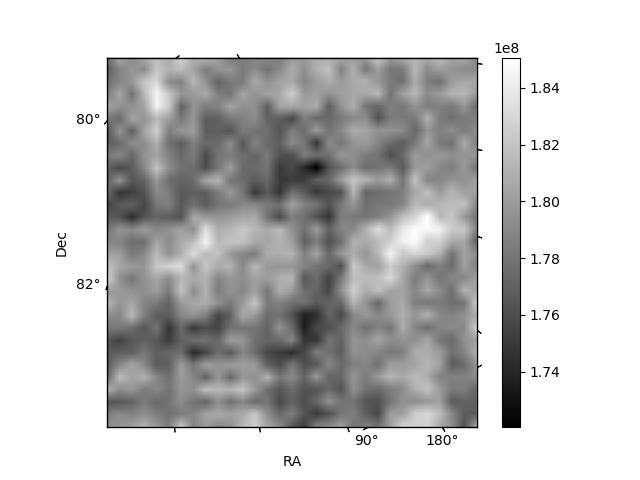
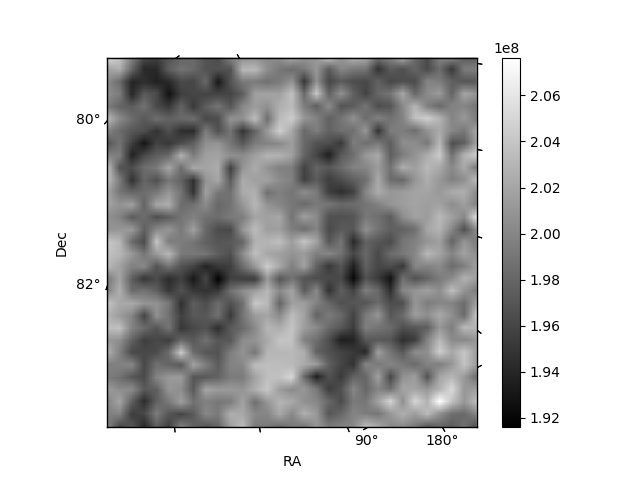
Histogram calculated using DETX and DETY for each event in the final _common_clean file
| Quadrant A | 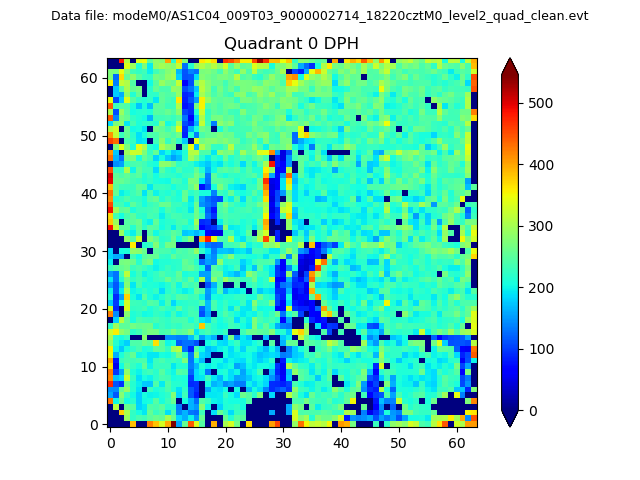 |
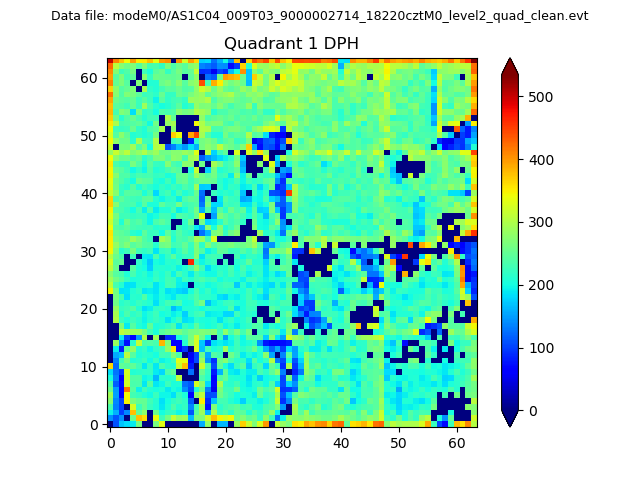 |
Quadrant B |
|---|---|---|---|
| Quadrant D | 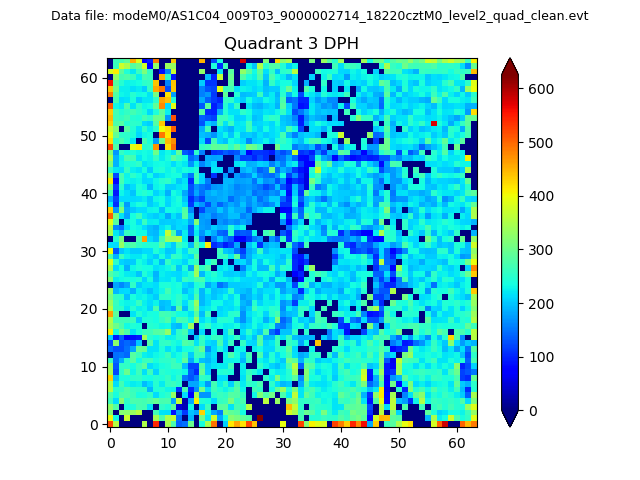 |
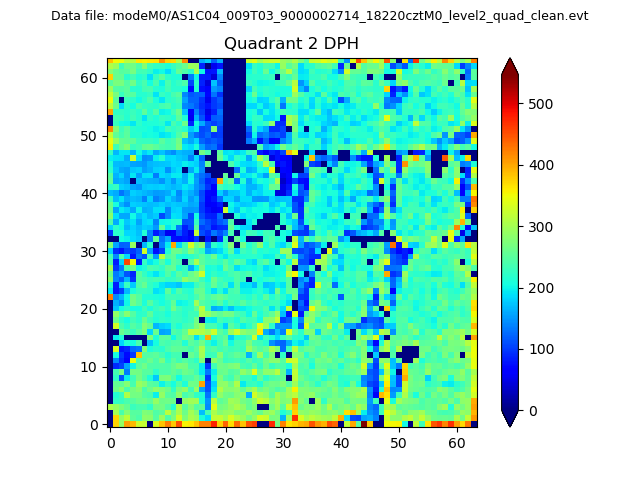 |
Quadrant C |
| Plot type | Count rate plots | Images |
|---|---|---|
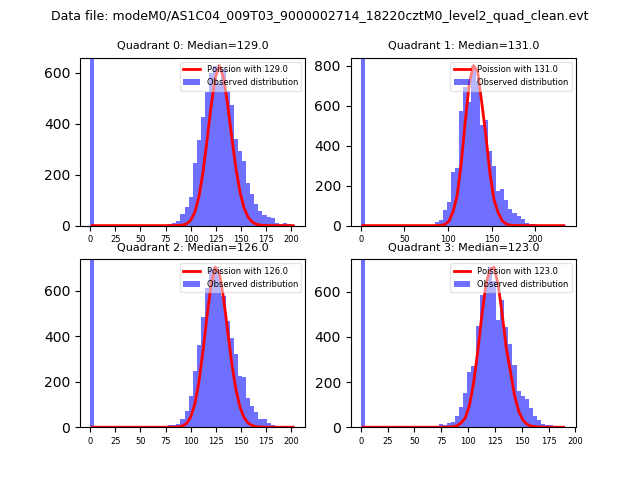
| Comparison with Poisson distribution Blue bars denote a histogram of data divided into 1 sec bins. Red curve is a Poisson curve with rate = median count rate of data. |
 |
 |
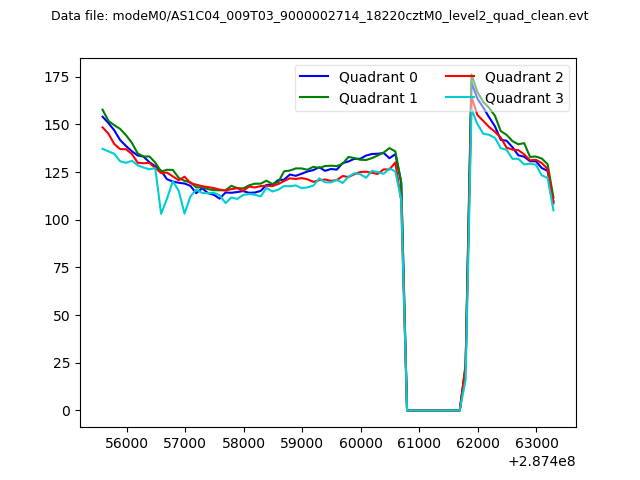
| Quadrant-wise count rates Data is divided into 100 sec bins |
 |
|
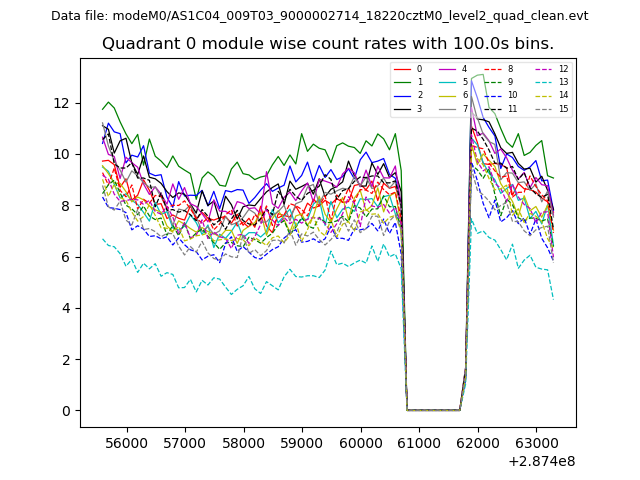
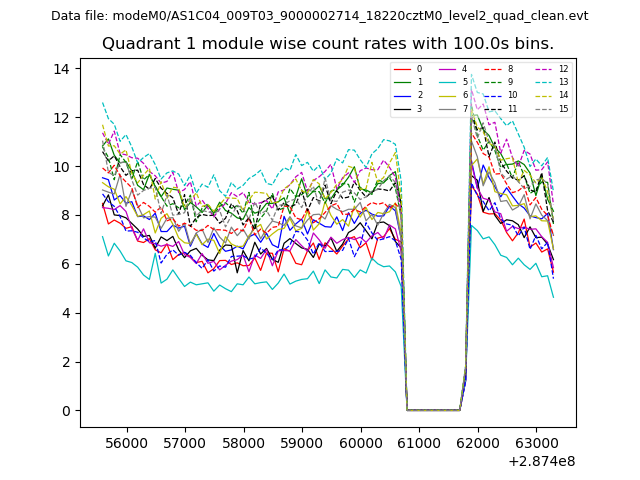
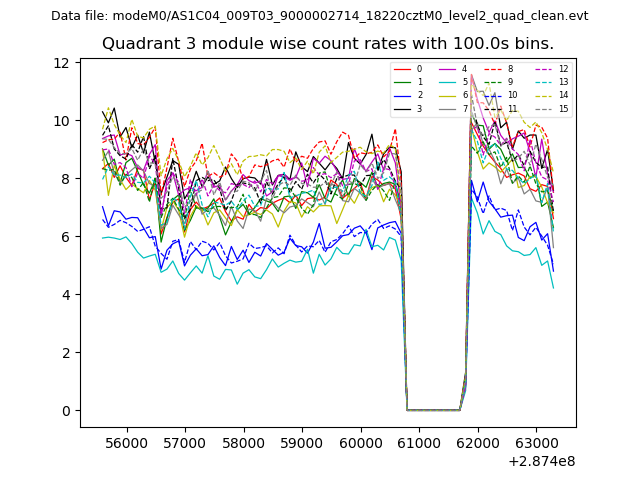
| Module-wise count rates for Quadrant A Data is divided into 100 sec bins |
 |
 |
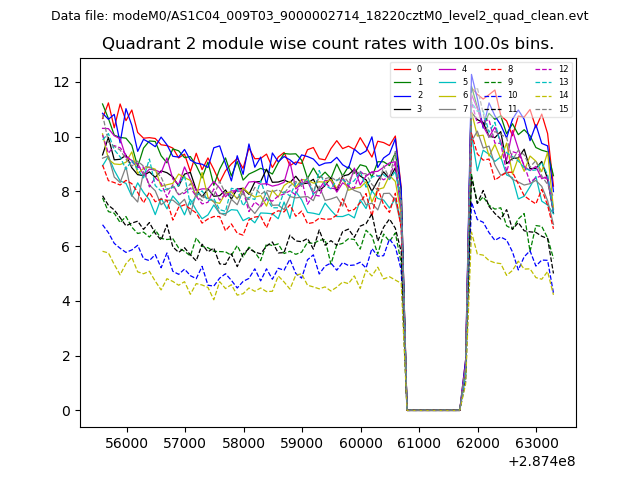
| Module-wise count rates for Quadrant B Data is divided into 100 sec bins |
 |
 |
| Module-wise count rates for Quadrant C Data is divided into 100 sec bins |
 |
 |
| Module-wise count rates for Quadrant D Data is divided into 100 sec bins |
 |
 |
| Parameter | Plot |
|---|---|
| CZT HV Monitor | 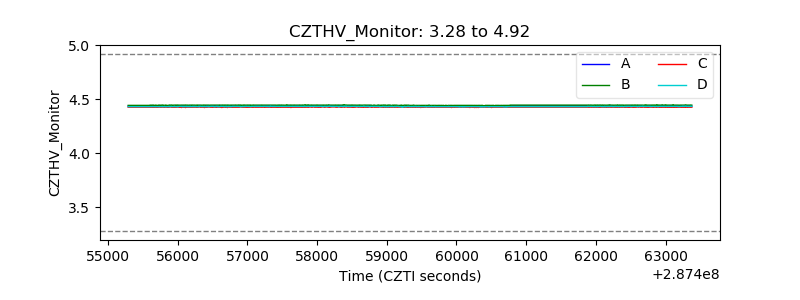 |
| D_VDD |  |
| Temperature 1 | 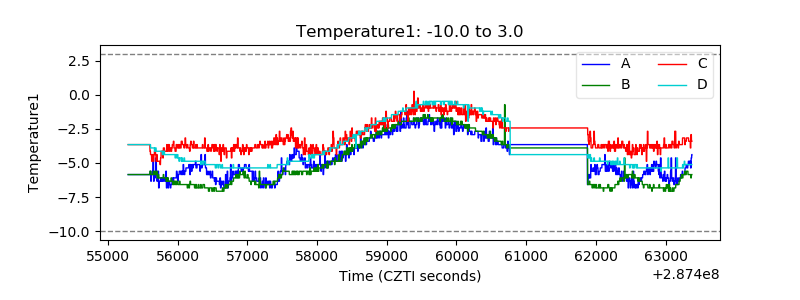 |
| Veto HV Monitor |  |
| Veto LLD | 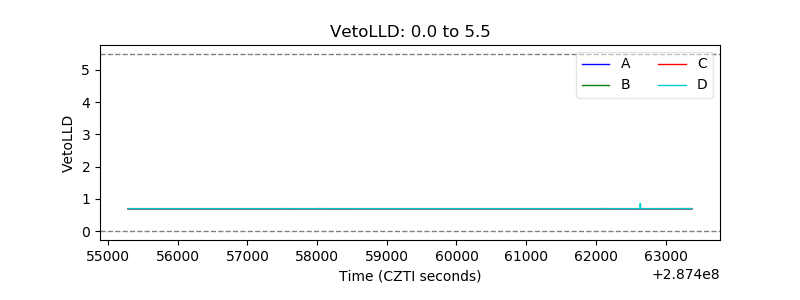 |
| Alpha Counter | 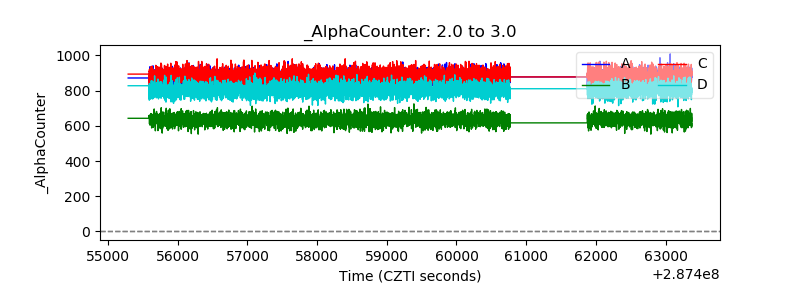 |
| _CPM_Rate | 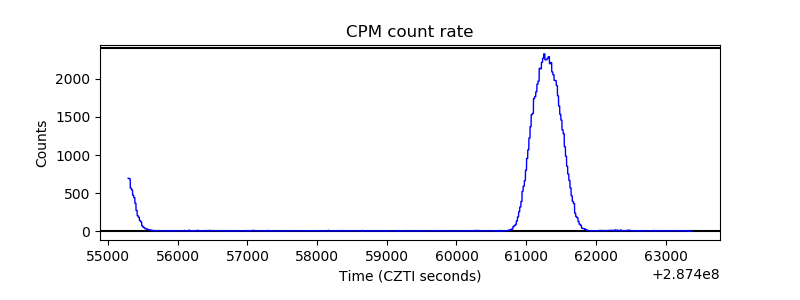 |
| CZT Counter | 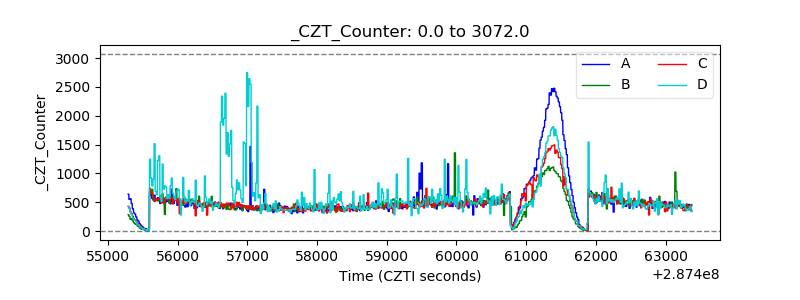 |
| +2.5 Volts monitor |  |
| +5 Volts monitor |  |
| _ROLL_ROT | 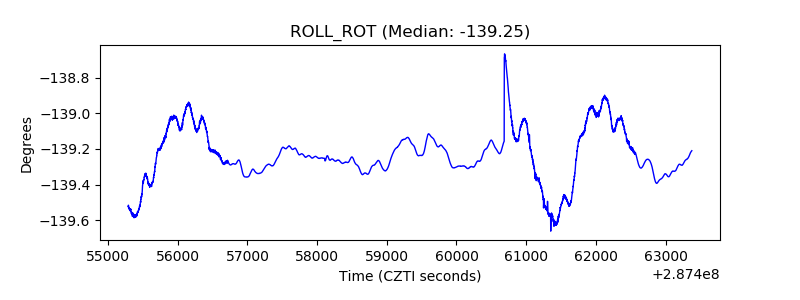 |
| _Roll_DEC | 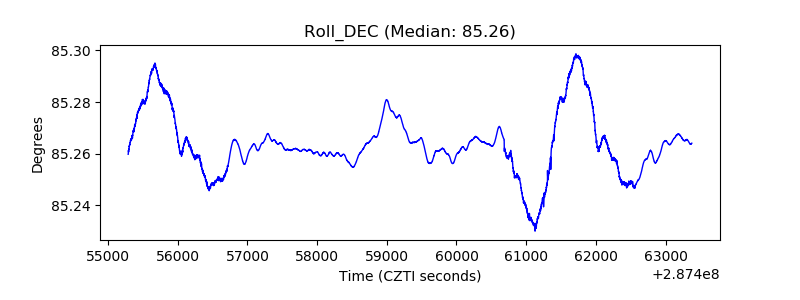 |
| _Roll_RA | 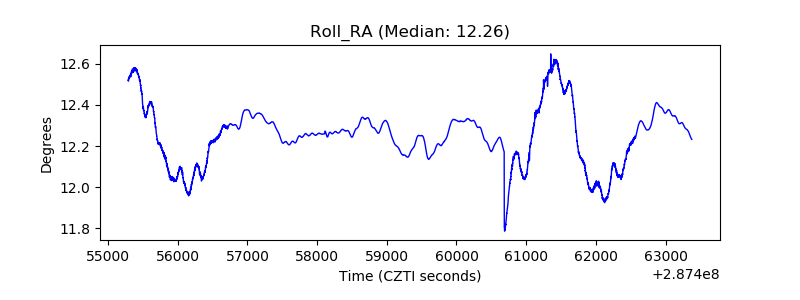 |
| Veto Counter | 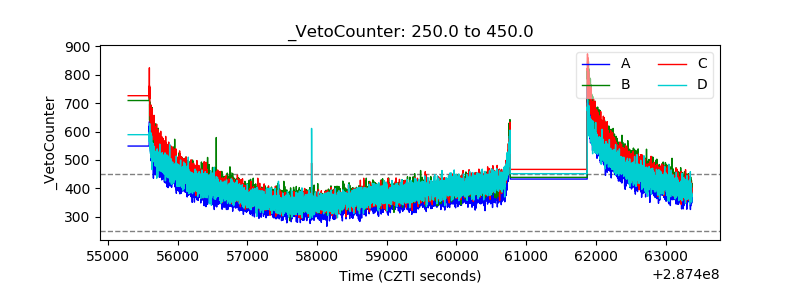 |