| Param | Original file | Final file |
|---|---|---|
| Filename | modeM0/AS1C04_009T03_9000002714_18221cztM0_level2.evt | modeM0/AS1C04_009T03_9000002714_18221cztM0_level2_quad_clean.evt |
| Size (bytes) | 422,006,400 | 129,435,840 |
| Size | 402.5 MB | 123.4 MB |
| Events in quadrant A | 3,063,229 | 883,538 |
| Events in quadrant B | 3,149,649 | 898,229 |
| Events in quadrant C | 3,033,994 | 854,387 |
| Events in quadrant D | 3,097,223 | 836,917 |
| Mode M0 | |||
|---|---|---|---|
| Quadrant | BADHDUFLAG | Total packets | Discarded packets |
| A | 0 | 13364 | 2 |
| B | 0 | 13528 | 2 |
| C | 0 | 13243 | 2 |
| D | 0 | 13659 | 2 |
| Mode SS | |||
|---|---|---|---|
| Quadrant | BADHDUFLAG | Total packets | Discarded packets |
| A | 0 | 132 | 0 |
| B | 0 | 132 | 0 |
| C | 0 | 132 | 0 |
| D | 0 | 132 | 0 |
| Mode M9 | |||
|---|---|---|---|
| Quadrant | BADHDUFLAG | Total packets | Discarded packets |
| A | 0 | 17 | 0 |
| B | 0 | 18 | 0 |
| C | 0 | 18 | 0 |
| D | 0 | 18 | 0 |
| Quadrant | Total seconds | Saturated seconds | Saturation percentage |
|---|---|---|---|
| A | 6409 | 42 | 0.655328% |
| B | 6409 | 55 | 0.858168% |
| C | 6409 | 46 | 0.717741% |
| D | 6409 | 36 | 0.561710% |
Noise dominated data is calculated using 1-second bins in cleaned event files. If a bin has >2000 counts, and if more than 50% of those come from <1% of pixels, then it is considered to be noise-dominated and hence unusable.
| Quadrant | # 1 sec bins | Bins with >0 counts | Bins with >2000 counts | High rate bins dominated by noise | Noise dominated (total time) | Noise dominated (detector-on time) | Marked lightcurve |
|---|---|---|---|---|---|---|---|
| A | 7629 | 6410 | 7 | 7 | 0.09% | 0.11% | 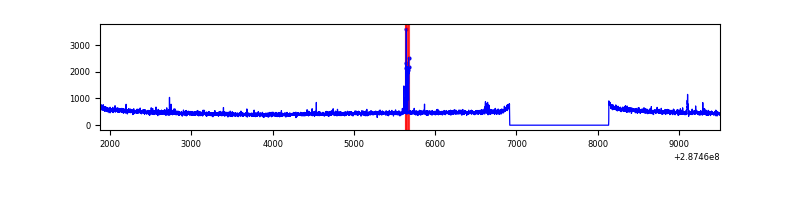 |
| B | 7629 | 6410 | 15 | 15 | 0.20% | 0.23% | 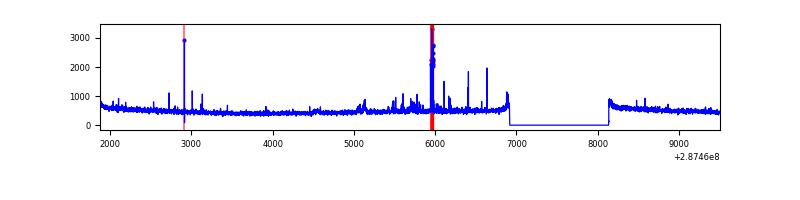 |
| C | 7629 | 6410 | 0 | 0 | 0.00% | 0.00% | 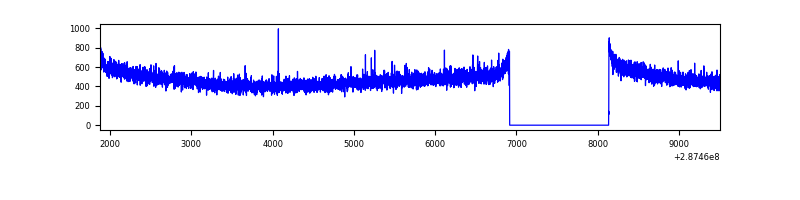 |
| D | 7629 | 6410 | 15 | 15 | 0.20% | 0.23% | 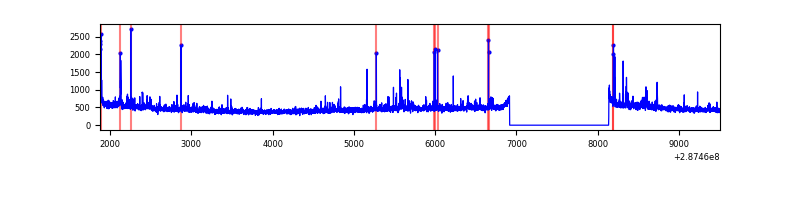 |
Top three noisy pixels from each quadrant. If the there are fewer than three noisy pixels in the level2.evt file, extra rows are filled as -1
| Pixel properties | Quadrant properties | ||||||
|---|---|---|---|---|---|---|---|
| Quadrant | DetID | PixID | Counts | Sigma | Mean | Median | Sigma |
| A | 15 | 174 | 51038 | 323.5 | 780 | 762 | 155.4 |
| A | 8 | 34 | 7977 | 46.43 | 780 | 762 | 155.4 |
| A | 0 | 226 | 6808 | 38.9 | 780 | 762 | 155.4 |
| B | 7 | 220 | 54162 | 366.28 | 781 | 763 | 145.8 |
| B | 12 | 111 | 16684 | 109.21 | 781 | 763 | 145.8 |
| B | 11 | 111 | 14637 | 95.17 | 781 | 763 | 145.8 |
| C | 14 | 238 | 117384 | 680.45 | 745 | 751 | 171.4 |
| C | 0 | 207 | 9739 | 52.44 | 745 | 751 | 171.4 |
| C | 13 | 61 | 5170 | 25.78 | 745 | 751 | 171.4 |
| D | 7 | 238 | 131111 | 722.47 | 751 | 729 | 180.5 |
| D | 1 | 52 | 47341 | 258.28 | 751 | 729 | 180.5 |
| D | 2 | 234 | 26043 | 140.27 | 751 | 729 | 180.5 |
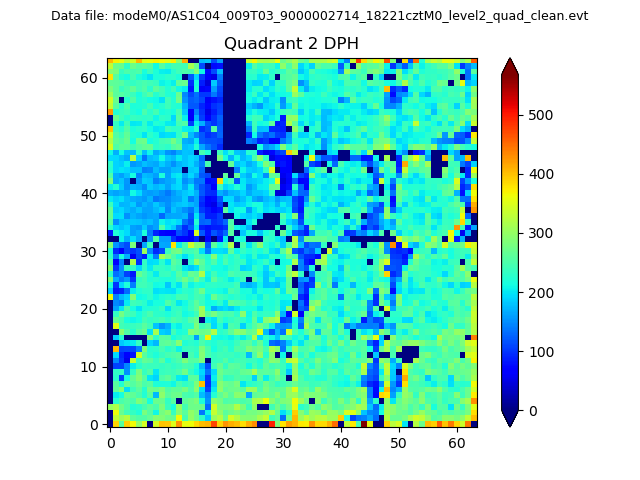
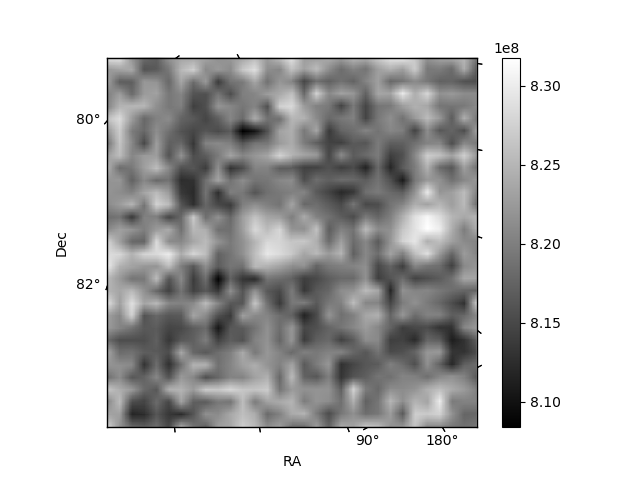
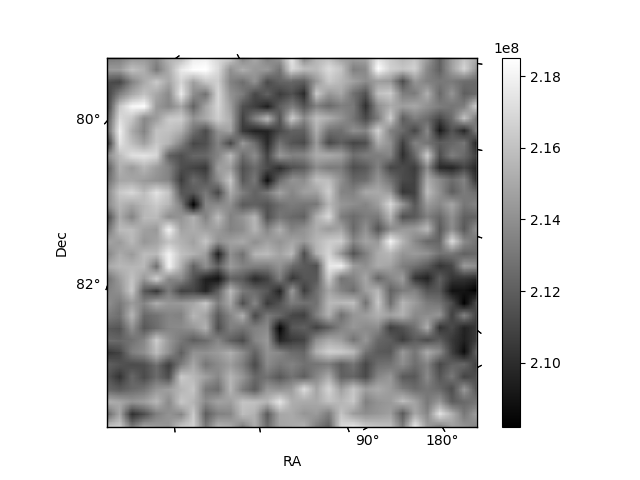
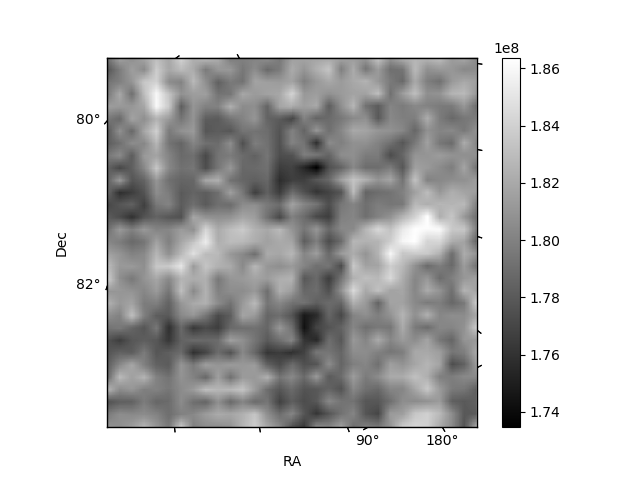
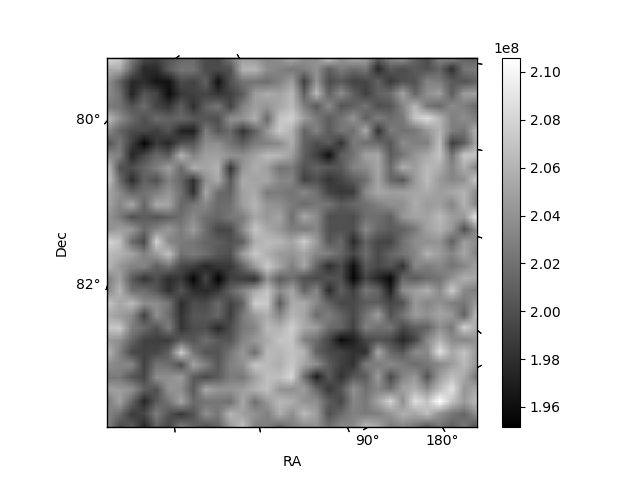
Histogram calculated using DETX and DETY for each event in the final _common_clean file
| Quadrant A | 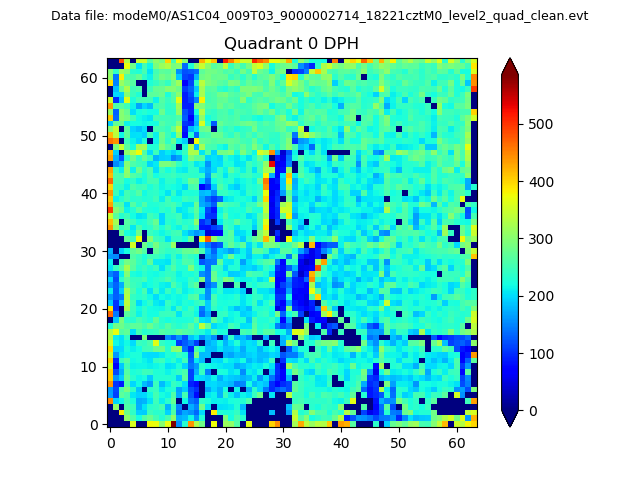 |
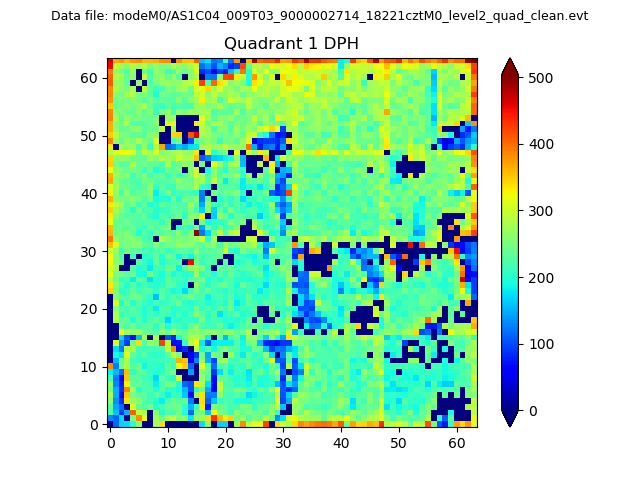 |
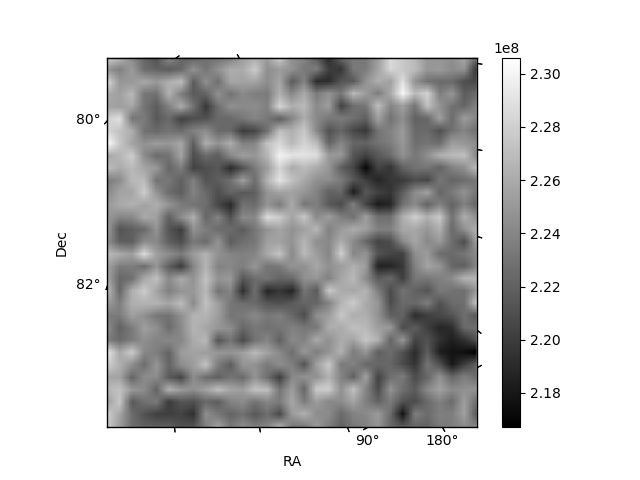
Quadrant B |
|---|---|---|---|
| Quadrant D | 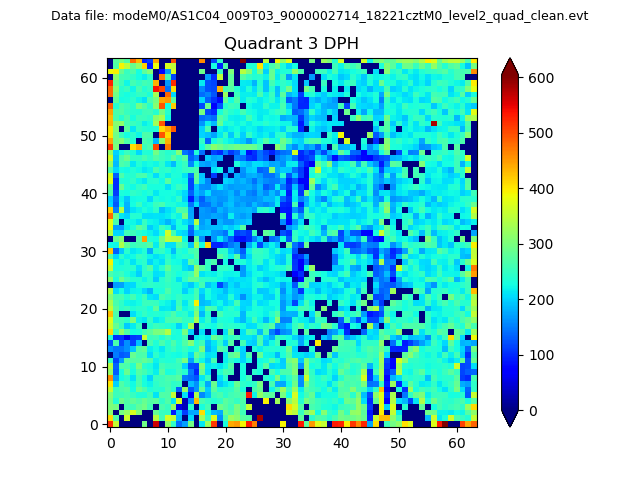 |
 |
Quadrant C |
| Plot type | Count rate plots | Images |
|---|---|---|
| Comparison with Poisson distribution Blue bars denote a histogram of data divided into 1 sec bins. Red curve is a Poisson curve with rate = median count rate of data. |
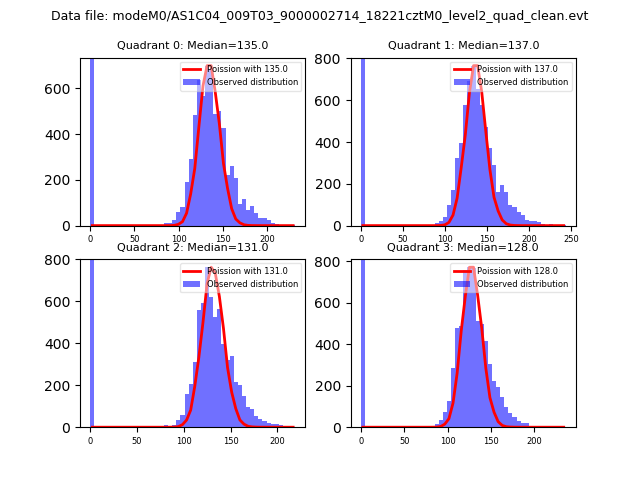 |
 |
| Quadrant-wise count rates Data is divided into 100 sec bins |
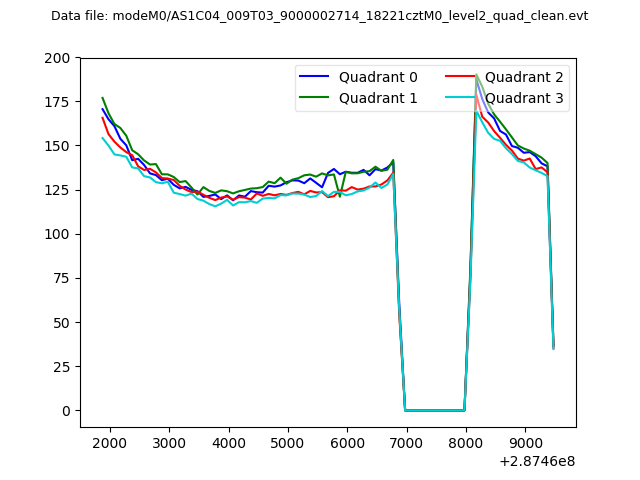 |
|
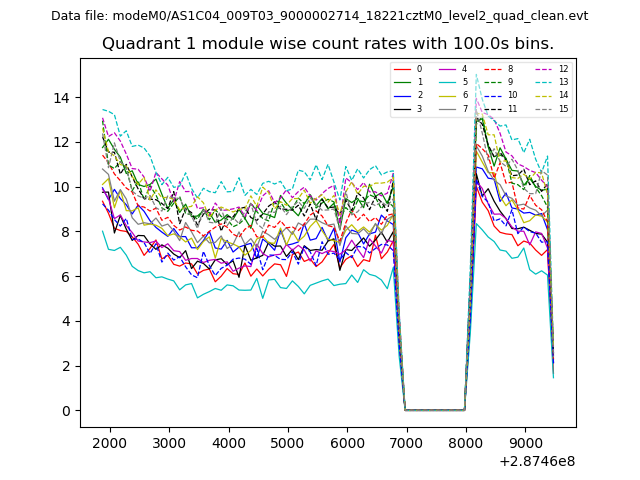
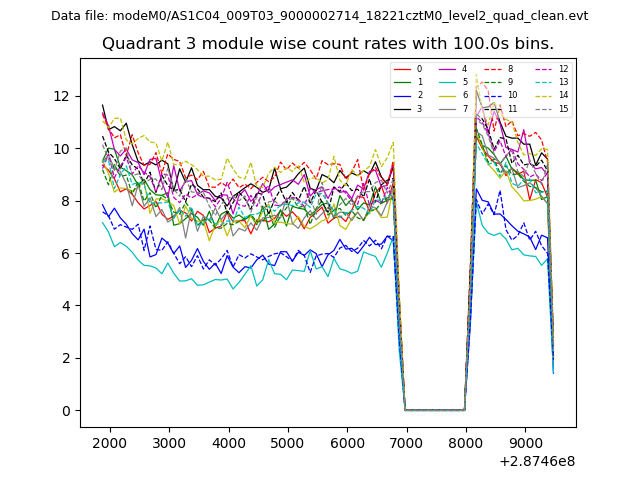
| Module-wise count rates for Quadrant A Data is divided into 100 sec bins |
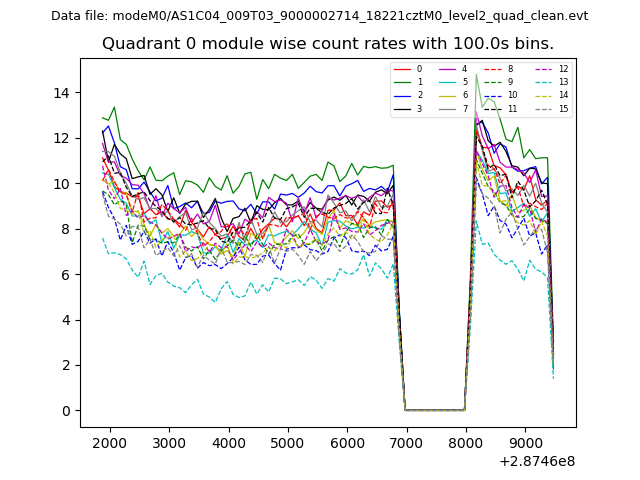 |
 |
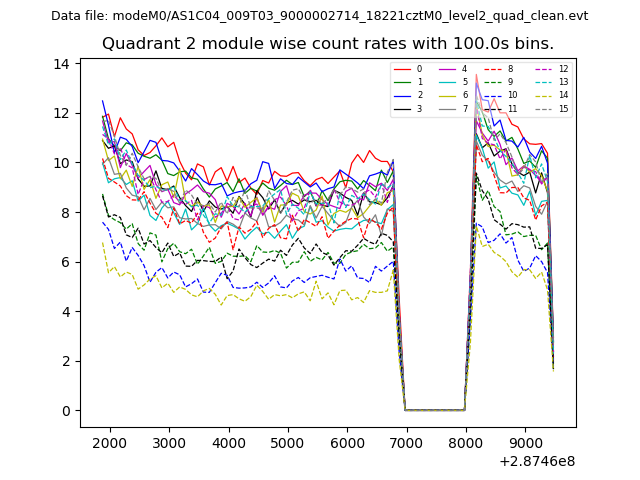
| Module-wise count rates for Quadrant B Data is divided into 100 sec bins |
 |
 |
| Module-wise count rates for Quadrant C Data is divided into 100 sec bins |
 |
 |
| Module-wise count rates for Quadrant D Data is divided into 100 sec bins |
 |
 |
| Parameter | Plot |
|---|---|
| CZT HV Monitor | 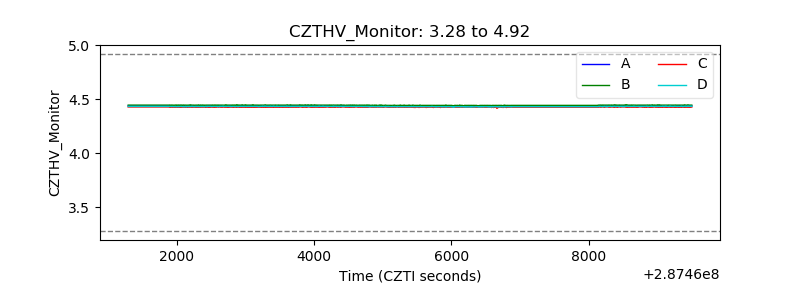 |
| D_VDD | 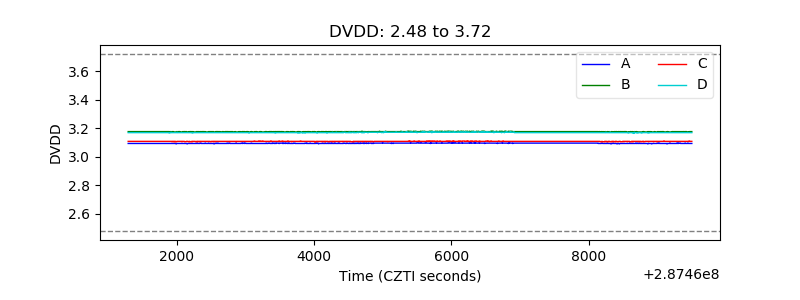 |
| Temperature 1 | 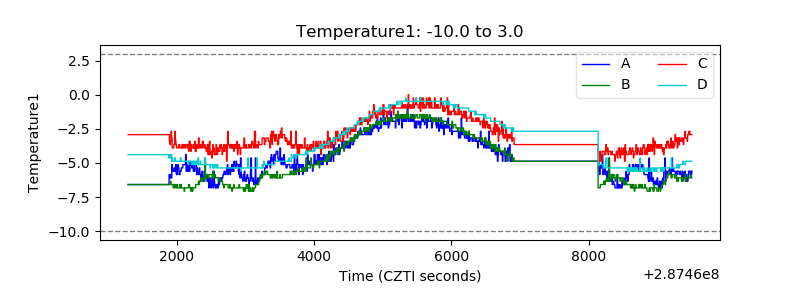 |
| Veto HV Monitor | 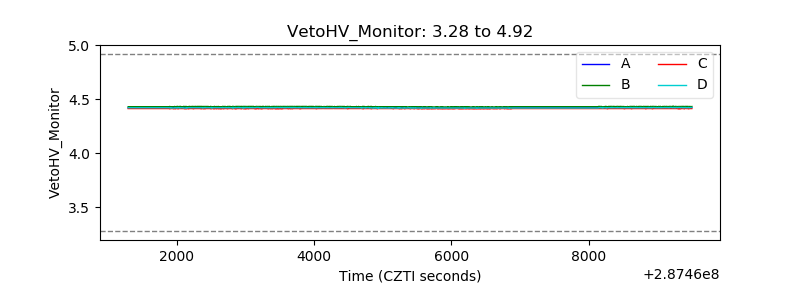 |
| Veto LLD | 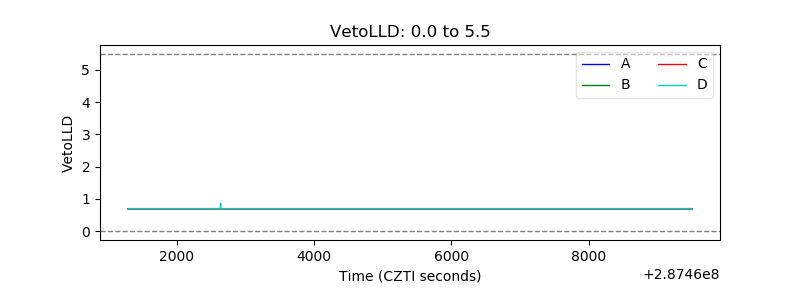 |
| Alpha Counter | 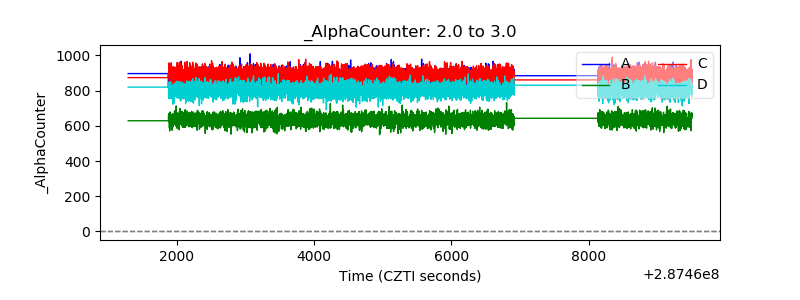 |
| _CPM_Rate | 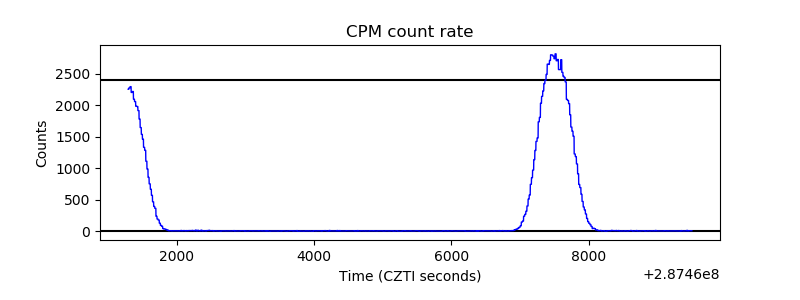 |
| CZT Counter | 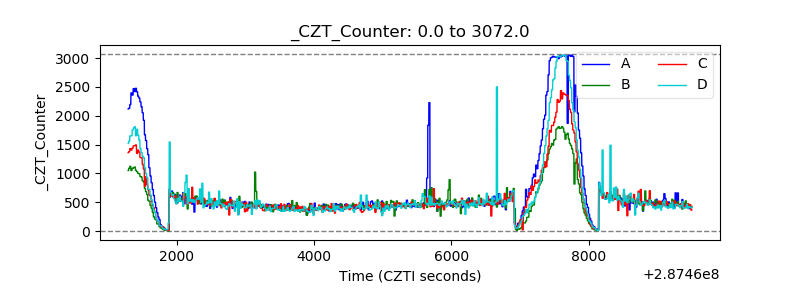 |
| +2.5 Volts monitor | 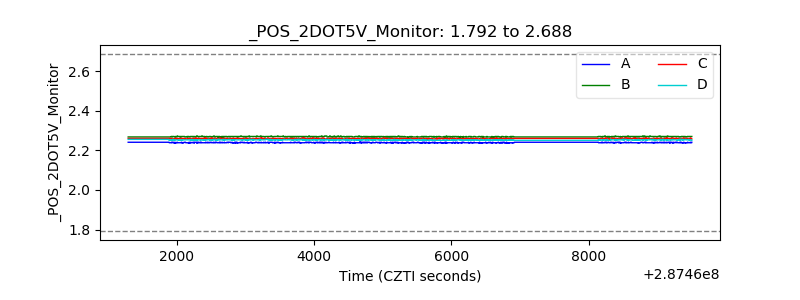 |
| +5 Volts monitor | 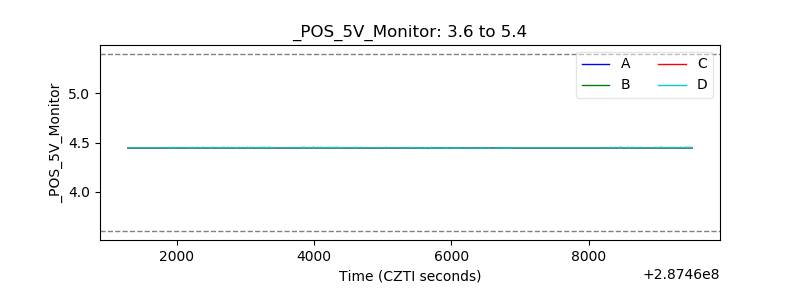 |
| _ROLL_ROT | 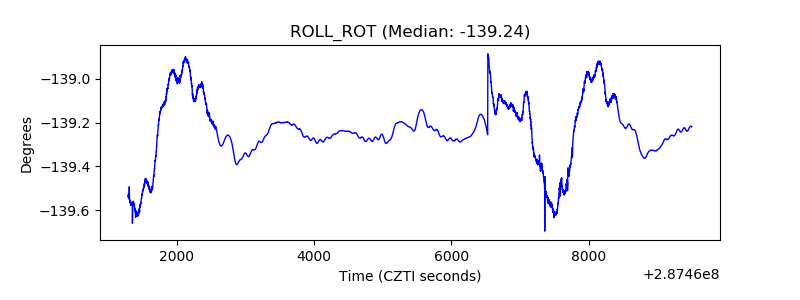 |
| _Roll_DEC | 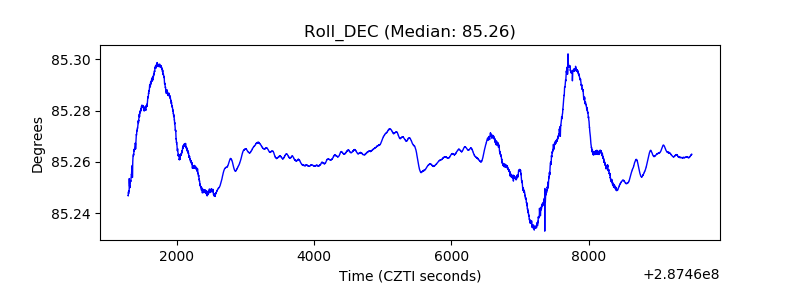 |
| _Roll_RA | 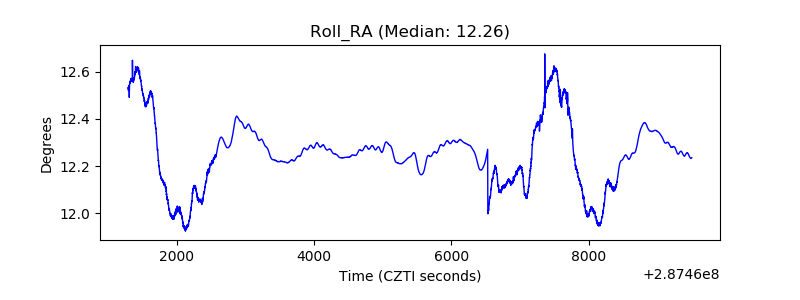 |
| Veto Counter | 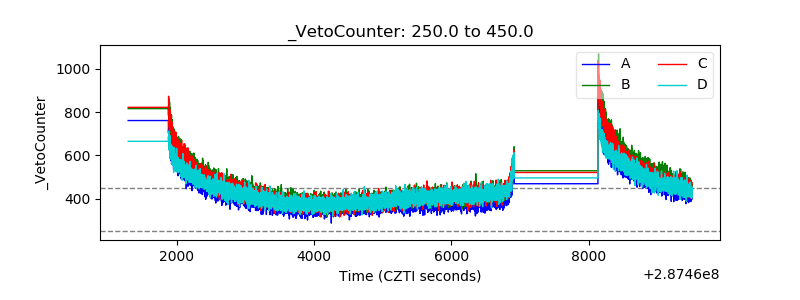 |