| Param | Original file | Final file |
|---|---|---|
| Filename | modeM0/AS1C04_009T03_9000002714_18223cztM0_level2.evt | modeM0/AS1C04_009T03_9000002714_18223cztM0_level2_quad_clean.evt |
| Size (bytes) | 586,699,200 | 172,215,360 |
| Size | 559.5 MB | 164.2 MB |
| Events in quadrant A | 4,517,897 | 1,169,099 |
| Events in quadrant B | 4,285,510 | 1,193,070 |
| Events in quadrant C | 3,998,369 | 1,133,398 |
| Events in quadrant D | 4,372,788 | 1,113,650 |
| Mode M0 | |||
|---|---|---|---|
| Quadrant | BADHDUFLAG | Total packets | Discarded packets |
| A | 0 | 19295 | 1 |
| B | 0 | 18503 | 1 |
| C | 0 | 17794 | 1 |
| D | 0 | 19164 | 1 |
| Mode SS | |||
|---|---|---|---|
| Quadrant | BADHDUFLAG | Total packets | Discarded packets |
| A | 0 | 178 | 0 |
| B | 0 | 178 | 0 |
| C | 0 | 178 | 0 |
| D | 0 | 178 | 0 |
| Mode M9 | |||
|---|---|---|---|
| Quadrant | BADHDUFLAG | Total packets | Discarded packets |
| A | 0 | 12 | 0 |
| B | 0 | 12 | 0 |
| C | 0 | 12 | 0 |
| D | 0 | 12 | 0 |
| Quadrant | Total seconds | Saturated seconds | Saturation percentage |
|---|---|---|---|
| A | 8743 | 153 | 1.749971% |
| B | 8743 | 101 | 1.155210% |
| C | 8744 | 47 | 0.537511% |
| D | 8744 | 92 | 1.052150% |
Noise dominated data is calculated using 1-second bins in cleaned event files. If a bin has >2000 counts, and if more than 50% of those come from <1% of pixels, then it is considered to be noise-dominated and hence unusable.
| Quadrant | # 1 sec bins | Bins with >0 counts | Bins with >2000 counts | High rate bins dominated by noise | Noise dominated (total time) | Noise dominated (detector-on time) | Marked lightcurve |
|---|---|---|---|---|---|---|---|
| A | 9963 | 8744 | 90 | 90 | 0.90% | 1.03% | 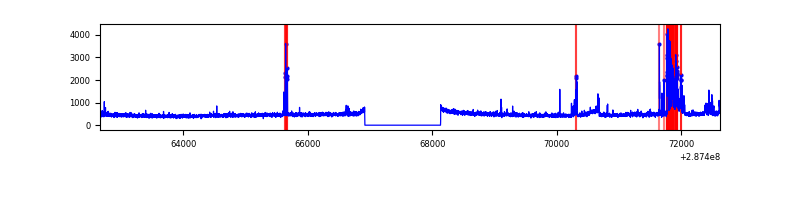 |
| B | 9963 | 8744 | 45 | 45 | 0.45% | 0.51% | 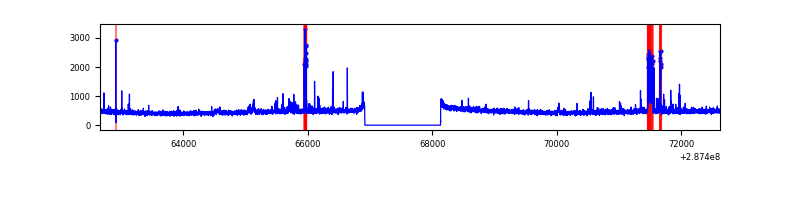 |
| C | 9964 | 8745 | 0 | 0 | 0.00% | 0.00% | 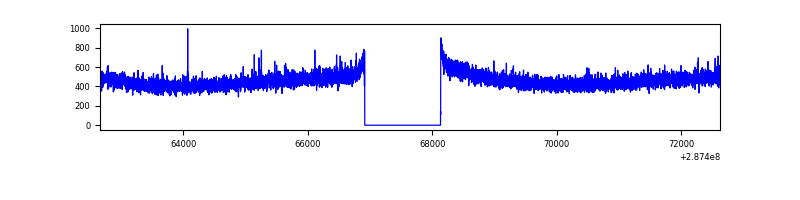 |
| D | 9964 | 8745 | 67 | 67 | 0.67% | 0.77% | 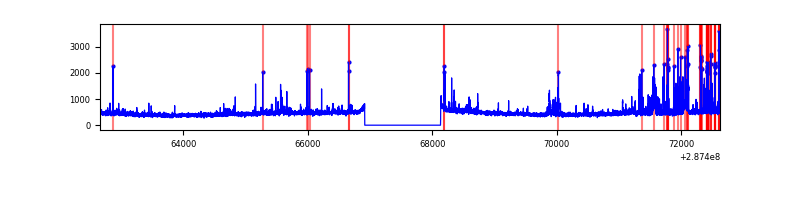 |
Top three noisy pixels from each quadrant. If the there are fewer than three noisy pixels in the level2.evt file, extra rows are filled as -1
| Pixel properties | Quadrant properties | ||||||
|---|---|---|---|---|---|---|---|
| Quadrant | DetID | PixID | Counts | Sigma | Mean | Median | Sigma |
| A | 15 | 174 | 543835 | 2659.94 | 1029 | 1006 | 204.1 |
| A | 8 | 34 | 11772 | 52.76 | 1029 | 1006 | 204.1 |
| A | 0 | 226 | 9010 | 39.22 | 1029 | 1006 | 204.1 |
| B | 7 | 220 | 203905 | 1071.19 | 1029 | 1004 | 189.4 |
| B | 0 | 189 | 23067 | 116.48 | 1029 | 1004 | 189.4 |
| B | 12 | 111 | 21461 | 108.0 | 1029 | 1004 | 189.4 |
| C | 14 | 238 | 156226 | 691.2 | 982 | 987 | 224.6 |
| C | 0 | 207 | 10090 | 40.53 | 982 | 987 | 224.6 |
| C | 13 | 61 | 6965 | 26.62 | 982 | 987 | 224.6 |
| D | 1 | 52 | 346450 | 1454.65 | 997 | 969 | 237.5 |
| D | 7 | 238 | 133426 | 557.71 | 997 | 969 | 237.5 |
| D | 2 | 234 | 37012 | 151.76 | 997 | 969 | 237.5 |
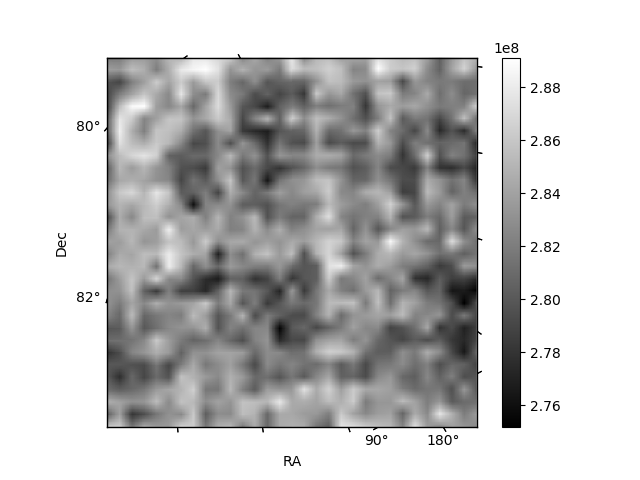
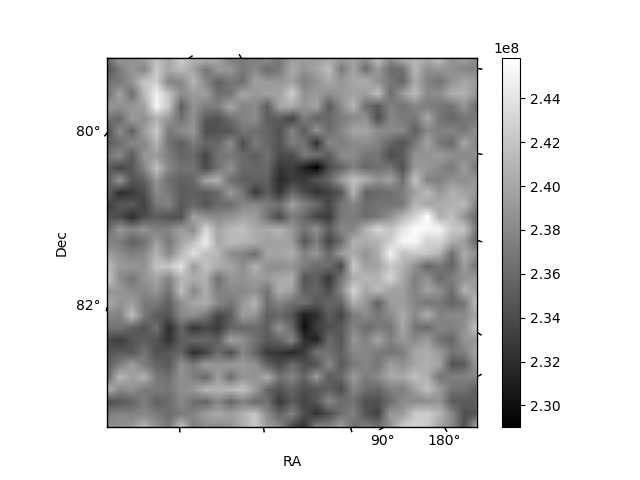
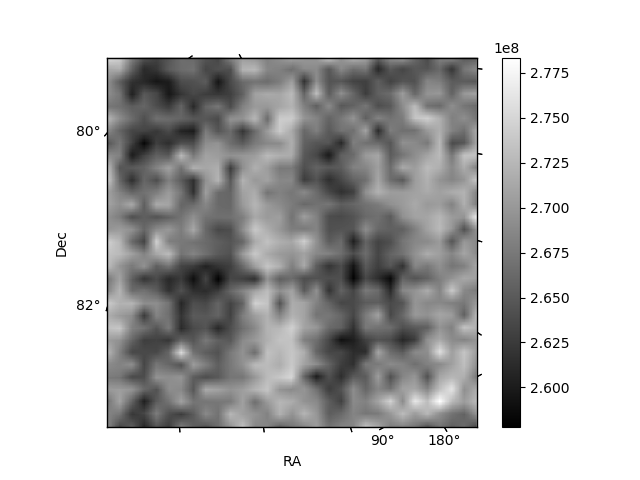
Histogram calculated using DETX and DETY for each event in the final _common_clean file
| Quadrant A |  |
 |
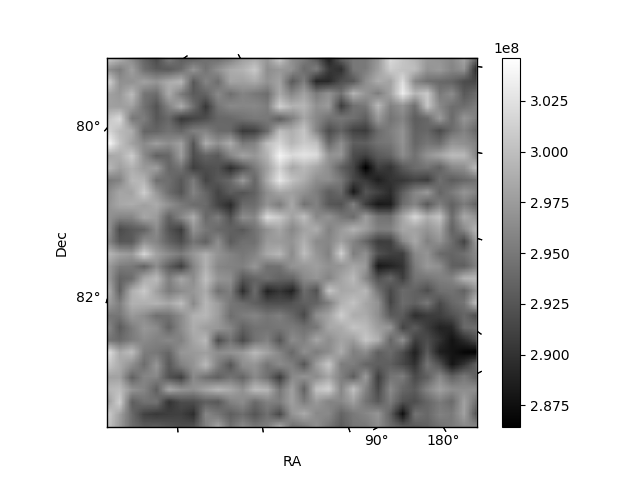
Quadrant B |
|---|---|---|---|
| Quadrant D |  |
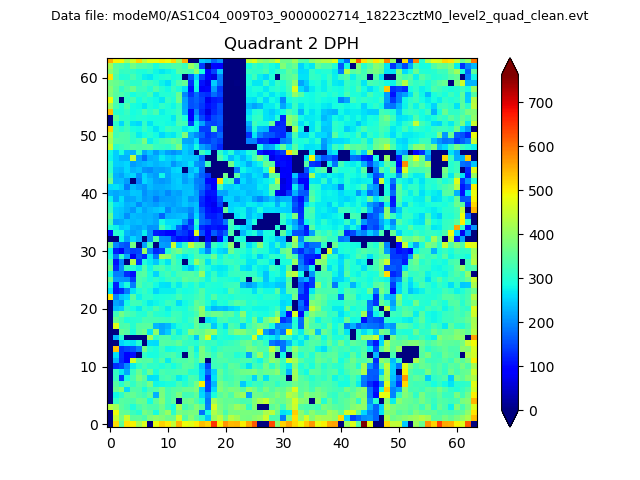 |
Quadrant C |
| Plot type | Count rate plots | Images |
|---|---|---|
| Comparison with Poisson distribution Blue bars denote a histogram of data divided into 1 sec bins. Red curve is a Poisson curve with rate = median count rate of data. |
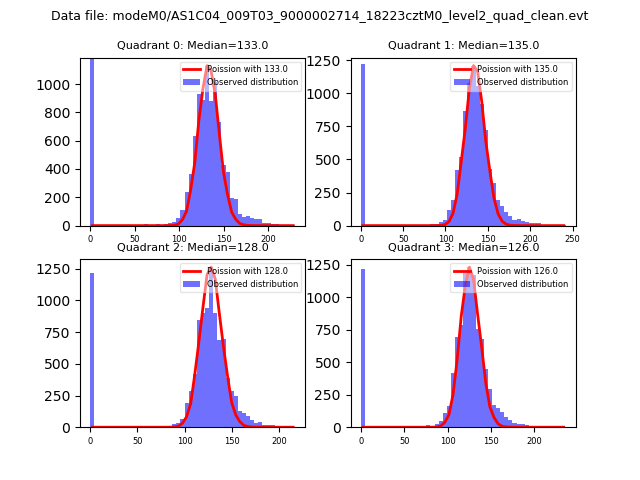 |
 |
| Quadrant-wise count rates Data is divided into 100 sec bins |
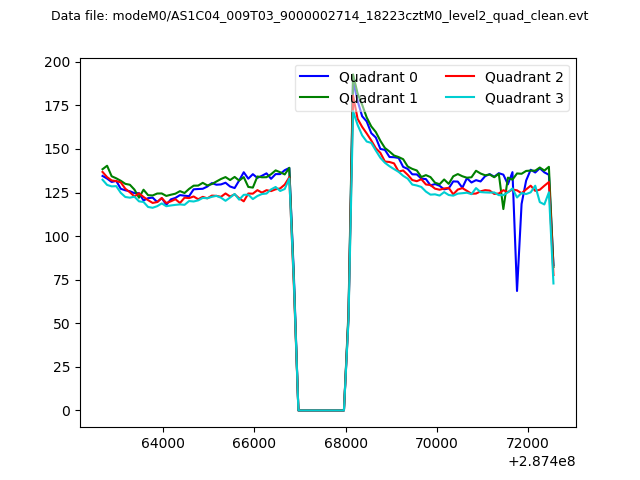 |
|
| Module-wise count rates for Quadrant A Data is divided into 100 sec bins |
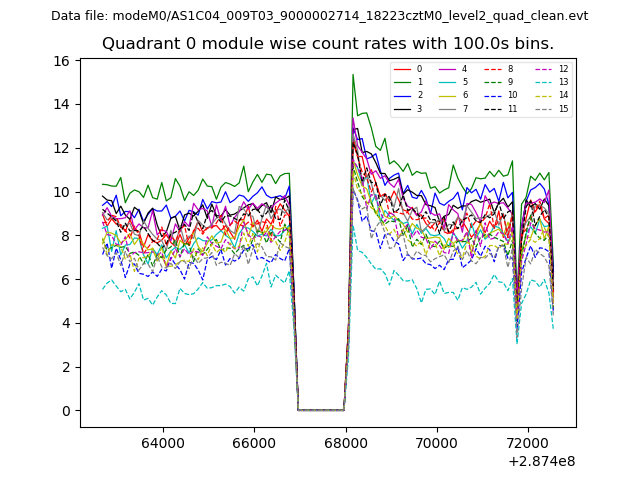 |
 |
| Module-wise count rates for Quadrant B Data is divided into 100 sec bins |
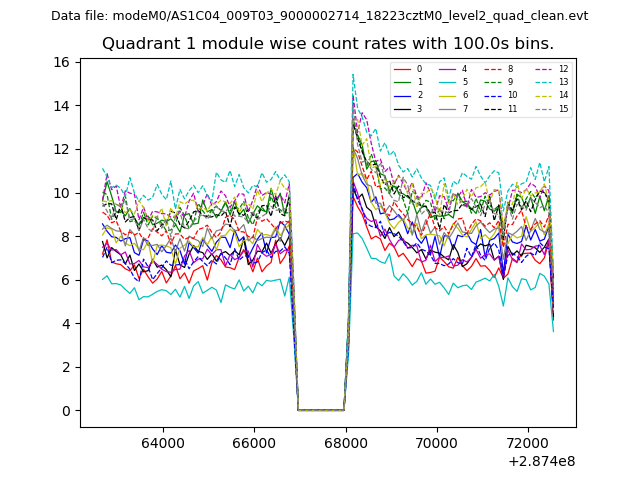 |
 |
| Module-wise count rates for Quadrant C Data is divided into 100 sec bins |
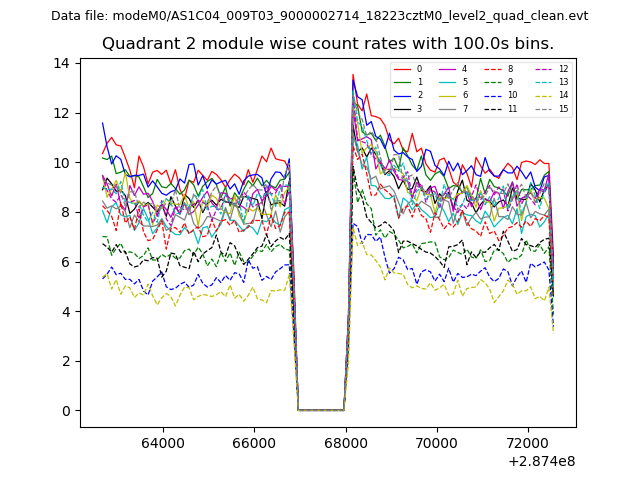 |
 |
| Module-wise count rates for Quadrant D Data is divided into 100 sec bins |
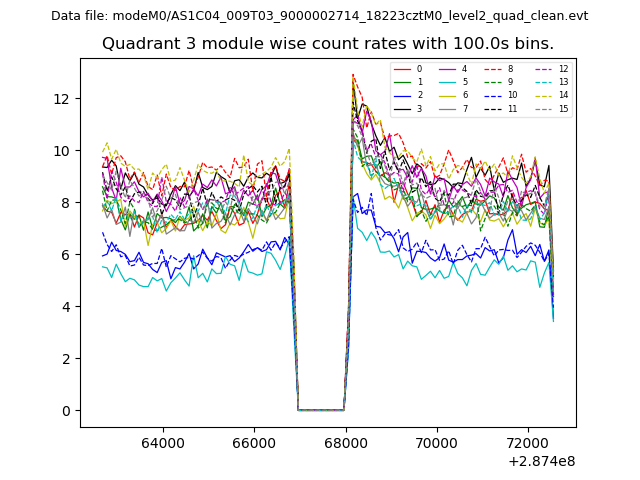 |
 |
| Parameter | Plot |
|---|---|
| CZT HV Monitor | 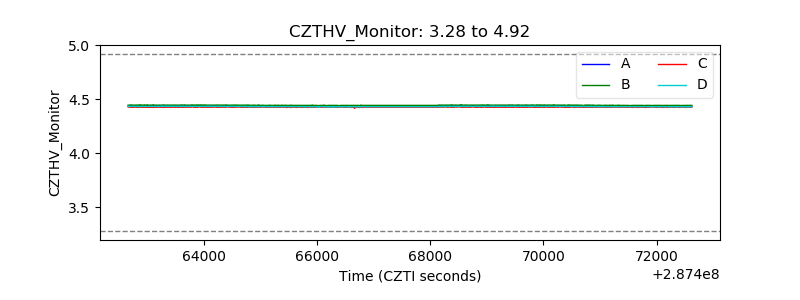 |
| D_VDD | 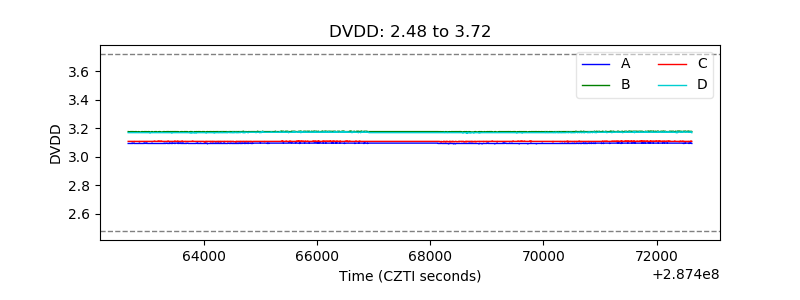 |
| Temperature 1 | 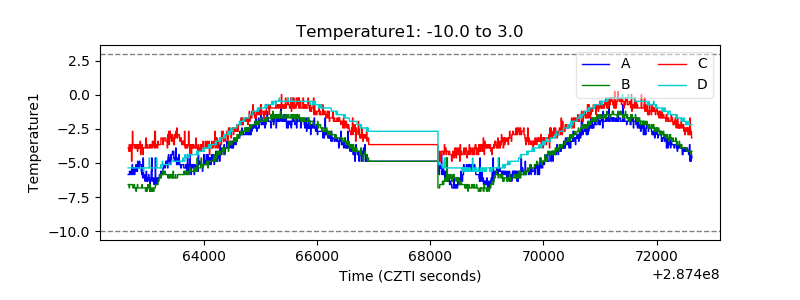 |
| Veto HV Monitor | 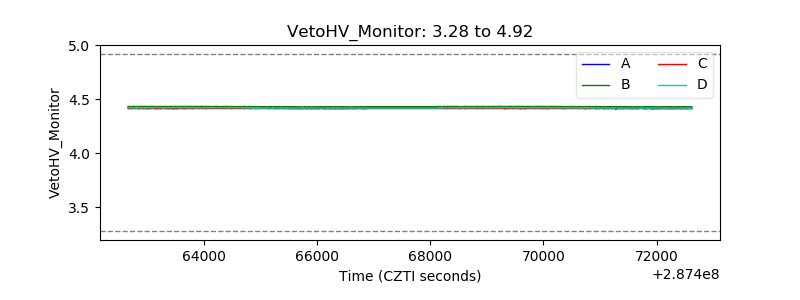 |
| Veto LLD | 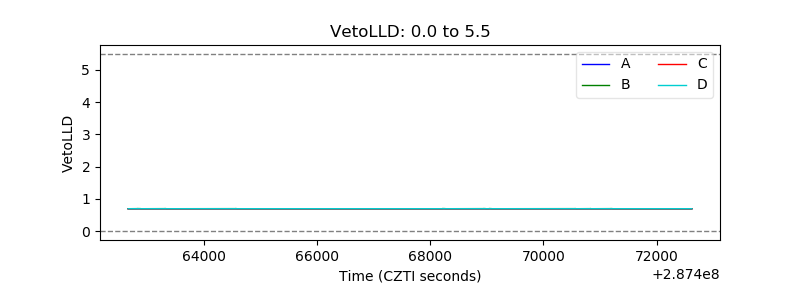 |
| Alpha Counter | 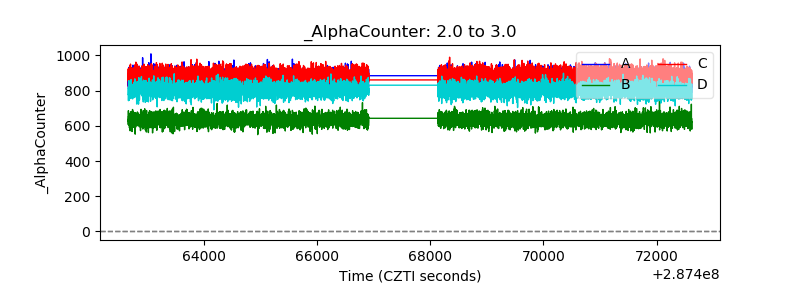 |
| _CPM_Rate | 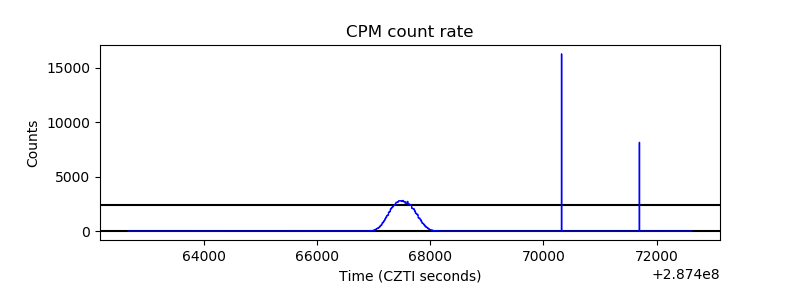 |
| CZT Counter | 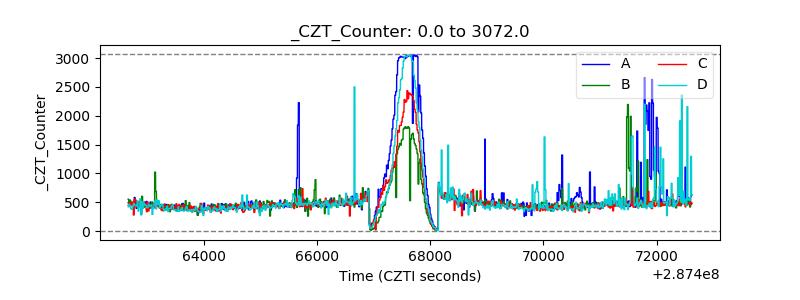 |
| +2.5 Volts monitor |  |
| +5 Volts monitor | 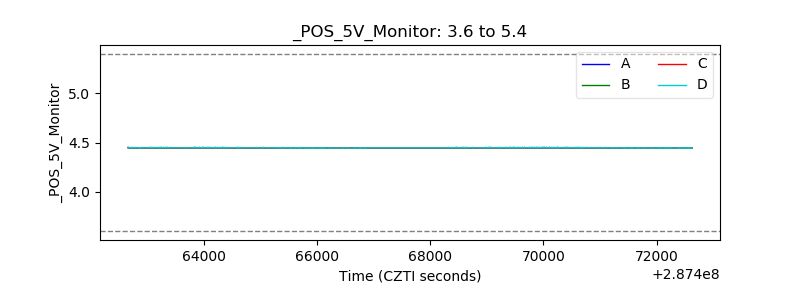 |
| _ROLL_ROT | 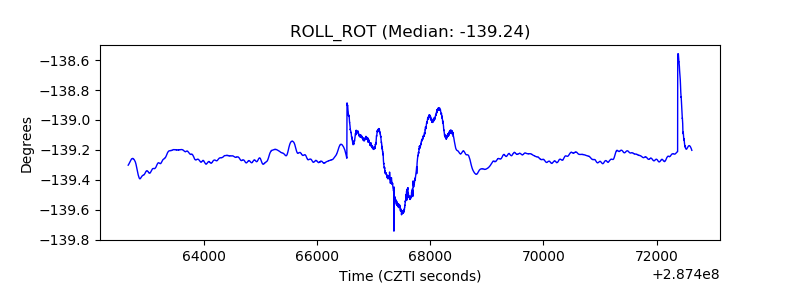 |
| _Roll_DEC | 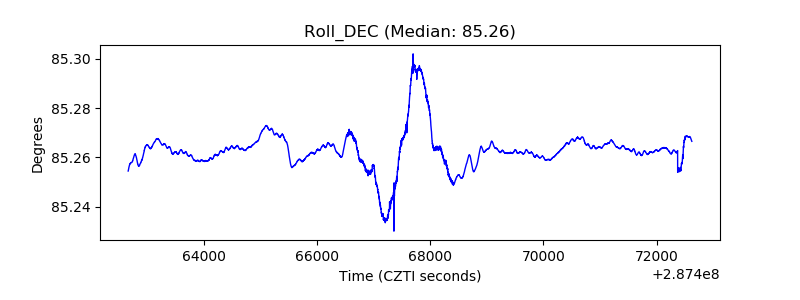 |
| _Roll_RA | 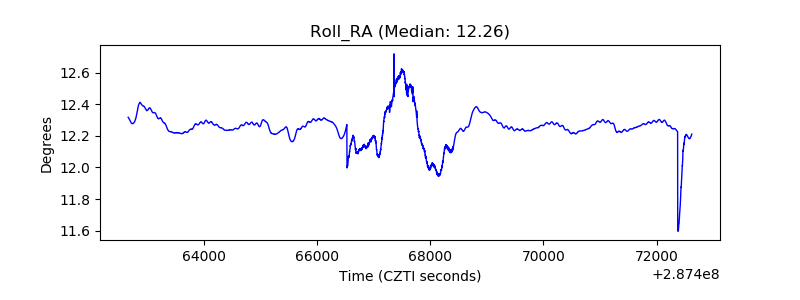 |
| Veto Counter | 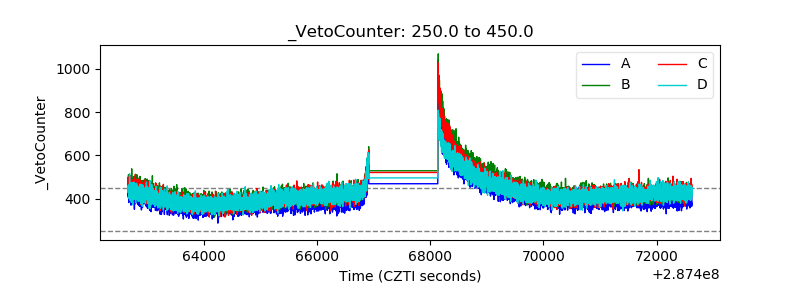 |