| Param | Original file | Final file |
|---|---|---|
| Filename | modeM0/AS1C04_001T01_9000002716cztM0_level2.fits | modeM0/AS1C04_001T01_9000002716cztM0_level2_quad_clean.evt |
| Size (bytes) | 710,231,040 | 956,321,280 |
| Size | 677.3 MB | 912.0 MB |
| Events in quadrant A | 4,365,810 | 6,261,652 |
| Events in quadrant B | 4,245,868 | 6,469,329 |
| Events in quadrant C | 4,283,874 | 6,104,605 |
| Events in quadrant D | 3,432,016 | 4,952,737 |
| Mode SS | |||
|---|---|---|---|
| Quadrant | BADHDUFLAG | Total packets | Discarded packets |
| A | 0 | 1544 | 0 |
| B | 0 | 1544 | 0 |
| C | 0 | 1544 | 0 |
| D | 0 | 1544 | 0 |
| Mode M9 | |||
|---|---|---|---|
| Quadrant | BADHDUFLAG | Total packets | Discarded packets |
| A | 0 | 135 | 0 |
| B | 0 | 135 | 0 |
| C | 0 | 135 | 0 |
| D | 0 | 135 | 0 |
| Mode M0 | |||
|---|---|---|---|
| Quadrant | BADHDUFLAG | Total packets | Discarded packets |
| A | 0 | 175551 | 0 |
| B | 0 | 157813 | 0 |
| C | 0 | 154208 | 0 |
| D | 0 | 244152 | 0 |
| Quadrant | Total seconds | Saturated seconds | Saturation percentage |
|---|---|---|---|
| A | 75487 | 3041 | 4.028508% |
| B | 75487 | 779 | 1.031966% |
| C | 75487 | 830 | 1.099527% |
| D | 75487 | 9533 | 12.628665% |
Noise dominated data is calculated using 1-second bins in cleaned event files. If a bin has >2000 counts, and if more than 50% of those come from <1% of pixels, then it is considered to be noise-dominated and hence unusable.
| Quadrant | # 1 sec bins | Bins with >0 counts | Bins with >2000 counts | High rate bins dominated by noise | Noise dominated (total time) | Noise dominated (detector-on time) | Marked lightcurve |
|---|---|---|---|---|---|---|---|
| A | 87912 | 75286 | 0 | 0 | 0.00% | 0.00% |  |
| B | 87910 | 75483 | 0 | 0 | 0.00% | 0.00% |  |
| C | 87910 | 75483 | 0 | 0 | 0.00% | 0.00% |  |
| D | 87910 | 74286 | 0 | 0 | 0.00% | 0.00% |  |
Top three noisy pixels from each quadrant. If the there are fewer than three noisy pixels in the level2.evt file, extra rows are filled as -1
| Pixel properties | Quadrant properties | ||||||
|---|---|---|---|---|---|---|---|
| Quadrant | DetID | PixID | Counts | Sigma | Mean | Median | Sigma |
| A | 0 | 29 | 4156 | 10.86 | 1137 | 1070 | 284.2 |
| A | 7 | 110 | 3465 | 8.43 | 1137 | 1070 | 284.2 |
| A | 0 | 30 | 3331 | 7.96 | 1137 | 1070 | 284.2 |
| B | 2 | 9 | 3396 | 10.57 | 1123 | 1078 | 219.3 |
| B | 2 | 8 | 2825 | 7.96 | 1123 | 1078 | 219.3 |
| B | 5 | 128 | 2746 | 7.6 | 1123 | 1078 | 219.3 |
| C | 1 | 81 | 3403 | 8.15 | 1130 | 1057 | 288.0 |
| C | 1 | 80 | 3369 | 8.03 | 1130 | 1057 | 288.0 |
| C | 12 | 241 | 3040 | 6.89 | 1130 | 1057 | 288.0 |
| D | 10 | 190 | 2616 | 6.64 | 980 | 896 | 258.9 |
| D | 3 | 14 | 2471 | 6.08 | 980 | 896 | 258.9 |
| D | 10 | 189 | 2459 | 6.04 | 980 | 896 | 258.9 |
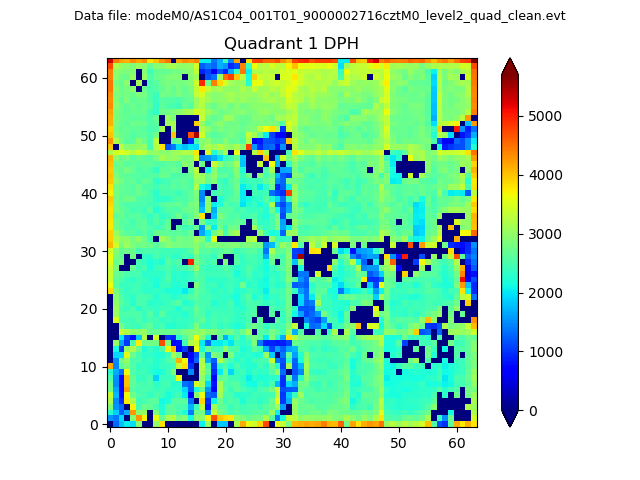
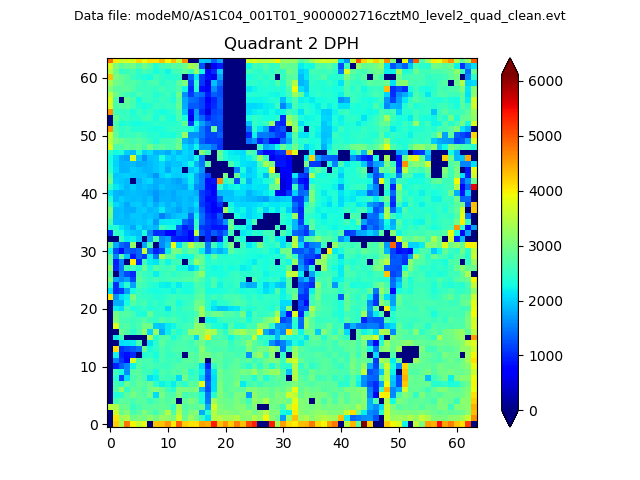
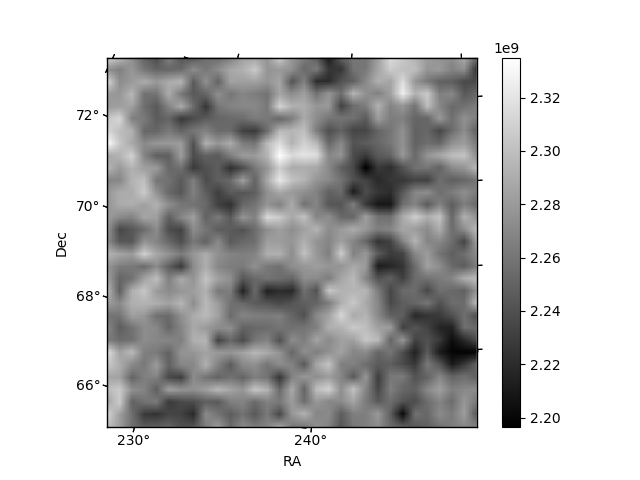
Histogram calculated using DETX and DETY for each event in the final _common_clean file
| Quadrant A |  |
 |
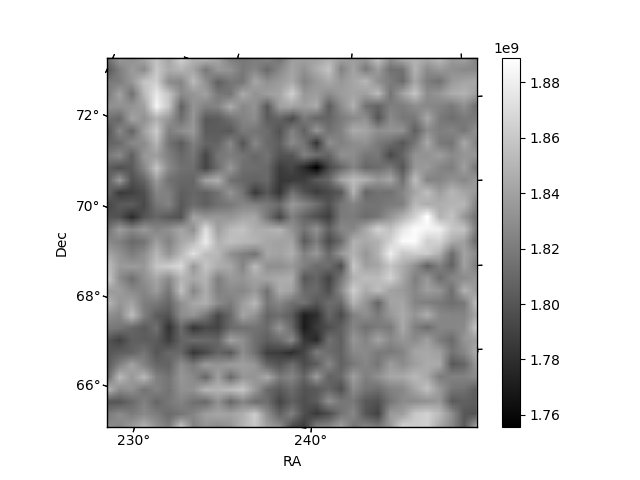
Quadrant B |
|---|---|---|---|
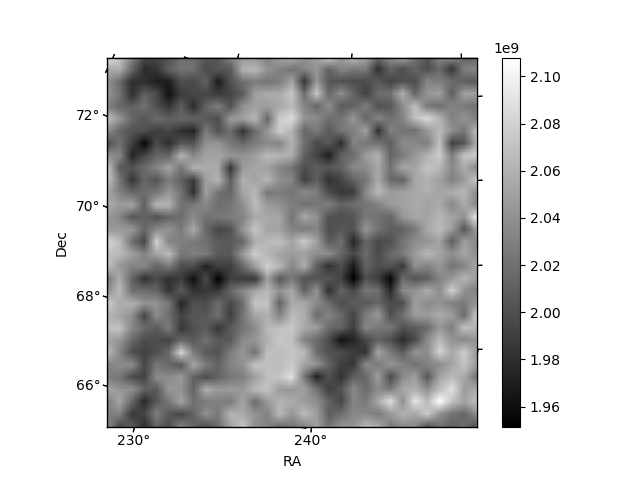
| Quadrant D |  |
 |
Quadrant C |
| Plot type | Count rate plots | Images |
|---|---|---|
| Comparison with Poisson distribution Blue bars denote a histogram of data divided into 1 sec bins. Red curve is a Poisson curve with rate = median count rate of data. |
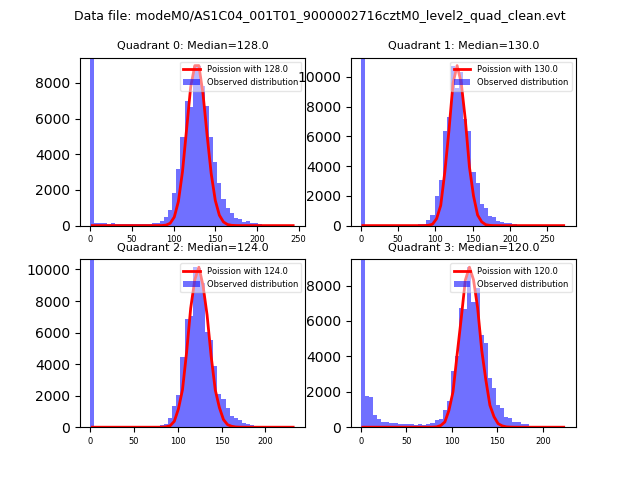 |
 |
| Quadrant-wise count rates Data is divided into 100 sec bins |
 |
|
| Module-wise count rates for Quadrant A Data is divided into 100 sec bins |
 |
 |
| Module-wise count rates for Quadrant B Data is divided into 100 sec bins |
 |
 |
| Module-wise count rates for Quadrant C Data is divided into 100 sec bins |
 |
 |
| Module-wise count rates for Quadrant D Data is divided into 100 sec bins |
 |
 |
| Parameter | Plot |
|---|---|
| CZT HV Monitor | 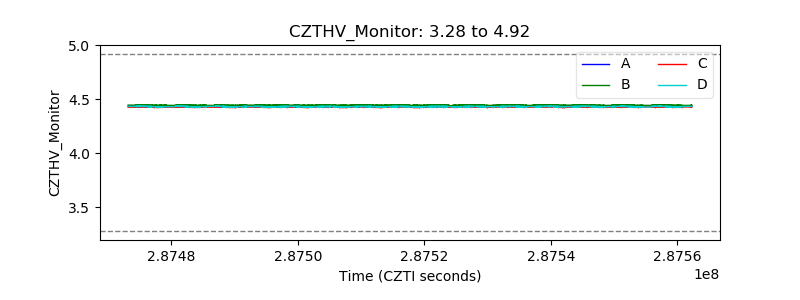 |
| D_VDD | 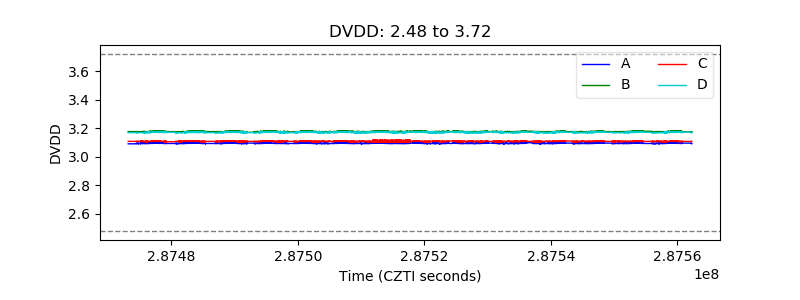 |
| Temperature 1 |  |
| Veto HV Monitor |  |
| Veto LLD |  |
| Alpha Counter |  |
| _CPM_Rate | 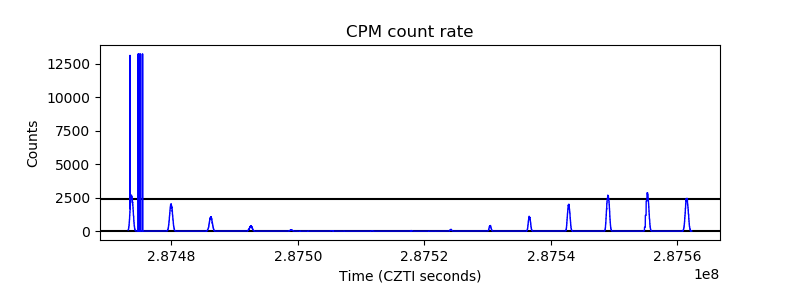 |
| CZT Counter |  |
| +2.5 Volts monitor | 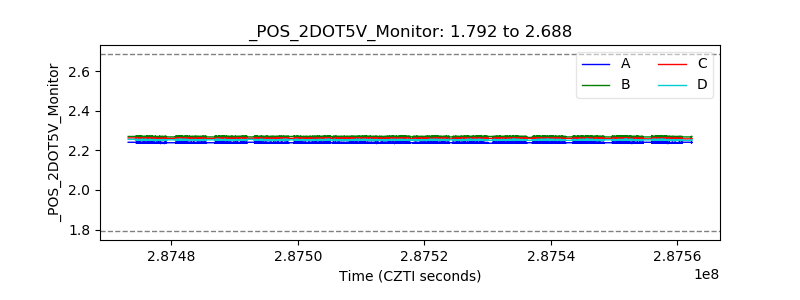 |
| +5 Volts monitor | 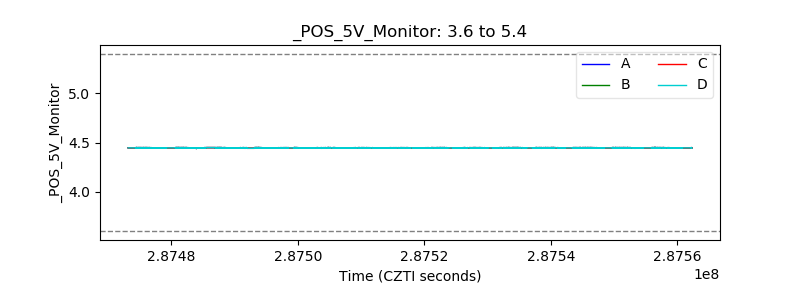 |
| _ROLL_ROT | 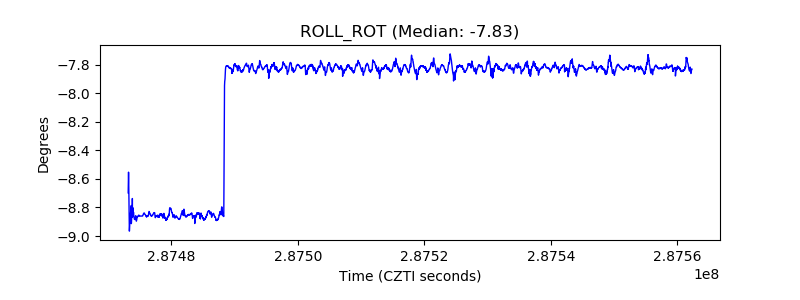 |
| _Roll_DEC |  |
| _Roll_RA | 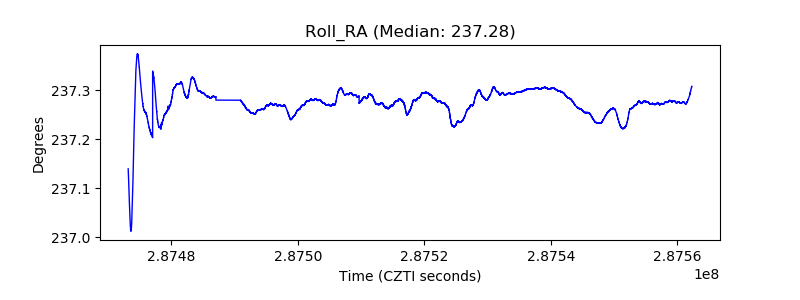 |
| Veto Counter |  |