| Param | Original file | Final file |
|---|---|---|
| Filename | modeM0/AS1C04_001T01_9000002716_18223cztM0_level2.evt | modeM0/AS1C04_001T01_9000002716_18223cztM0_level2_quad_clean.evt |
| Size (bytes) | 497,839,680 | 133,375,680 |
| Size | 474.8 MB | 127.2 MB |
| Events in quadrant A | 4,338,000 | 905,995 |
| Events in quadrant B | 3,191,814 | 946,644 |
| Events in quadrant C | 3,031,962 | 882,726 |
| Events in quadrant D | 4,090,140 | 867,135 |
| Mode SS | |||
|---|---|---|---|
| Quadrant | BADHDUFLAG | Total packets | Discarded packets |
| A | 0 | 130 | 0 |
| B | 0 | 130 | 0 |
| C | 0 | 130 | 0 |
| D | 0 | 130 | 0 |
| Mode M9 | |||
|---|---|---|---|
| Quadrant | BADHDUFLAG | Total packets | Discarded packets |
| A | 0 | 26 | 0 |
| B | 0 | 26 | 0 |
| C | 0 | 26 | 0 |
| D | 0 | 26 | 0 |
| Mode M0 | |||
|---|---|---|---|
| Quadrant | BADHDUFLAG | Total packets | Discarded packets |
| A | 0 | 16739 | 2 |
| B | 0 | 13233 | 2 |
| C | 0 | 12875 | 2 |
| D | 0 | 16219 | 2 |
| Quadrant | Total seconds | Saturated seconds | Saturation percentage |
|---|---|---|---|
| A | 6262 | 445 | 7.106356% |
| B | 6262 | 35 | 0.558927% |
| C | 6262 | 35 | 0.558927% |
| D | 6262 | 160 | 2.555094% |
Noise dominated data is calculated using 1-second bins in cleaned event files. If a bin has >2000 counts, and if more than 50% of those come from <1% of pixels, then it is considered to be noise-dominated and hence unusable.
| Quadrant | # 1 sec bins | Bins with >0 counts | Bins with >2000 counts | High rate bins dominated by noise | Noise dominated (total time) | Noise dominated (detector-on time) | Marked lightcurve |
|---|---|---|---|---|---|---|---|
| A | 7642 | 6262 | 296 | 296 | 3.87% | 4.73% | 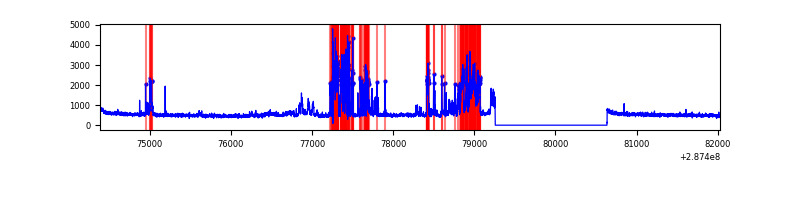 |
| B | 7642 | 6262 | 5 | 5 | 0.07% | 0.08% | 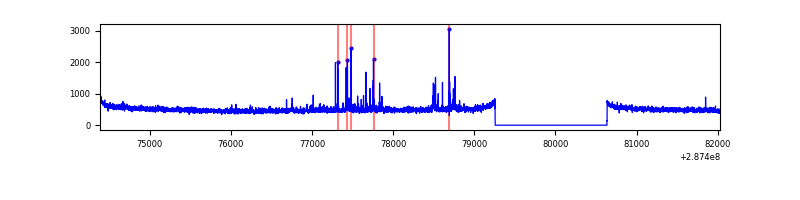 |
| C | 7642 | 6262 | 0 | 0 | 0.00% | 0.00% | 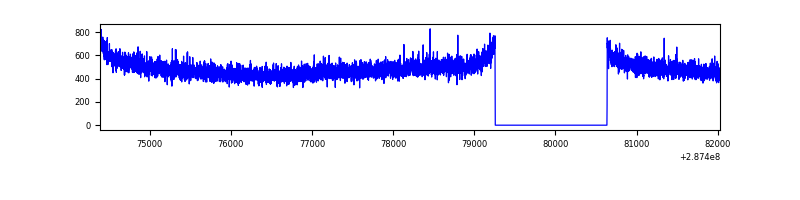 |
| D | 7642 | 6263 | 147 | 147 | 1.92% | 2.35% | 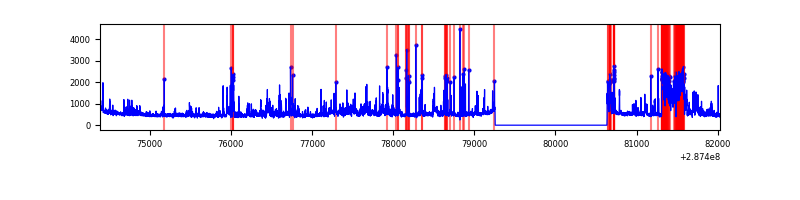 |
Top three noisy pixels from each quadrant. If the there are fewer than three noisy pixels in the level2.evt file, extra rows are filled as -1
| Pixel properties | Quadrant properties | ||||||
|---|---|---|---|---|---|---|---|
| Quadrant | DetID | PixID | Counts | Sigma | Mean | Median | Sigma |
| A | 15 | 174 | 1335749 | 8652.39 | 780 | 766 | 154.3 |
| A | 0 | 226 | 7025 | 40.57 | 780 | 766 | 154.3 |
| A | 12 | 194 | 5795 | 32.59 | 780 | 766 | 154.3 |
| B | 7 | 220 | 42437 | 283.4 | 792 | 773 | 147.0 |
| B | 0 | 197 | 26783 | 176.92 | 792 | 773 | 147.0 |
| B | 0 | 189 | 19198 | 125.33 | 792 | 773 | 147.0 |
| C | 14 | 238 | 120123 | 699.27 | 746 | 751 | 170.7 |
| C | 13 | 61 | 5378 | 27.1 | 746 | 751 | 170.7 |
| C | 3 | 233 | 2256 | 8.82 | 746 | 751 | 170.7 |
| D | 1 | 52 | 1031423 | 5662.54 | 762 | 739 | 182.0 |
| D | 7 | 238 | 66264 | 359.99 | 762 | 739 | 182.0 |
| D | 14 | 34 | 45321 | 244.93 | 762 | 739 | 182.0 |
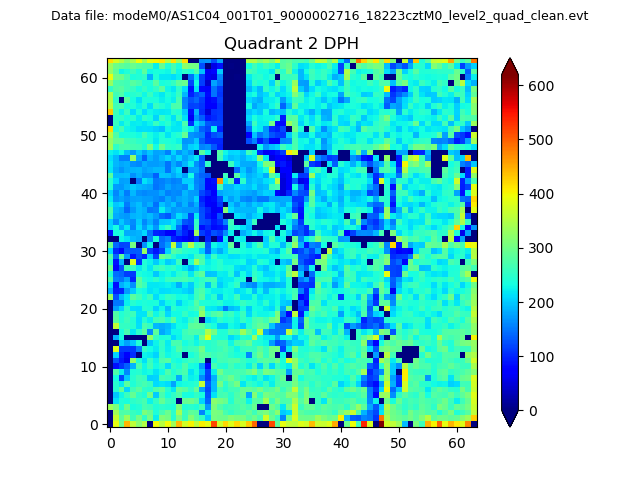
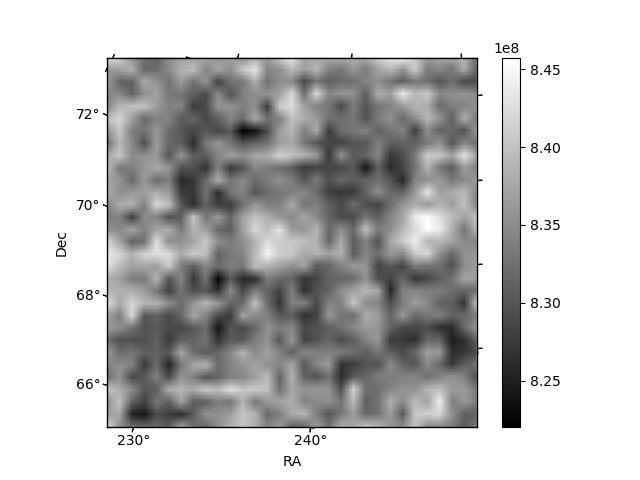
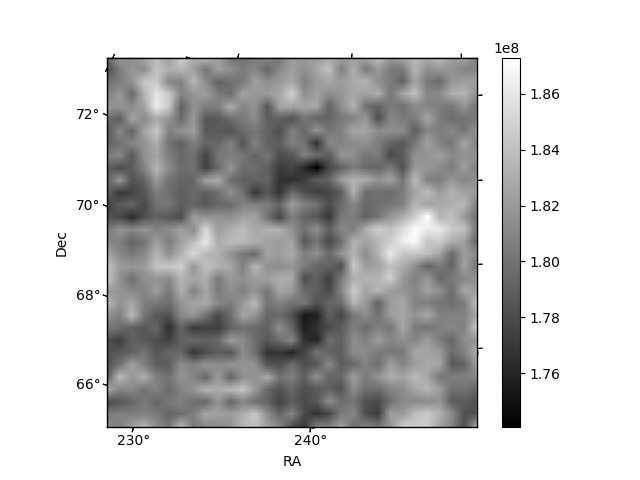
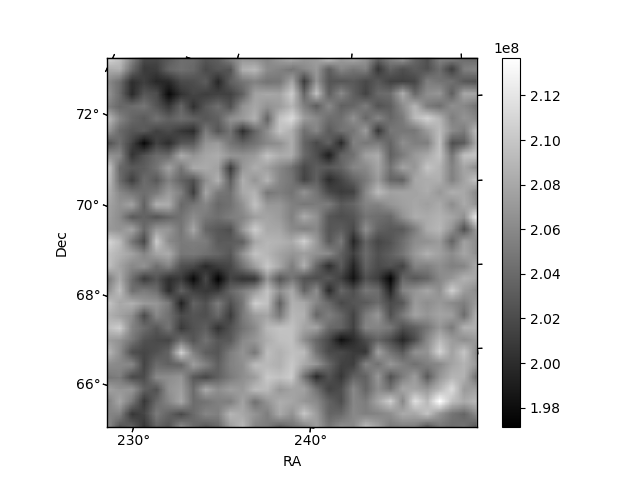
Histogram calculated using DETX and DETY for each event in the final _common_clean file
| Quadrant A | 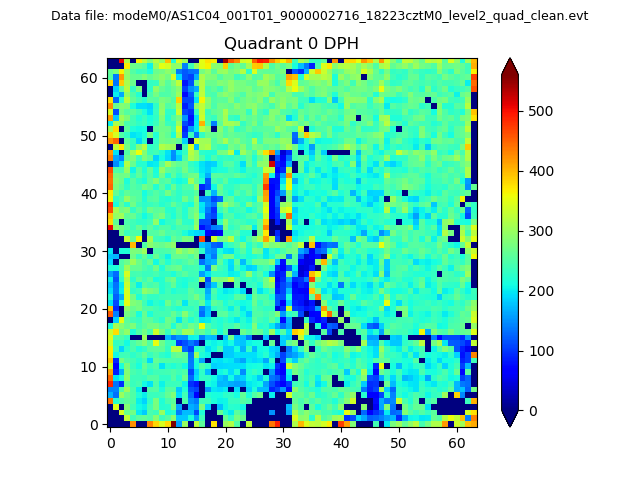 |
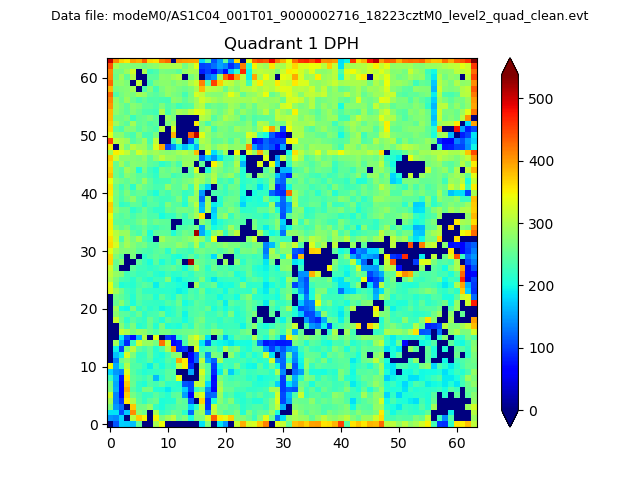 |
Quadrant B |
|---|---|---|---|
| Quadrant D | 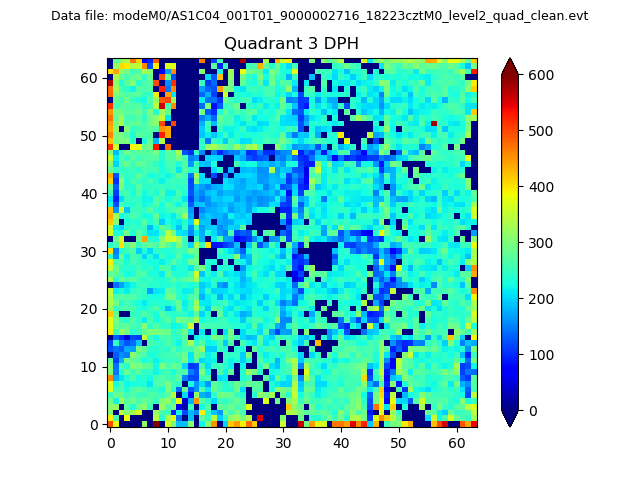 |
 |
Quadrant C |
| Plot type | Count rate plots | Images |
|---|---|---|
| Comparison with Poisson distribution Blue bars denote a histogram of data divided into 1 sec bins. Red curve is a Poisson curve with rate = median count rate of data. |
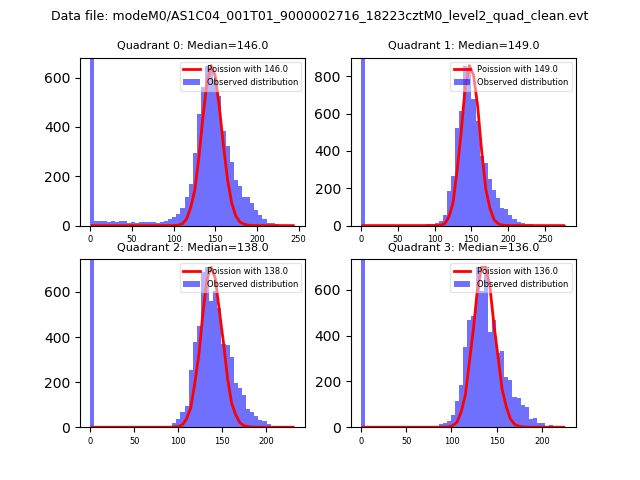 |
 |
| Quadrant-wise count rates Data is divided into 100 sec bins |
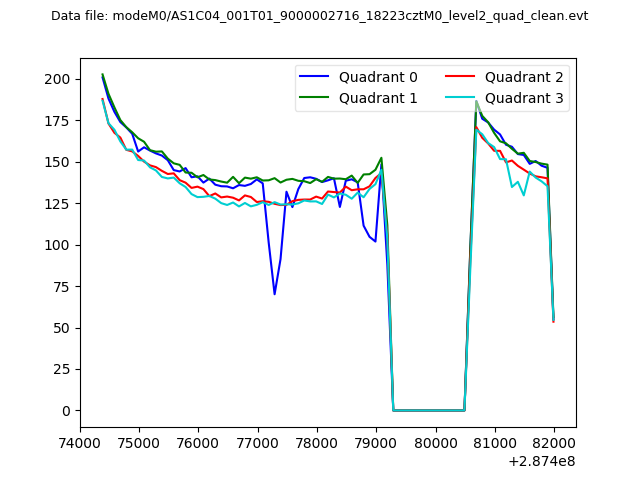 |
|
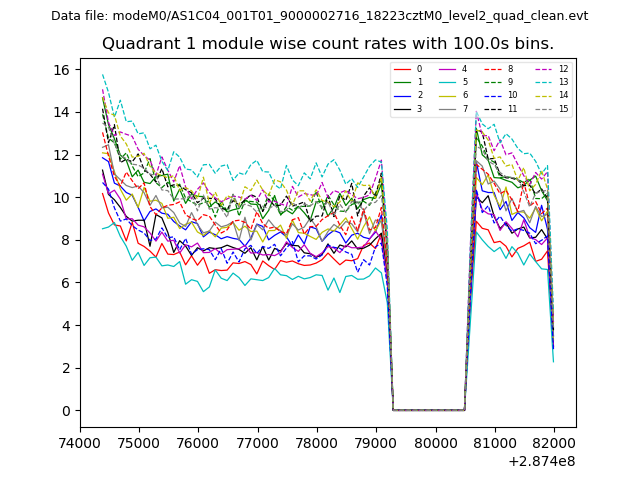
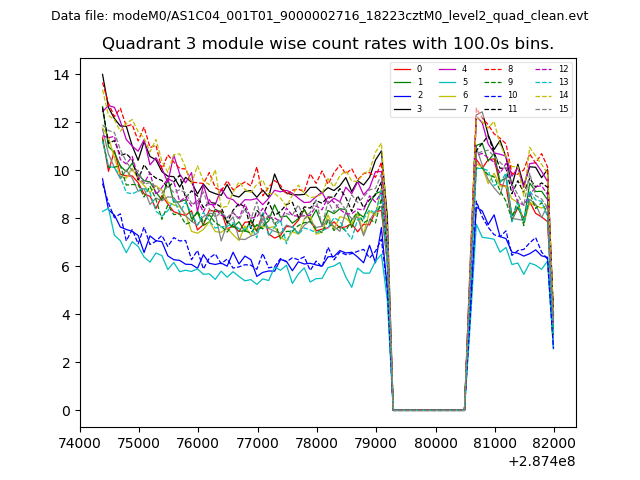
| Module-wise count rates for Quadrant A Data is divided into 100 sec bins |
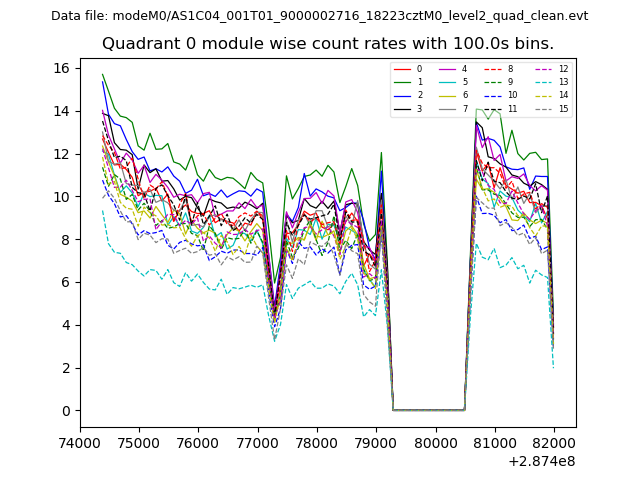 |
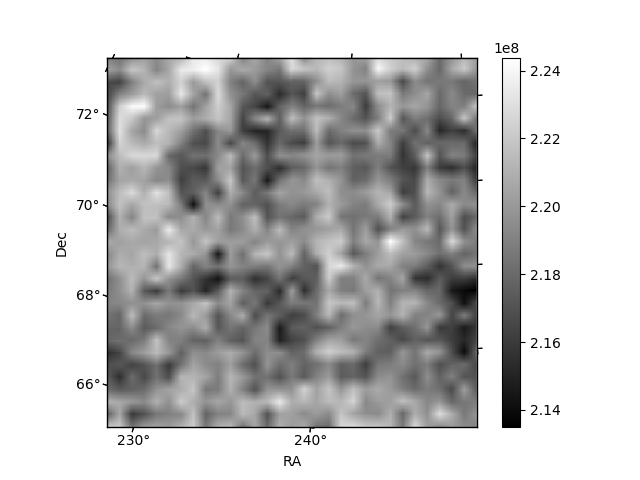 |
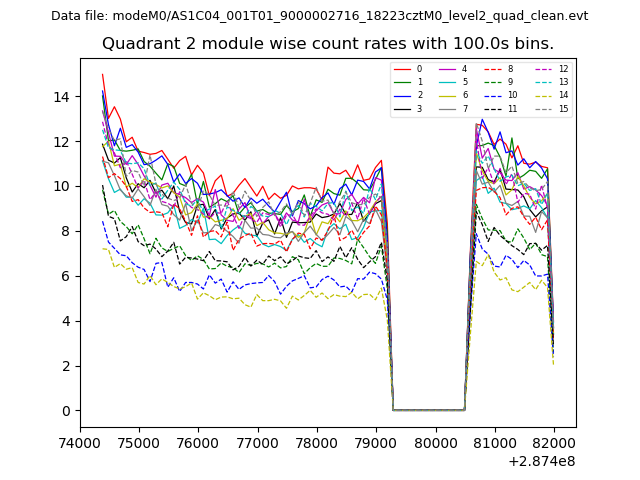
| Module-wise count rates for Quadrant B Data is divided into 100 sec bins |
 |
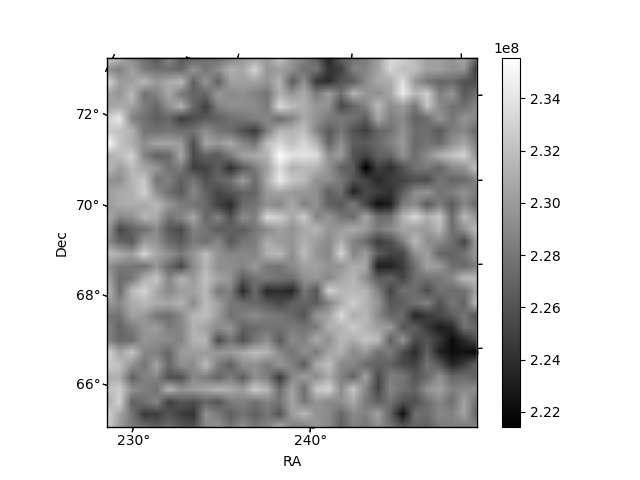 |
| Module-wise count rates for Quadrant C Data is divided into 100 sec bins |
 |
 |
| Module-wise count rates for Quadrant D Data is divided into 100 sec bins |
 |
 |
| Parameter | Plot |
|---|---|
| CZT HV Monitor | 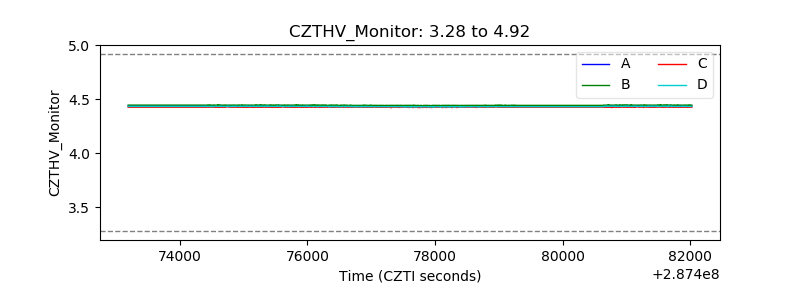 |
| D_VDD | 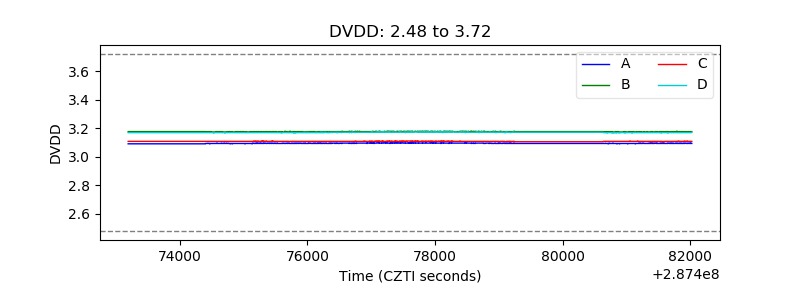 |
| Temperature 1 | 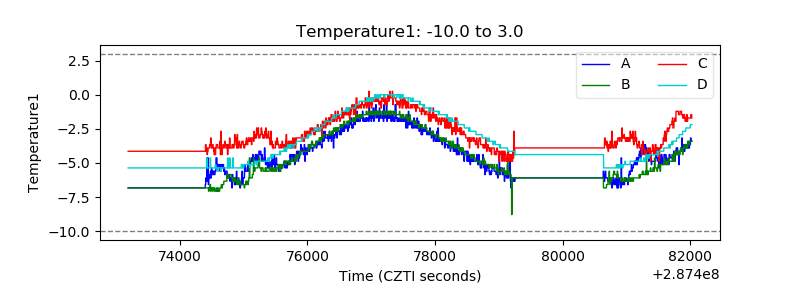 |
| Veto HV Monitor | 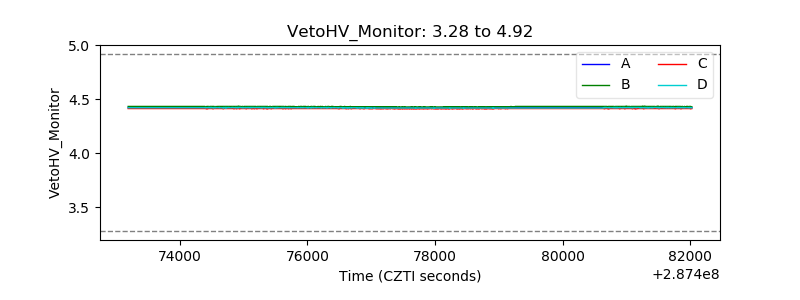 |
| Veto LLD | 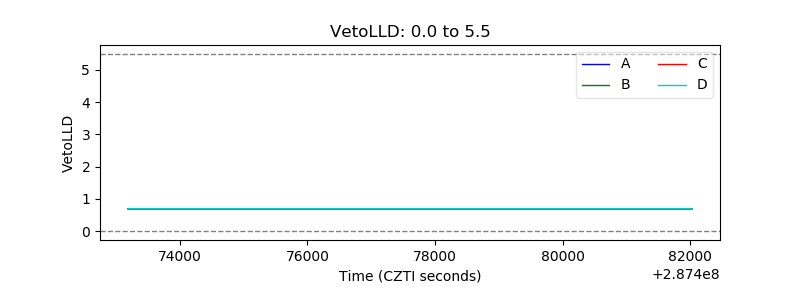 |
| Alpha Counter | 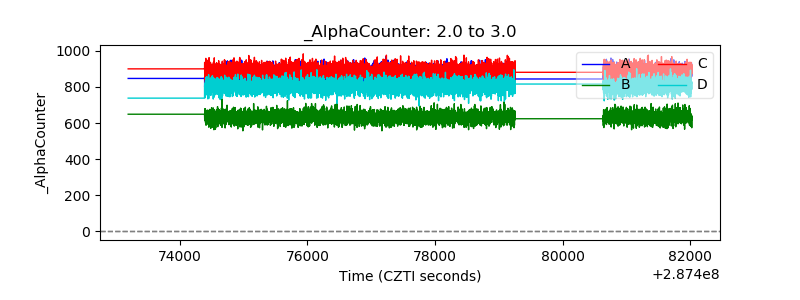 |
| _CPM_Rate | 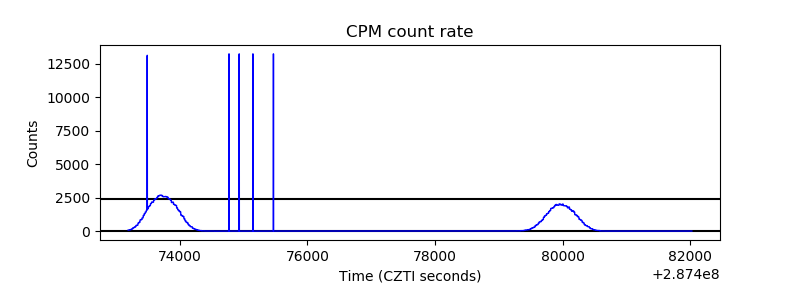 |
| CZT Counter | 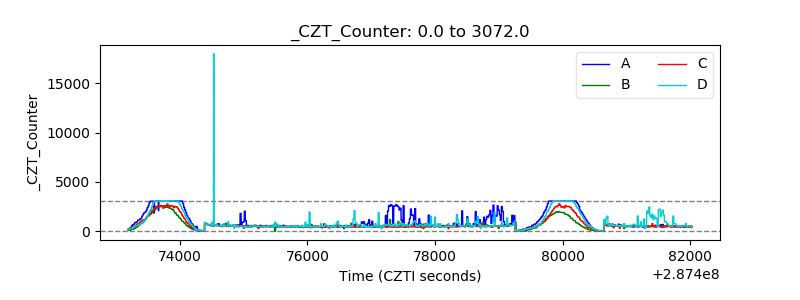 |
| +2.5 Volts monitor |  |
| +5 Volts monitor | 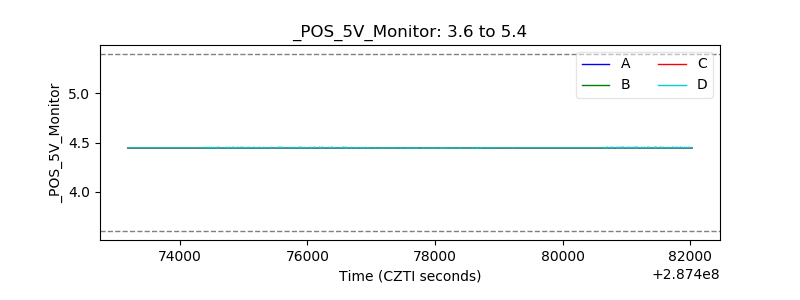 |
| _ROLL_ROT | 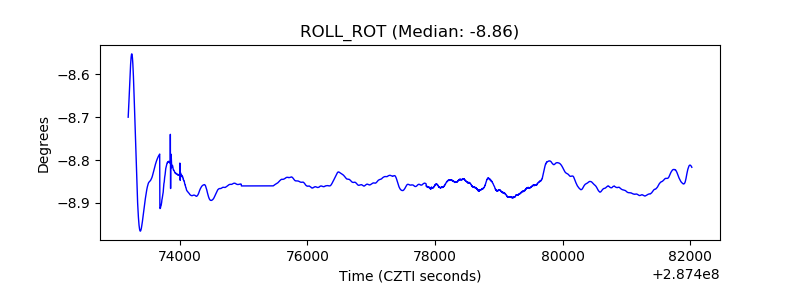 |
| _Roll_DEC | 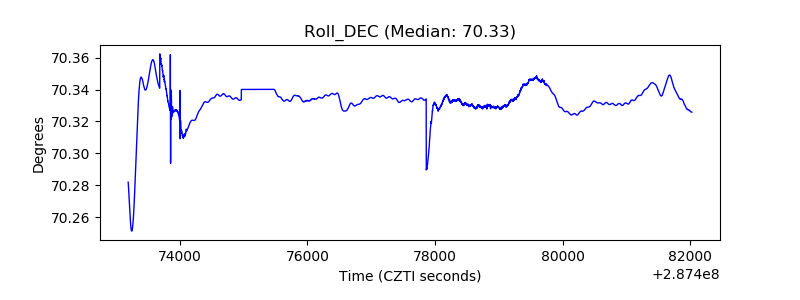 |
| _Roll_RA | 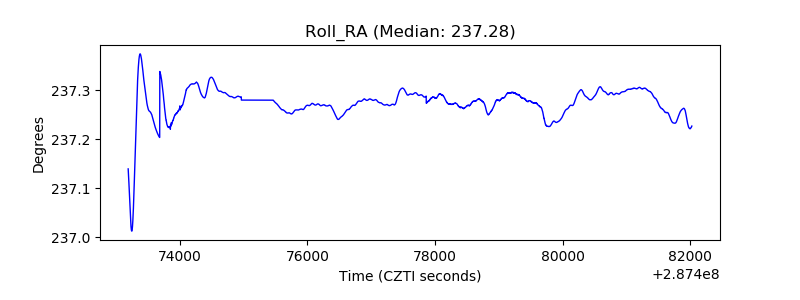 |
| Veto Counter | 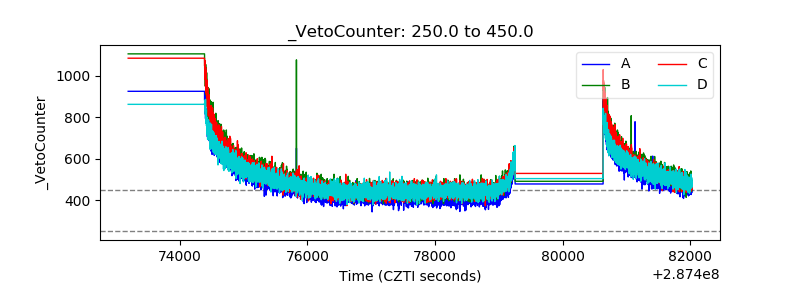 |