| Param | Original file | Final file |
|---|---|---|
| Filename | modeM0/AS1C04_001T01_9000002716_18224cztM0_level2.evt | modeM0/AS1C04_001T01_9000002716_18224cztM0_level2_quad_clean.evt |
| Size (bytes) | 454,564,800 | 127,365,120 |
| Size | 433.5 MB | 121.5 MB |
| Events in quadrant A | 3,173,295 | 888,771 |
| Events in quadrant B | 3,007,493 | 890,742 |
| Events in quadrant C | 2,909,410 | 836,519 |
| Events in quadrant D | 4,262,555 | 816,183 |
| Mode SS | |||
|---|---|---|---|
| Quadrant | BADHDUFLAG | Total packets | Discarded packets |
| A | 0 | 124 | 0 |
| B | 0 | 124 | 0 |
| C | 0 | 124 | 0 |
| D | 0 | 124 | 0 |
| Mode M9 | |||
|---|---|---|---|
| Quadrant | BADHDUFLAG | Total packets | Discarded packets |
| A | 0 | 13 | 0 |
| B | 0 | 13 | 0 |
| C | 0 | 13 | 0 |
| D | 0 | 13 | 0 |
| Mode M0 | |||
|---|---|---|---|
| Quadrant | BADHDUFLAG | Total packets | Discarded packets |
| A | 0 | 13053 | 1 |
| B | 0 | 12608 | 1 |
| C | 0 | 12396 | 1 |
| D | 0 | 16596 | 2 |
| Quadrant | Total seconds | Saturated seconds | Saturation percentage |
|---|---|---|---|
| A | 6092 | 53 | 0.869993% |
| B | 6093 | 37 | 0.607254% |
| C | 6093 | 46 | 0.754965% |
| D | 6092 | 284 | 4.661852% |
Noise dominated data is calculated using 1-second bins in cleaned event files. If a bin has >2000 counts, and if more than 50% of those come from <1% of pixels, then it is considered to be noise-dominated and hence unusable.
| Quadrant | # 1 sec bins | Bins with >0 counts | Bins with >2000 counts | High rate bins dominated by noise | Noise dominated (total time) | Noise dominated (detector-on time) | Marked lightcurve |
|---|---|---|---|---|---|---|---|
| A | 7432 | 6092 | 13 | 13 | 0.17% | 0.21% | 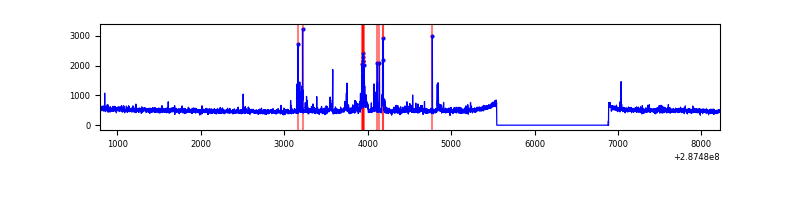 |
| B | 7433 | 6093 | 2 | 2 | 0.03% | 0.03% | 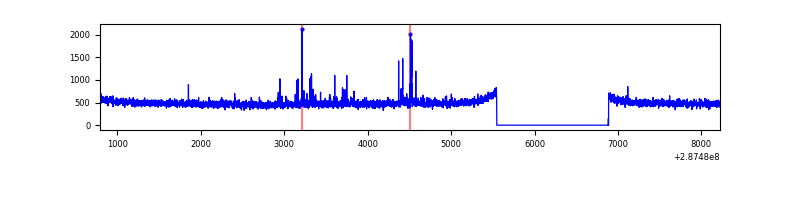 |
| C | 7433 | 6093 | 0 | 0 | 0.00% | 0.00% | 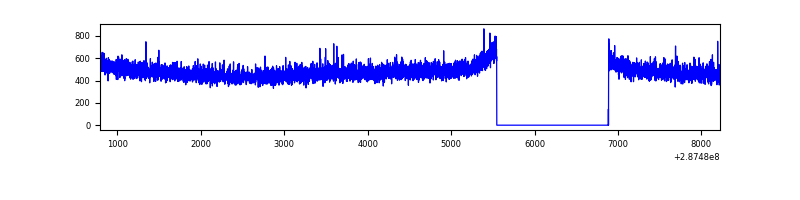 |
| D | 7432 | 6092 | 257 | 257 | 3.46% | 4.22% | 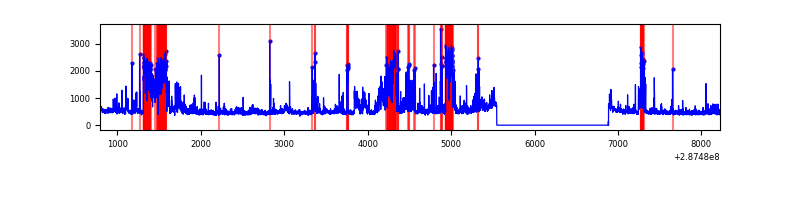 |
Top three noisy pixels from each quadrant. If the there are fewer than three noisy pixels in the level2.evt file, extra rows are filled as -1
| Pixel properties | Quadrant properties | ||||||
|---|---|---|---|---|---|---|---|
| Quadrant | DetID | PixID | Counts | Sigma | Mean | Median | Sigma |
| A | 15 | 174 | 199067 | 1302.92 | 769 | 756 | 152.2 |
| A | 13 | 210 | 8846 | 53.15 | 769 | 756 | 152.2 |
| A | 0 | 226 | 6882 | 40.25 | 769 | 756 | 152.2 |
| B | 7 | 220 | 26689 | 184.64 | 756 | 737 | 140.6 |
| B | 0 | 197 | 24587 | 169.69 | 756 | 737 | 140.6 |
| B | 12 | 111 | 15663 | 106.19 | 756 | 737 | 140.6 |
| C | 14 | 238 | 114961 | 696.34 | 716 | 721 | 164.1 |
| C | 13 | 61 | 5226 | 27.46 | 716 | 721 | 164.1 |
| C | 3 | 233 | 2107 | 8.45 | 716 | 721 | 164.1 |
| D | 1 | 52 | 1147701 | 6537.6 | 729 | 707 | 175.4 |
| D | 5 | 222 | 188628 | 1071.11 | 729 | 707 | 175.4 |
| D | 7 | 238 | 91256 | 516.11 | 729 | 707 | 175.4 |
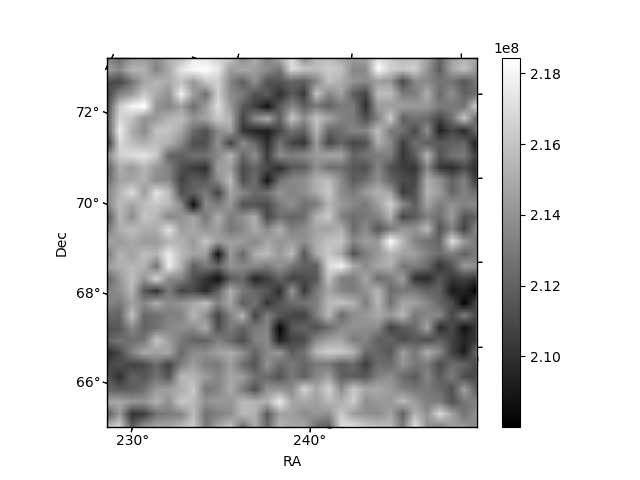
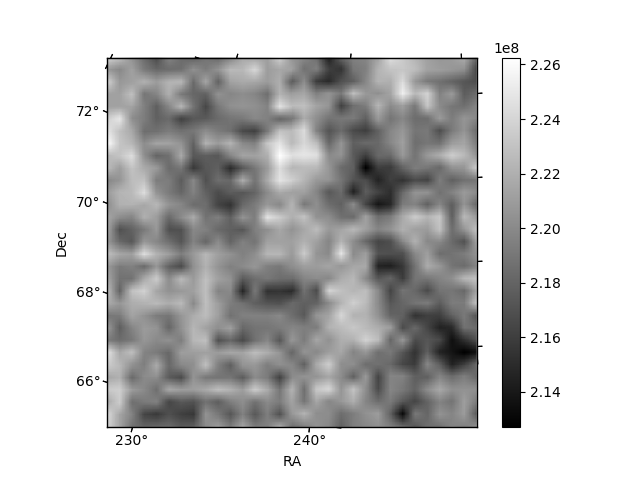
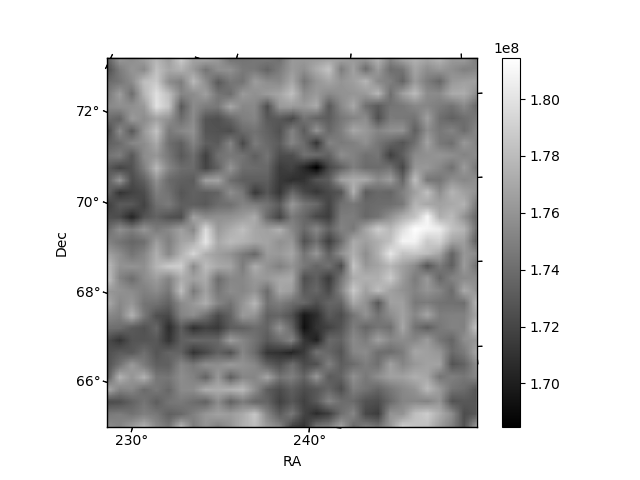
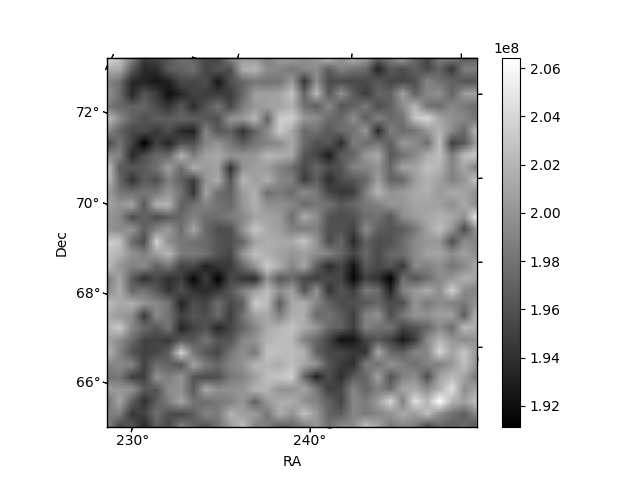
Histogram calculated using DETX and DETY for each event in the final _common_clean file
| Quadrant A |  |
 |
Quadrant B |
|---|---|---|---|
| Quadrant D |  |
 |
Quadrant C |
| Plot type | Count rate plots | Images |
|---|---|---|
| Comparison with Poisson distribution Blue bars denote a histogram of data divided into 1 sec bins. Red curve is a Poisson curve with rate = median count rate of data. |
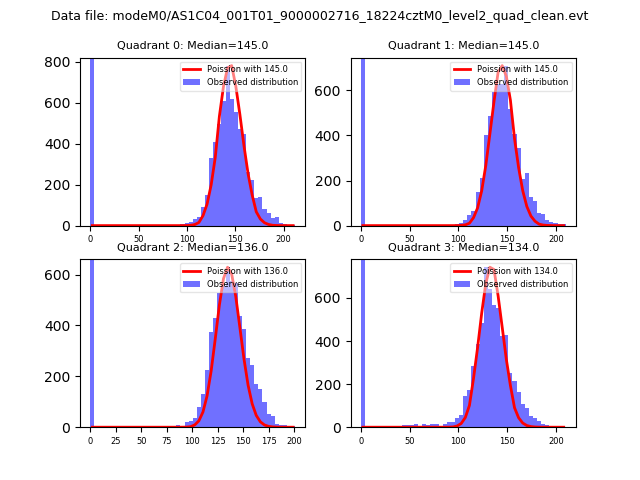 |
 |
| Quadrant-wise count rates Data is divided into 100 sec bins |
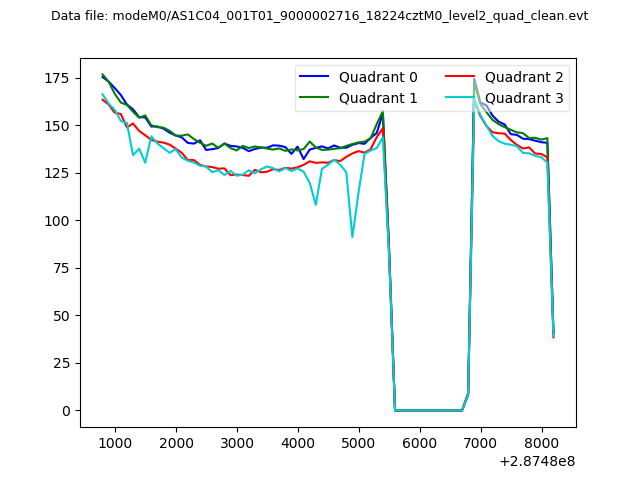 |
|
| Module-wise count rates for Quadrant A Data is divided into 100 sec bins |
 |
 |
| Module-wise count rates for Quadrant B Data is divided into 100 sec bins |
 |
 |
| Module-wise count rates for Quadrant C Data is divided into 100 sec bins |
 |
 |
| Module-wise count rates for Quadrant D Data is divided into 100 sec bins |
 |
 |
| Parameter | Plot |
|---|---|
| CZT HV Monitor |  |
| D_VDD |  |
| Temperature 1 |  |
| Veto HV Monitor |  |
| Veto LLD |  |
| Alpha Counter | 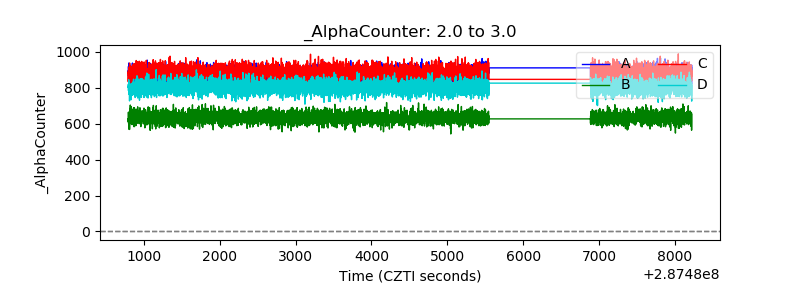 |
| _CPM_Rate | 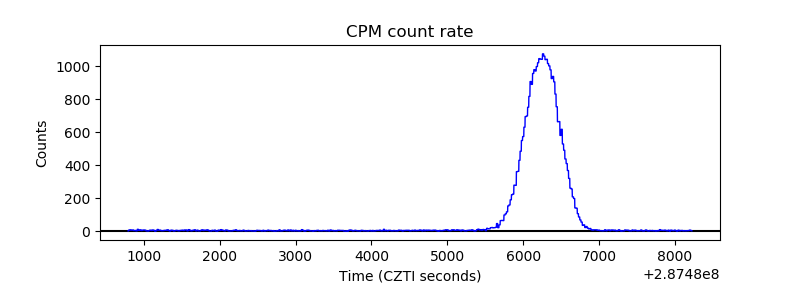 |
| CZT Counter |  |
| +2.5 Volts monitor |  |
| +5 Volts monitor |  |
| _ROLL_ROT |  |
| _Roll_DEC |  |
| _Roll_RA |  |
| Veto Counter |  |