| Param | Original file | Final file |
|---|---|---|
| Filename | modeM0/AS1C04_001T01_9000002716_18226cztM0_level2.evt | modeM0/AS1C04_001T01_9000002716_18226cztM0_level2_quad_clean.evt |
| Size (bytes) | 556,528,320 | 129,162,240 |
| Size | 530.7 MB | 123.2 MB |
| Events in quadrant A | 4,806,693 | 845,758 |
| Events in quadrant B | 3,505,878 | 902,279 |
| Events in quadrant C | 3,165,653 | 858,005 |
| Events in quadrant D | 4,909,628 | 826,520 |
| Mode SS | |||
|---|---|---|---|
| Quadrant | BADHDUFLAG | Total packets | Discarded packets |
| A | 0 | 138 | 0 |
| B | 0 | 138 | 0 |
| C | 0 | 138 | 0 |
| D | 0 | 138 | 0 |
| Mode M9 | |||
|---|---|---|---|
| Quadrant | BADHDUFLAG | Total packets | Discarded packets |
| A | 0 | 9 | 0 |
| B | 0 | 10 | 0 |
| C | 0 | 10 | 0 |
| D | 0 | 10 | 0 |
| Mode M0 | |||
|---|---|---|---|
| Quadrant | BADHDUFLAG | Total packets | Discarded packets |
| A | 0 | 18755 | 2 |
| B | 0 | 14850 | 2 |
| C | 0 | 13991 | 2 |
| D | 0 | 19173 | 3 |
| Quadrant | Total seconds | Saturated seconds | Saturation percentage |
|---|---|---|---|
| A | 6883 | 695 | 10.097341% |
| B | 6883 | 106 | 1.540026% |
| C | 6883 | 96 | 1.394741% |
| D | 6882 | 350 | 5.085731% |
Noise dominated data is calculated using 1-second bins in cleaned event files. If a bin has >2000 counts, and if more than 50% of those come from <1% of pixels, then it is considered to be noise-dominated and hence unusable.
| Quadrant | # 1 sec bins | Bins with >0 counts | Bins with >2000 counts | High rate bins dominated by noise | Noise dominated (total time) | Noise dominated (detector-on time) | Marked lightcurve |
|---|---|---|---|---|---|---|---|
| A | 7658 | 6884 | 474 | 474 | 6.19% | 6.89% | 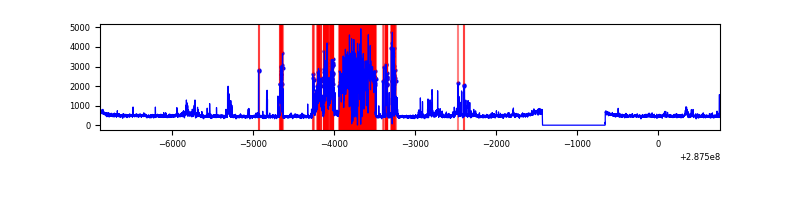 |
| B | 7658 | 6884 | 8 | 8 | 0.10% | 0.12% | 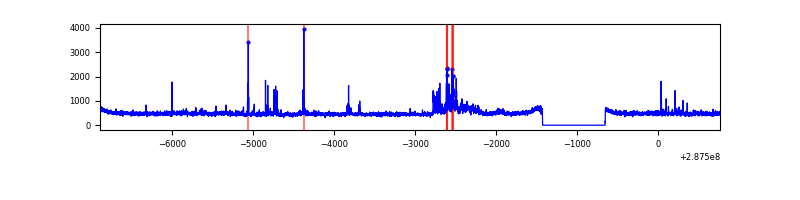 |
| C | 7658 | 6884 | 0 | 0 | 0.00% | 0.00% | 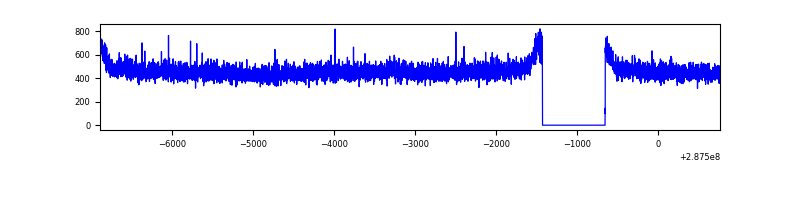 |
| D | 7657 | 6883 | 220 | 220 | 2.87% | 3.20% | 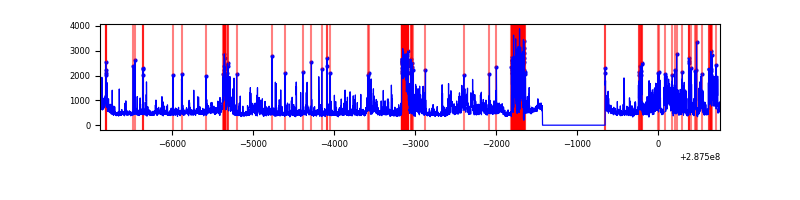 |
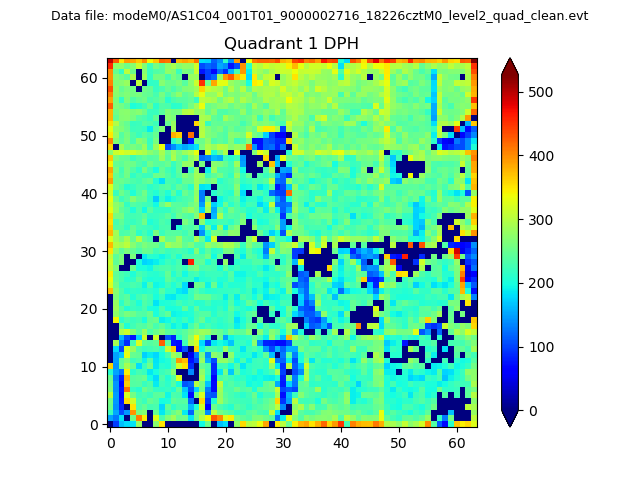
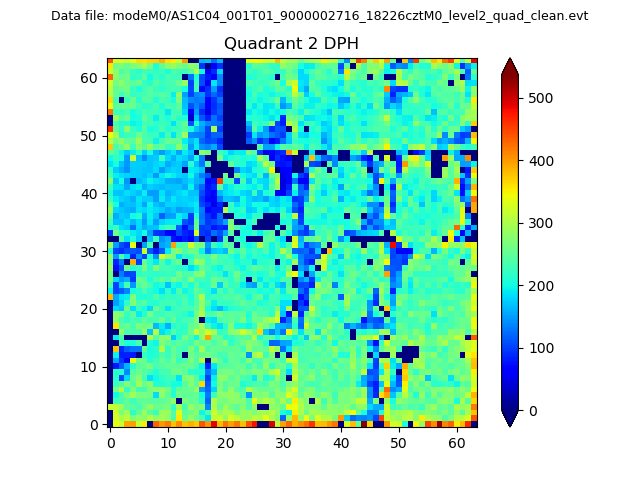
Top three noisy pixels from each quadrant. If the there are fewer than three noisy pixels in the level2.evt file, extra rows are filled as -1
| Pixel properties | Quadrant properties | ||||||
|---|---|---|---|---|---|---|---|
| Quadrant | DetID | PixID | Counts | Sigma | Mean | Median | Sigma |
| A | 15 | 174 | 1776879 | 11214.04 | 782 | 766 | 158.4 |
| A | 13 | 210 | 9002 | 52.0 | 782 | 766 | 158.4 |
| A | 4 | 2 | 8833 | 50.93 | 782 | 766 | 158.4 |
| B | 3 | 64 | 220485 | 1420.06 | 814 | 793 | 154.7 |
| B | 7 | 220 | 31439 | 198.09 | 814 | 793 | 154.7 |
| B | 0 | 189 | 17842 | 110.2 | 814 | 793 | 154.7 |
| C | 14 | 238 | 121980 | 670.89 | 777 | 777 | 180.7 |
| C | 7 | 174 | 7095 | 34.97 | 777 | 777 | 180.7 |
| C | 3 | 233 | 6380 | 31.01 | 777 | 777 | 180.7 |
| D | 5 | 222 | 812745 | 4294.95 | 780 | 755 | 189.1 |
| D | 1 | 52 | 707512 | 3738.33 | 780 | 755 | 189.1 |
| D | 14 | 34 | 108713 | 571.03 | 780 | 755 | 189.1 |
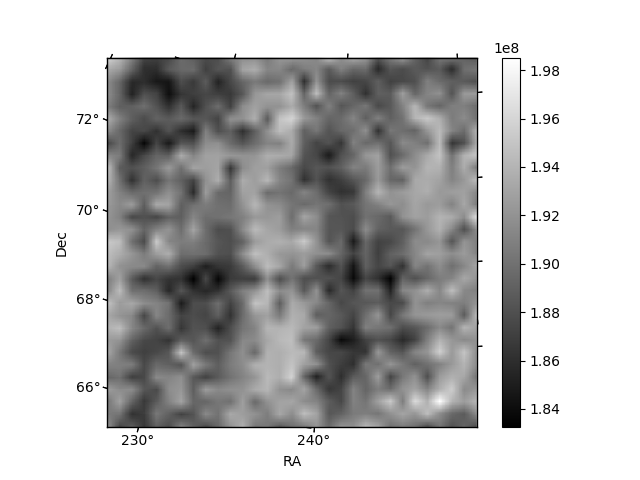
Histogram calculated using DETX and DETY for each event in the final _common_clean file
| Quadrant A | 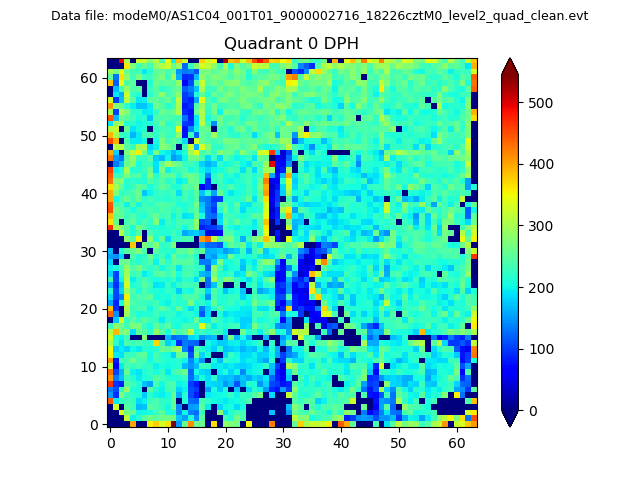 |
 |
Quadrant B |
|---|---|---|---|
| Quadrant D | 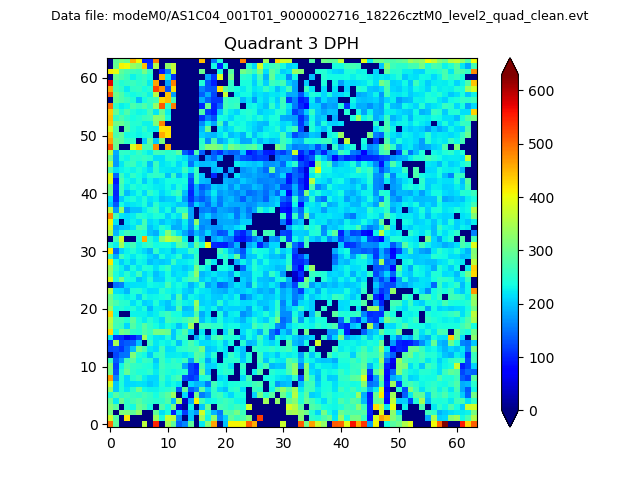 |
 |
Quadrant C |
| Plot type | Count rate plots | Images |
|---|---|---|
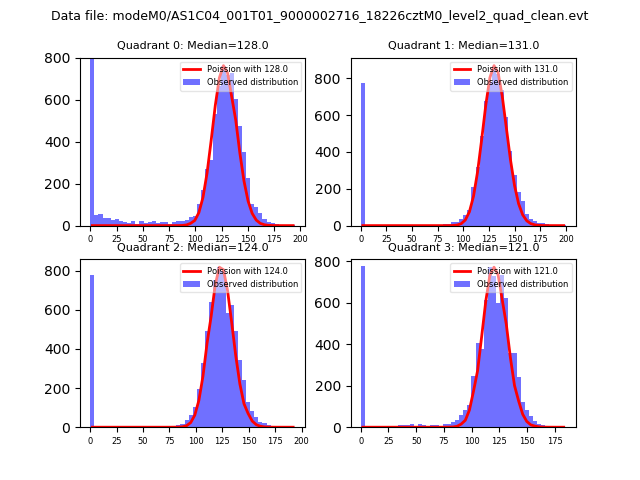
| Comparison with Poisson distribution Blue bars denote a histogram of data divided into 1 sec bins. Red curve is a Poisson curve with rate = median count rate of data. |
 |
 |
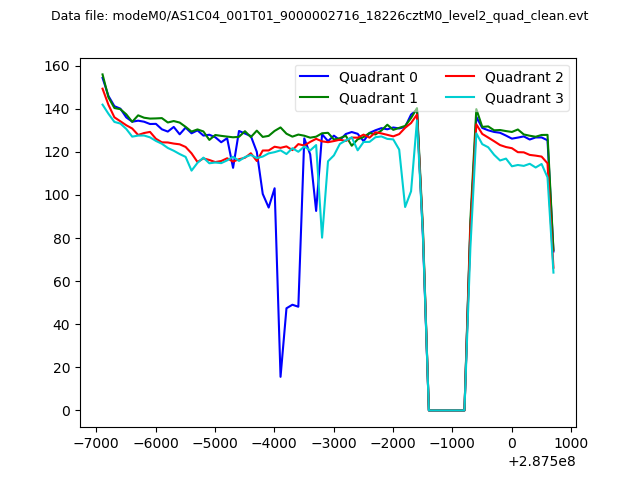
| Quadrant-wise count rates Data is divided into 100 sec bins |
 |
|
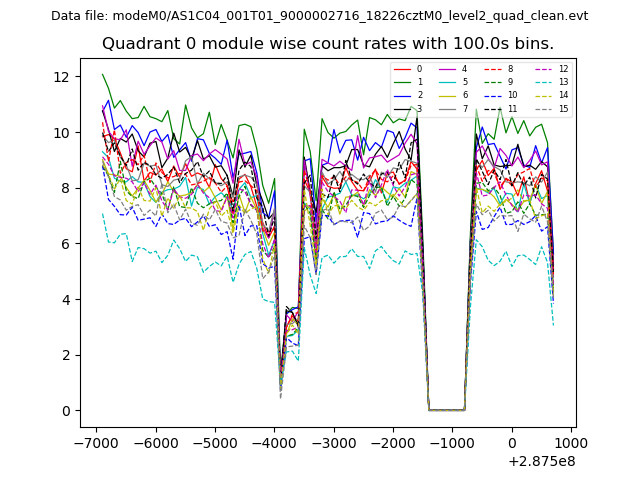
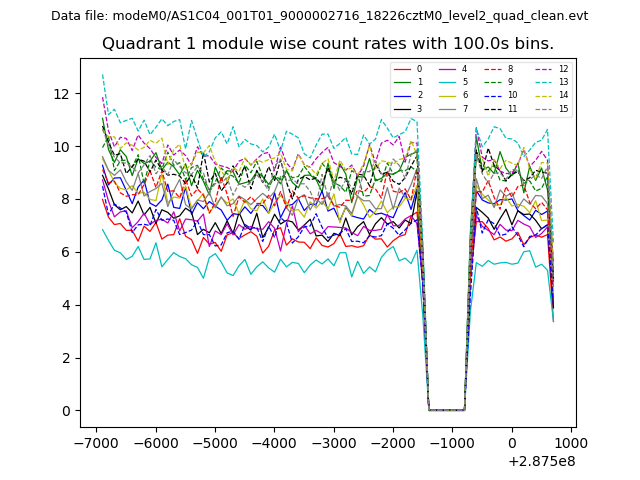
| Module-wise count rates for Quadrant A Data is divided into 100 sec bins |
 |
 |
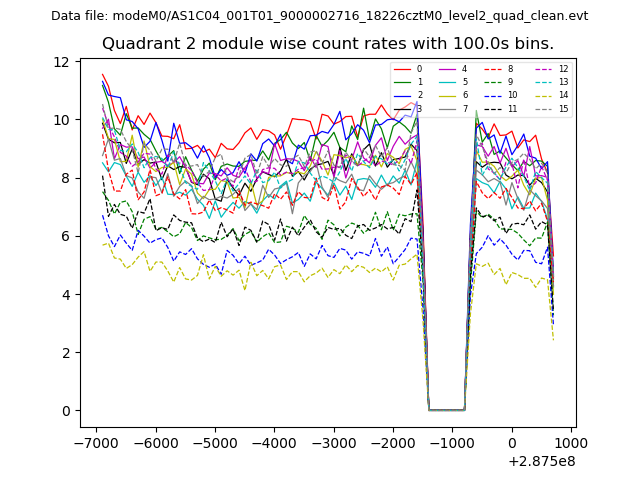
| Module-wise count rates for Quadrant B Data is divided into 100 sec bins |
 |
 |
| Module-wise count rates for Quadrant C Data is divided into 100 sec bins |
 |
 |
| Module-wise count rates for Quadrant D Data is divided into 100 sec bins |
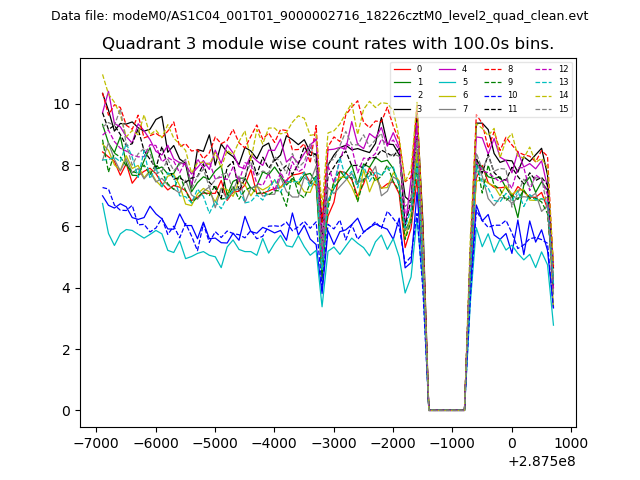 |
 |
| Parameter | Plot |
|---|---|
| CZT HV Monitor | 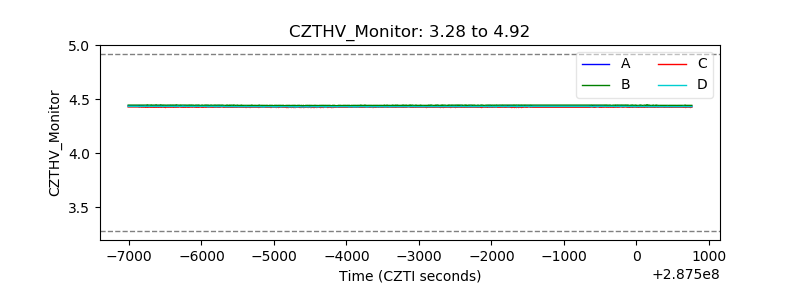 |
| D_VDD | 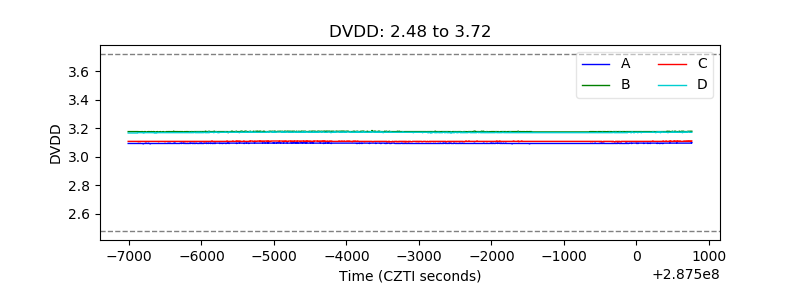 |
| Temperature 1 | 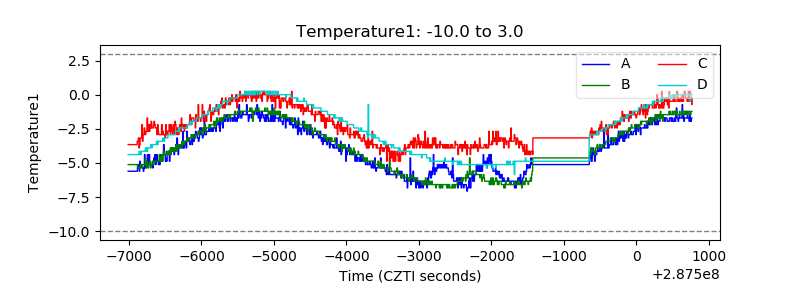 |
| Veto HV Monitor | 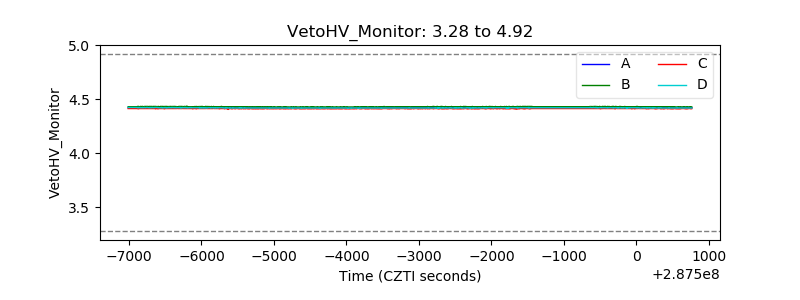 |
| Veto LLD | 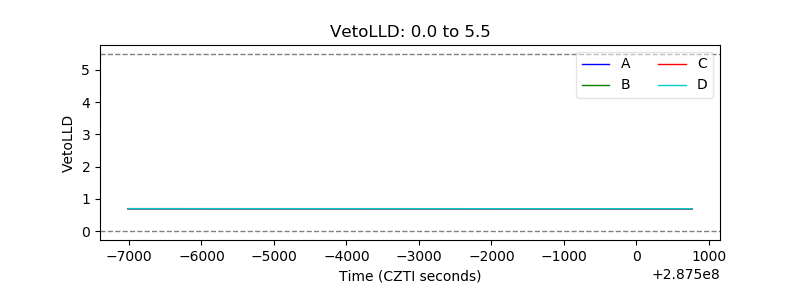 |
| Alpha Counter |  |
| _CPM_Rate | 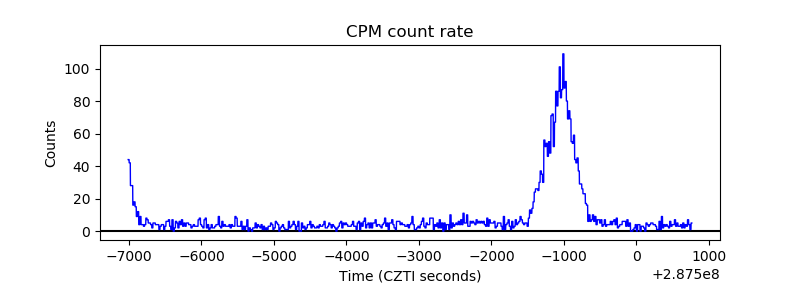 |
| CZT Counter | 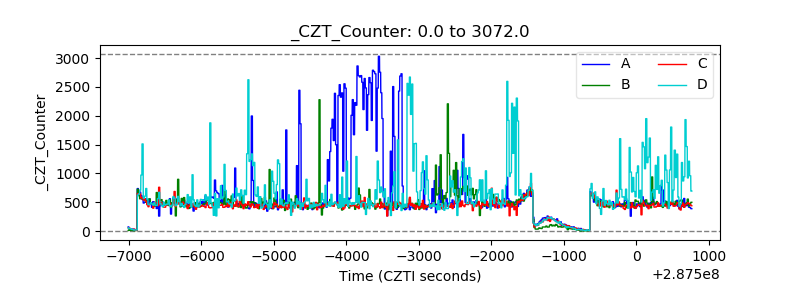 |
| +2.5 Volts monitor |  |
| +5 Volts monitor |  |
| _ROLL_ROT | 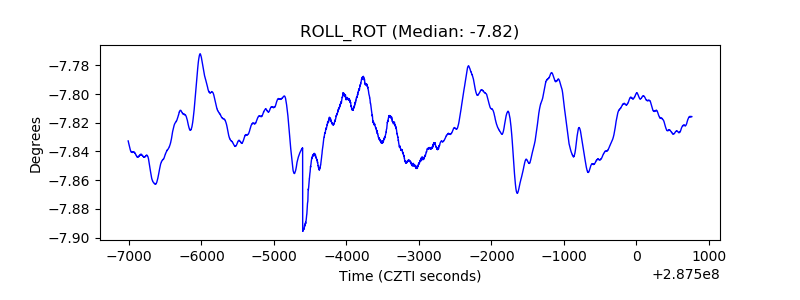 |
| _Roll_DEC | 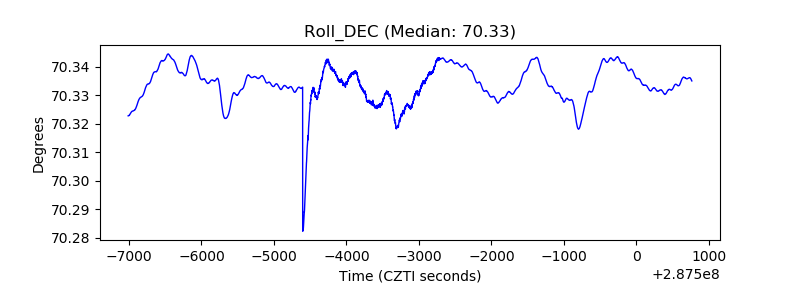 |
| _Roll_RA |  |
| Veto Counter | 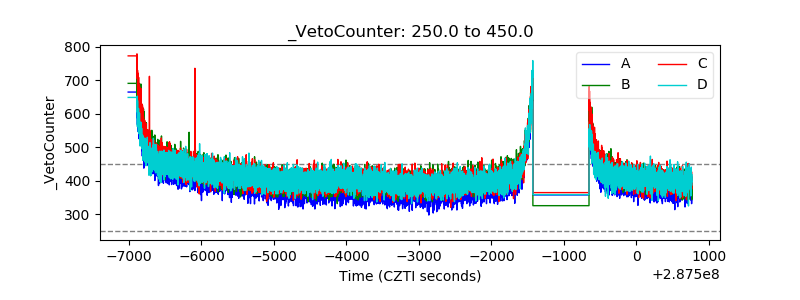 |