| Param | Original file | Final file |
|---|---|---|
| Filename | modeM0/AS1C04_001T01_9000002716_18227cztM0_level2.evt | modeM0/AS1C04_001T01_9000002716_18227cztM0_level2_quad_clean.evt |
| Size (bytes) | 557,608,320 | 129,893,760 |
| Size | 531.8 MB | 123.9 MB |
| Events in quadrant A | 4,519,155 | 844,543 |
| Events in quadrant B | 3,416,271 | 904,213 |
| Events in quadrant C | 3,241,427 | 856,382 |
| Events in quadrant D | 5,225,750 | 831,504 |
| Mode SS | |||
|---|---|---|---|
| Quadrant | BADHDUFLAG | Total packets | Discarded packets |
| A | 0 | 144 | 0 |
| B | 0 | 144 | 0 |
| C | 0 | 144 | 0 |
| D | 0 | 144 | 0 |
| Mode M9 | |||
|---|---|---|---|
| Quadrant | BADHDUFLAG | Total packets | Discarded packets |
| A | 0 | 3 | 0 |
| B | 0 | 3 | 0 |
| C | 0 | 3 | 0 |
| D | 0 | 3 | 0 |
| Mode M0 | |||
|---|---|---|---|
| Quadrant | BADHDUFLAG | Total packets | Discarded packets |
| A | 0 | 18266 | 1 |
| B | 0 | 14919 | 2 |
| C | 0 | 14510 | 1 |
| D | 0 | 20360 | 1 |
| Quadrant | Total seconds | Saturated seconds | Saturation percentage |
|---|---|---|---|
| A | 7141 | 699 | 9.788545% |
| B | 7141 | 136 | 1.904495% |
| C | 7141 | 147 | 2.058535% |
| D | 7141 | 404 | 5.657471% |
Noise dominated data is calculated using 1-second bins in cleaned event files. If a bin has >2000 counts, and if more than 50% of those come from <1% of pixels, then it is considered to be noise-dominated and hence unusable.
| Quadrant | # 1 sec bins | Bins with >0 counts | Bins with >2000 counts | High rate bins dominated by noise | Noise dominated (total time) | Noise dominated (detector-on time) | Marked lightcurve |
|---|---|---|---|---|---|---|---|
| A | 7441 | 7142 | 386 | 386 | 5.19% | 5.40% | 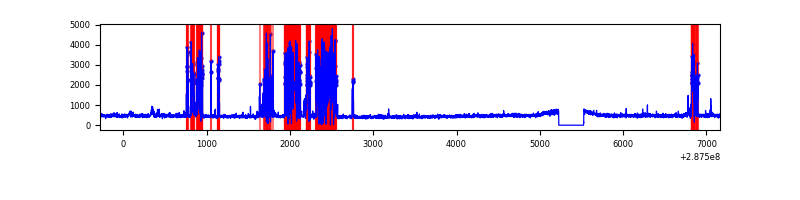 |
| B | 7441 | 7142 | 10 | 10 | 0.13% | 0.14% |  |
| C | 7441 | 7142 | 0 | 0 | 0.00% | 0.00% | 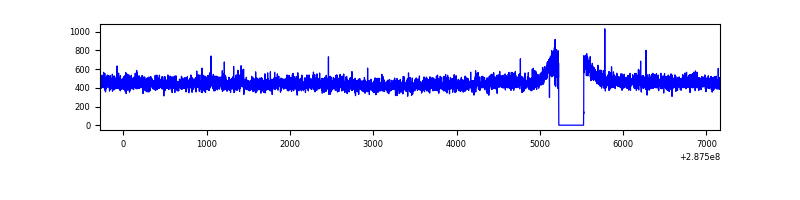 |
| D | 7441 | 7142 | 179 | 179 | 2.41% | 2.51% | 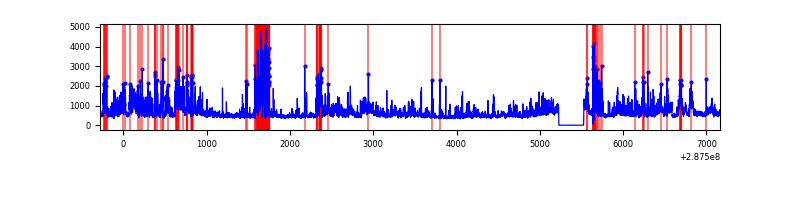 |
Top three noisy pixels from each quadrant. If the there are fewer than three noisy pixels in the level2.evt file, extra rows are filled as -1
| Pixel properties | Quadrant properties | ||||||
|---|---|---|---|---|---|---|---|
| Quadrant | DetID | PixID | Counts | Sigma | Mean | Median | Sigma |
| A | 15 | 174 | 1462739 | 9053.71 | 793 | 774 | 161.5 |
| A | 0 | 226 | 6840 | 37.57 | 793 | 774 | 161.5 |
| A | 12 | 194 | 5847 | 31.42 | 793 | 774 | 161.5 |
| B | 4 | 171 | 45515 | 280.77 | 835 | 814 | 159.2 |
| B | 7 | 220 | 41947 | 258.36 | 835 | 814 | 159.2 |
| B | 0 | 189 | 22099 | 133.69 | 835 | 814 | 159.2 |
| C | 14 | 238 | 125218 | 675.49 | 794 | 797 | 184.2 |
| C | 3 | 233 | 16358 | 84.48 | 794 | 797 | 184.2 |
| C | 13 | 61 | 5705 | 26.65 | 794 | 797 | 184.2 |
| D | 1 | 52 | 791327 | 4065.58 | 801 | 774 | 194.5 |
| D | 5 | 222 | 625413 | 3212.34 | 801 | 774 | 194.5 |
| D | 7 | 38 | 288313 | 1478.73 | 801 | 774 | 194.5 |
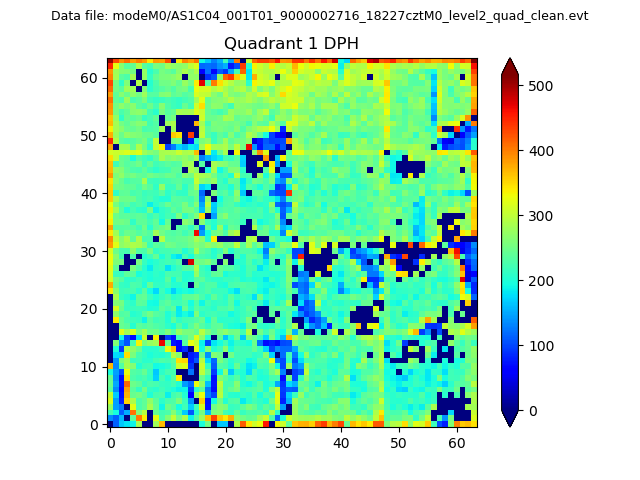
Histogram calculated using DETX and DETY for each event in the final _common_clean file
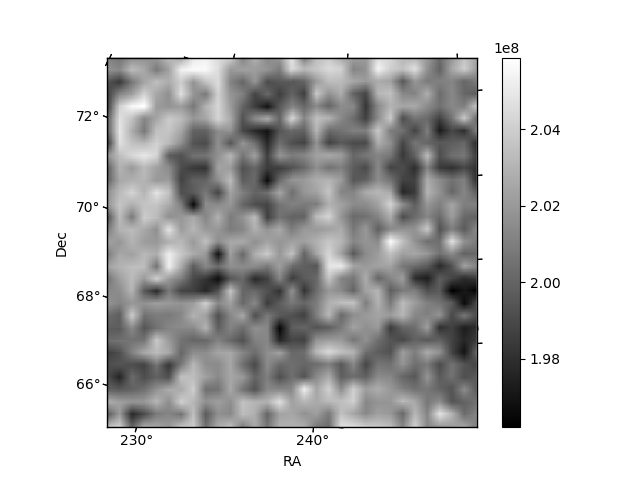
| Quadrant A | 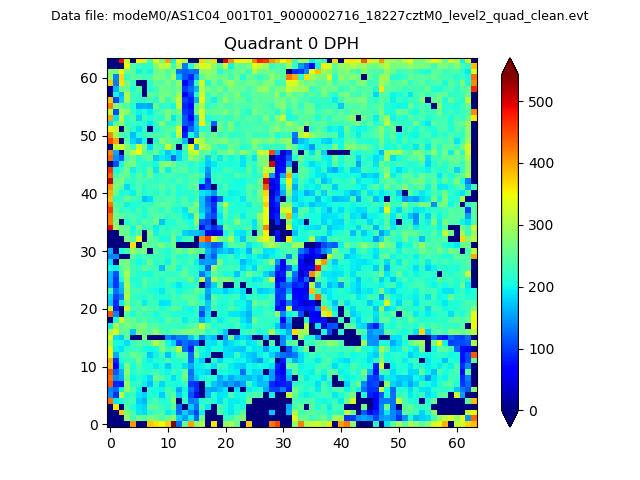 |
 |
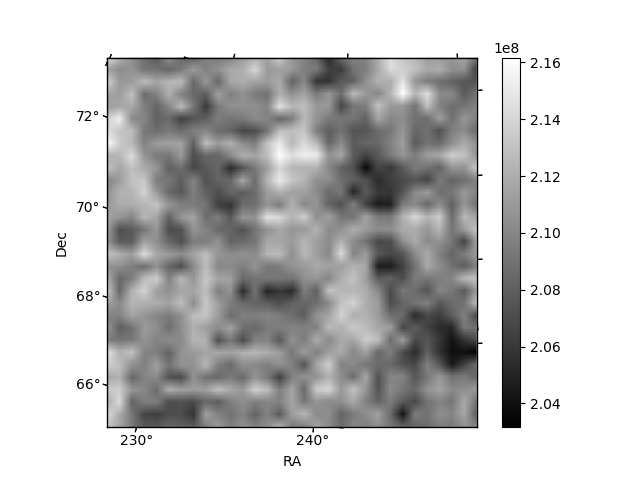
Quadrant B |
|---|---|---|---|
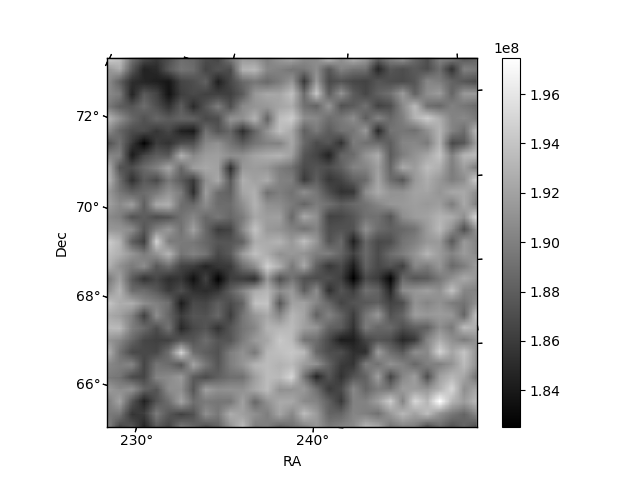
| Quadrant D | 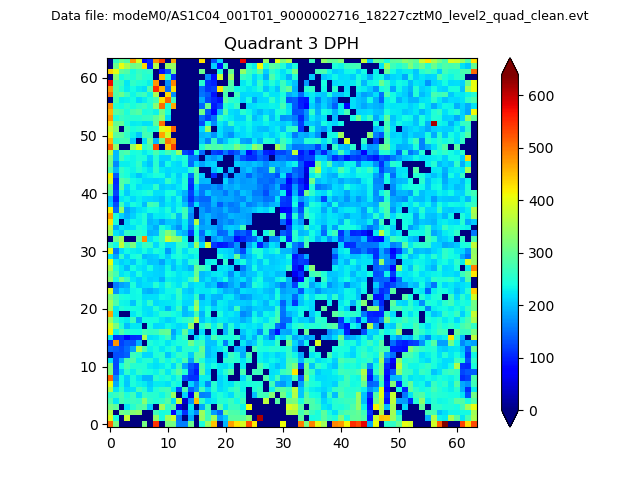 |
 |
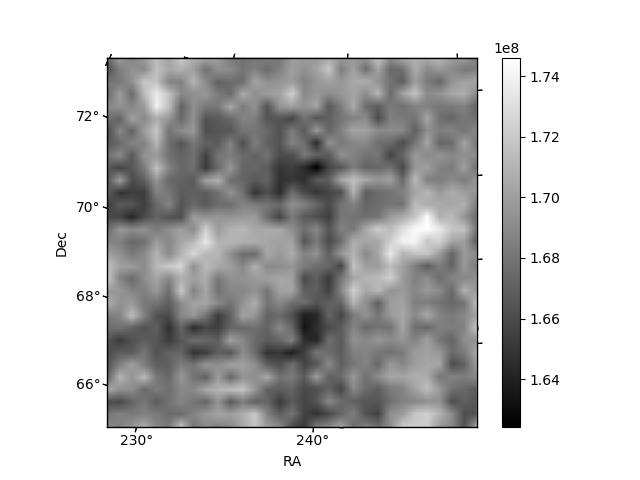
Quadrant C |
| Plot type | Count rate plots | Images |
|---|---|---|
| Comparison with Poisson distribution Blue bars denote a histogram of data divided into 1 sec bins. Red curve is a Poisson curve with rate = median count rate of data. |
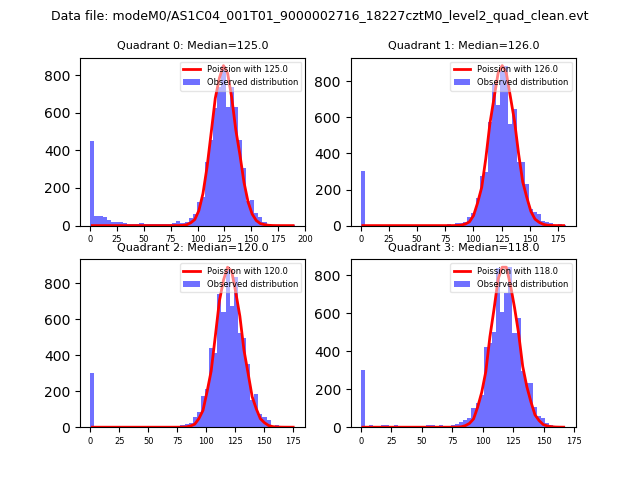 |
 |
| Quadrant-wise count rates Data is divided into 100 sec bins |
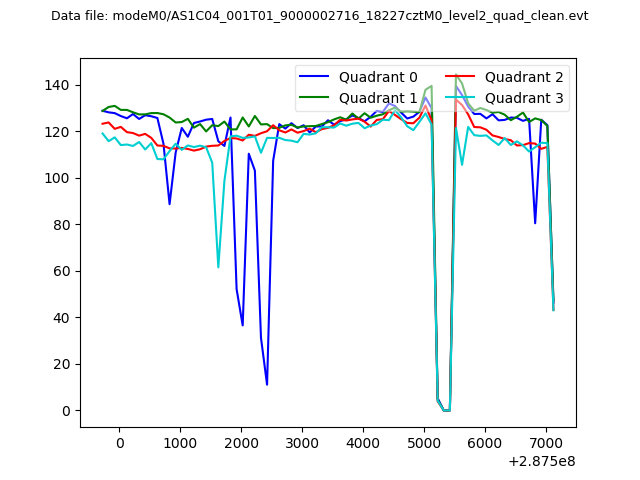 |
|
| Module-wise count rates for Quadrant A Data is divided into 100 sec bins |
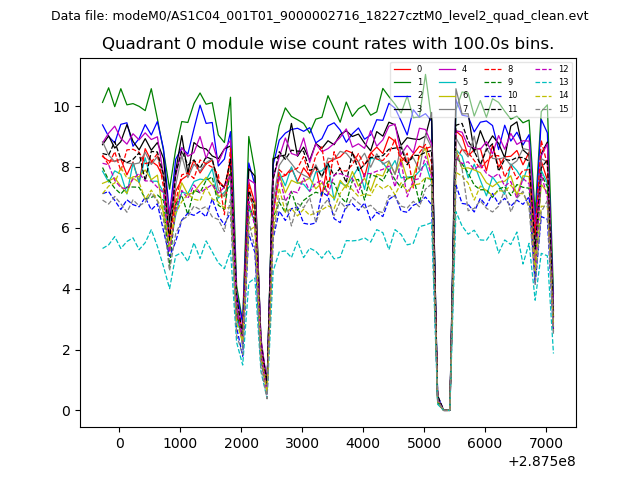 |
 |
| Module-wise count rates for Quadrant B Data is divided into 100 sec bins |
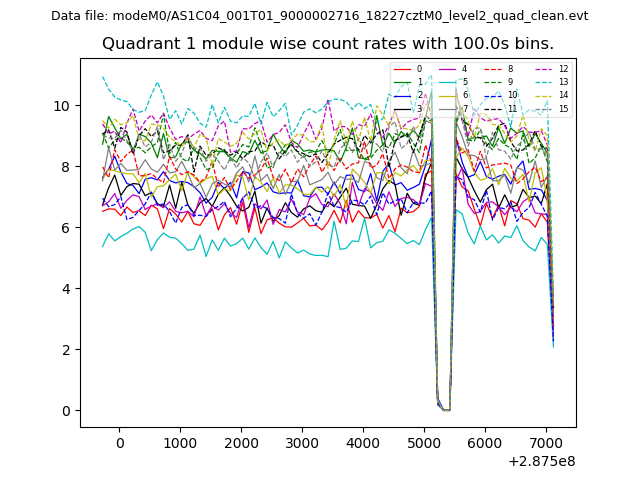 |
 |
| Module-wise count rates for Quadrant C Data is divided into 100 sec bins |
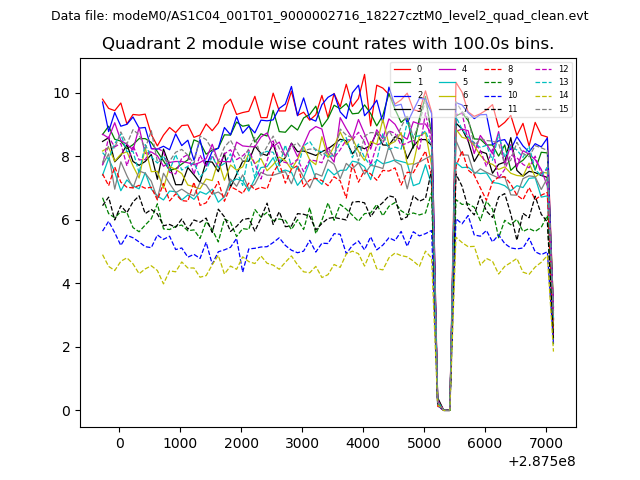 |
 |
| Module-wise count rates for Quadrant D Data is divided into 100 sec bins |
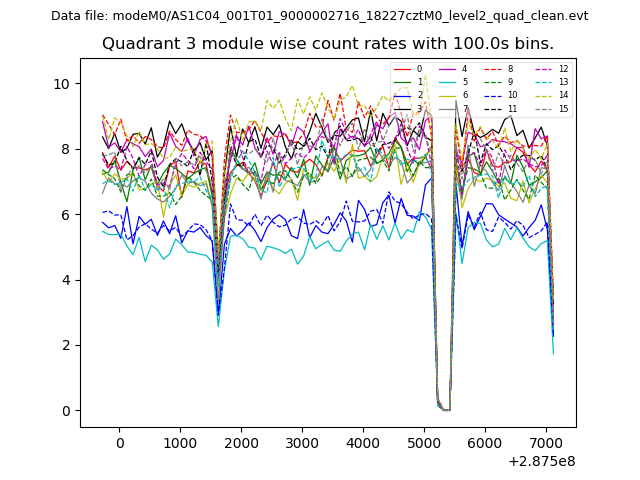 |
 |
| Parameter | Plot |
|---|---|
| CZT HV Monitor | 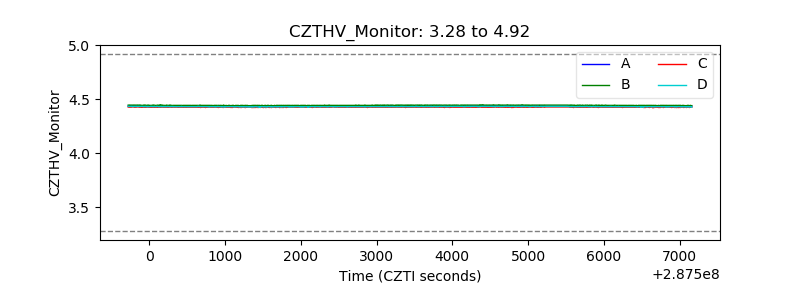 |
| D_VDD | 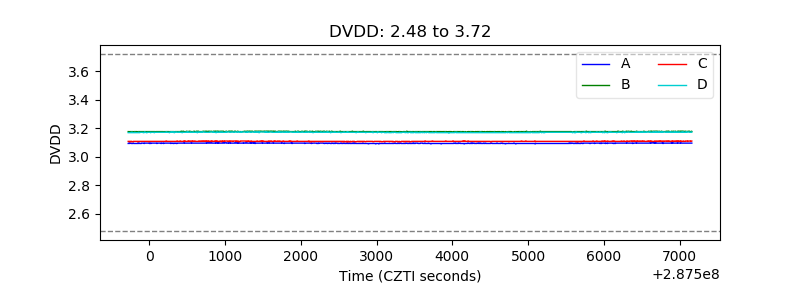 |
| Temperature 1 | 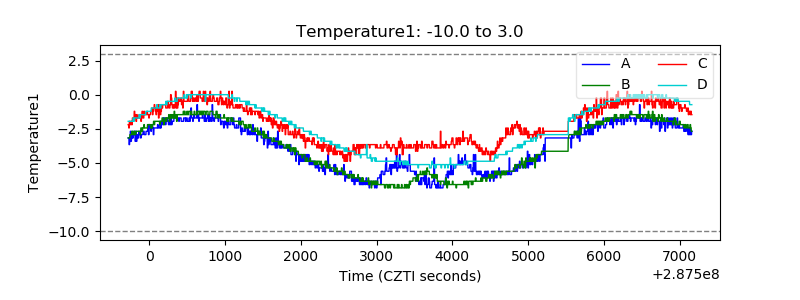 |
| Veto HV Monitor | 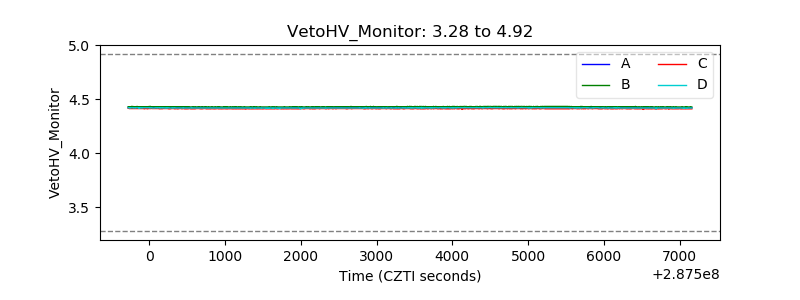 |
| Veto LLD | 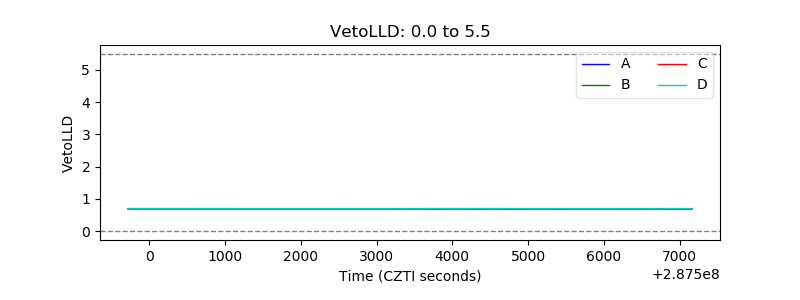 |
| Alpha Counter | 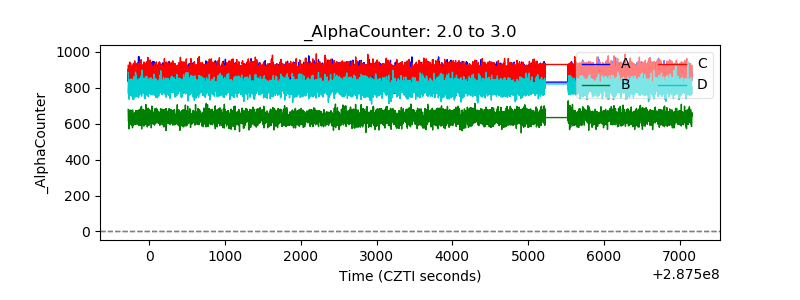 |
| _CPM_Rate | 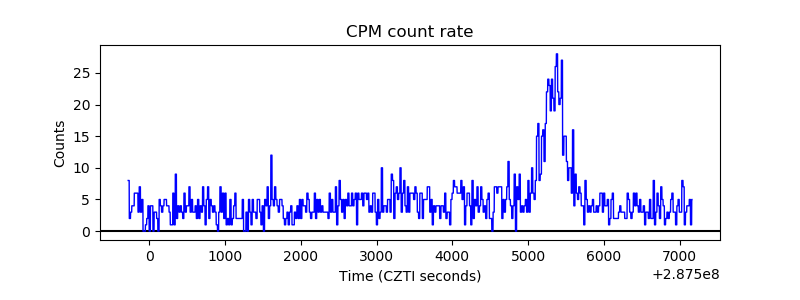 |
| CZT Counter |  |
| +2.5 Volts monitor |  |
| +5 Volts monitor |  |
| _ROLL_ROT | 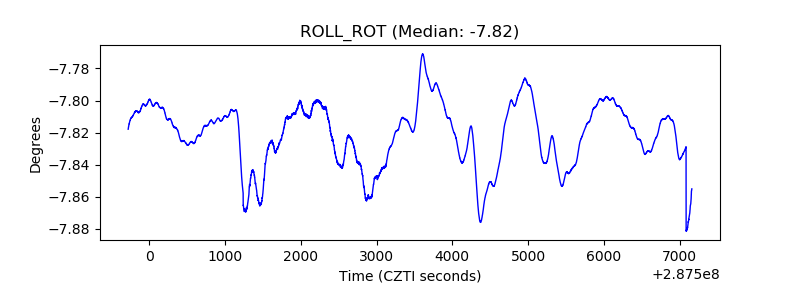 |
| _Roll_DEC | 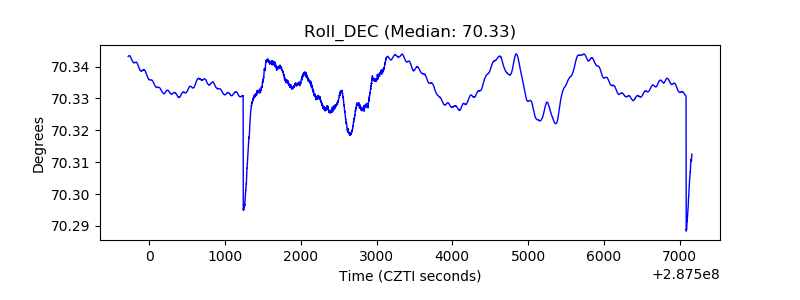 |
| _Roll_RA | 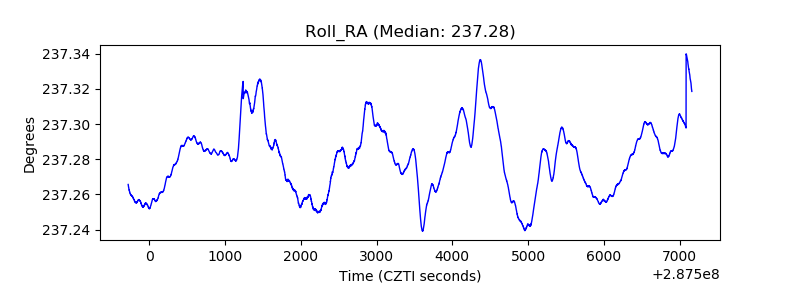 |
| Veto Counter | 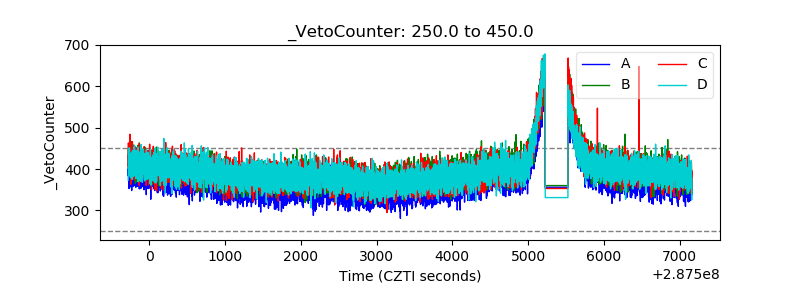 |