| Param | Original file | Final file |
|---|---|---|
| Filename | modeM0/AS1C04_001T01_9000002716_18228cztM0_level2.evt | modeM0/AS1C04_001T01_9000002716_18228cztM0_level2_quad_clean.evt |
| Size (bytes) | 510,396,480 | 122,639,040 |
| Size | 486.8 MB | 117.0 MB |
| Events in quadrant A | 3,747,860 | 819,387 |
| Events in quadrant B | 3,310,815 | 844,802 |
| Events in quadrant C | 3,092,619 | 800,858 |
| Events in quadrant D | 4,848,117 | 779,138 |
| Mode SS | |||
|---|---|---|---|
| Quadrant | BADHDUFLAG | Total packets | Discarded packets |
| A | 0 | 138 | 0 |
| B | 0 | 138 | 0 |
| C | 0 | 138 | 0 |
| D | 0 | 138 | 0 |
| Mode M9 | |||
|---|---|---|---|
| Quadrant | BADHDUFLAG | Total packets | Discarded packets |
| A | 0 | 1 | 0 |
| B | 0 | 1 | 0 |
| C | 0 | 1 | 0 |
| D | 0 | 1 | 0 |
| Mode M0 | |||
|---|---|---|---|
| Quadrant | BADHDUFLAG | Total packets | Discarded packets |
| A | 0 | 15764 | 1 |
| B | 0 | 14366 | 1 |
| C | 0 | 13716 | 1 |
| D | 0 | 19011 | 1 |
| Quadrant | Total seconds | Saturated seconds | Saturation percentage |
|---|---|---|---|
| A | 6739 | 355 | 5.267844% |
| B | 6740 | 116 | 1.721068% |
| C | 6740 | 98 | 1.454006% |
| D | 6740 | 244 | 3.620178% |
Noise dominated data is calculated using 1-second bins in cleaned event files. If a bin has >2000 counts, and if more than 50% of those come from <1% of pixels, then it is considered to be noise-dominated and hence unusable.
| Quadrant | # 1 sec bins | Bins with >0 counts | Bins with >2000 counts | High rate bins dominated by noise | Noise dominated (total time) | Noise dominated (detector-on time) | Marked lightcurve |
|---|---|---|---|---|---|---|---|
| A | 6919 | 6739 | 225 | 225 | 3.25% | 3.34% | 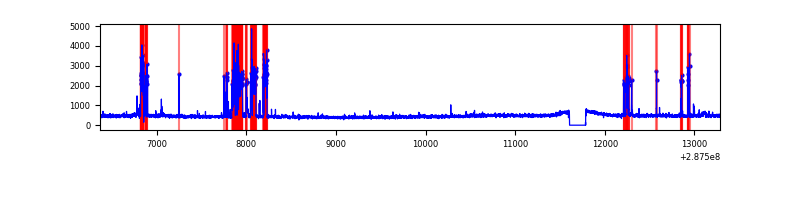 |
| B | 6920 | 6740 | 25 | 25 | 0.36% | 0.37% | 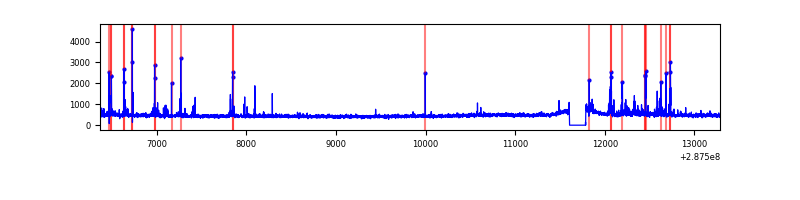 |
| C | 6920 | 6741 | 0 | 0 | 0.00% | 0.00% | 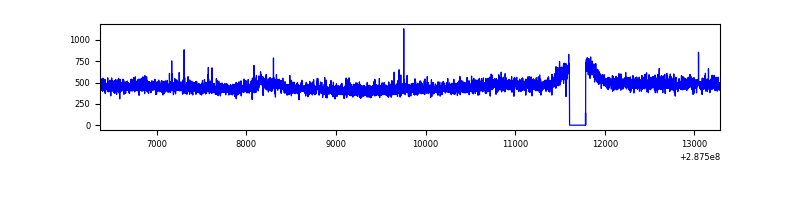 |
| D | 6920 | 6740 | 161 | 161 | 2.33% | 2.39% | 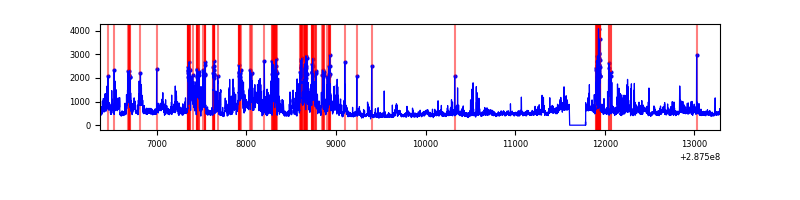 |
Top three noisy pixels from each quadrant. If the there are fewer than three noisy pixels in the level2.evt file, extra rows are filled as -1
| Pixel properties | Quadrant properties | ||||||
|---|---|---|---|---|---|---|---|
| Quadrant | DetID | PixID | Counts | Sigma | Mean | Median | Sigma |
| A | 15 | 174 | 766906 | 4908.37 | 773 | 756 | 156.1 |
| A | 11 | 29 | 7625 | 44.01 | 773 | 756 | 156.1 |
| A | 0 | 226 | 6725 | 38.24 | 773 | 756 | 156.1 |
| B | 7 | 220 | 128275 | 857.45 | 785 | 764 | 148.7 |
| B | 4 | 171 | 64555 | 428.96 | 785 | 764 | 148.7 |
| B | 12 | 111 | 17430 | 112.07 | 785 | 764 | 148.7 |
| C | 14 | 238 | 115106 | 645.31 | 753 | 754 | 177.2 |
| C | 3 | 233 | 19502 | 105.8 | 753 | 754 | 177.2 |
| C | 7 | 174 | 17868 | 96.58 | 753 | 754 | 177.2 |
| D | 5 | 222 | 1011655 | 5441.71 | 758 | 734 | 185.8 |
| D | 7 | 238 | 408786 | 2196.51 | 758 | 734 | 185.8 |
| D | 1 | 52 | 268688 | 1442.38 | 758 | 734 | 185.8 |
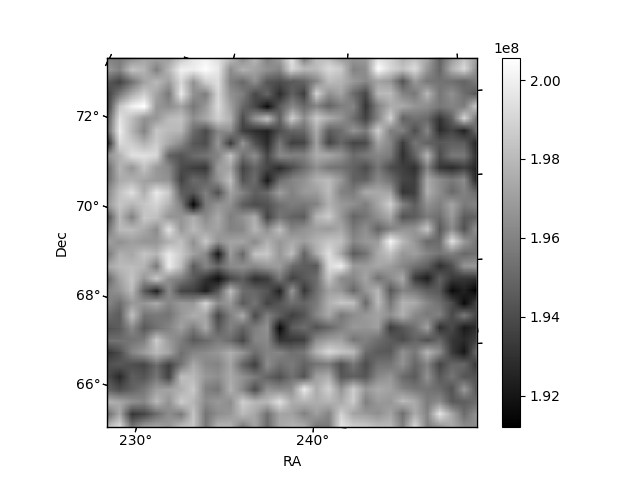
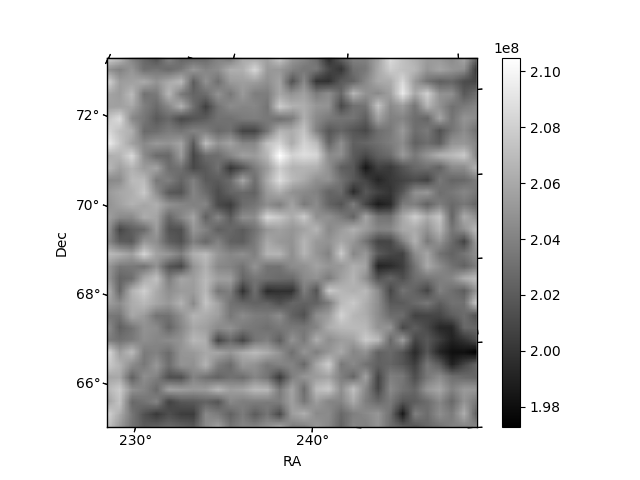
Histogram calculated using DETX and DETY for each event in the final _common_clean file
| Quadrant A |  |
 |
Quadrant B |
|---|---|---|---|
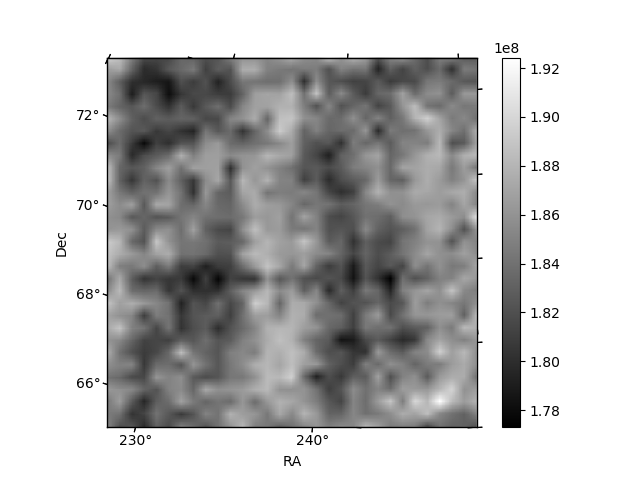
| Quadrant D | 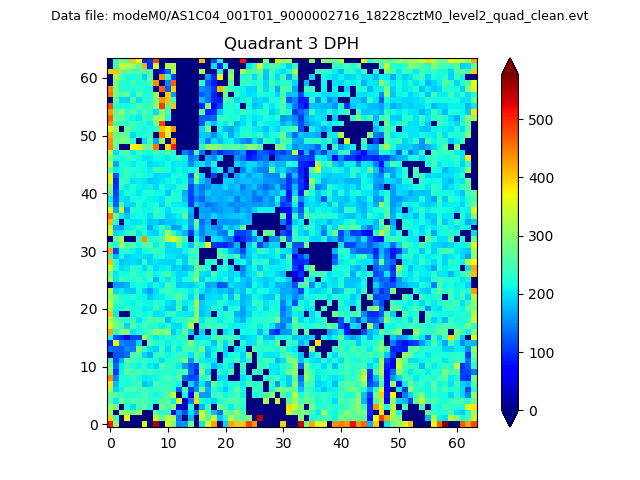 |
 |
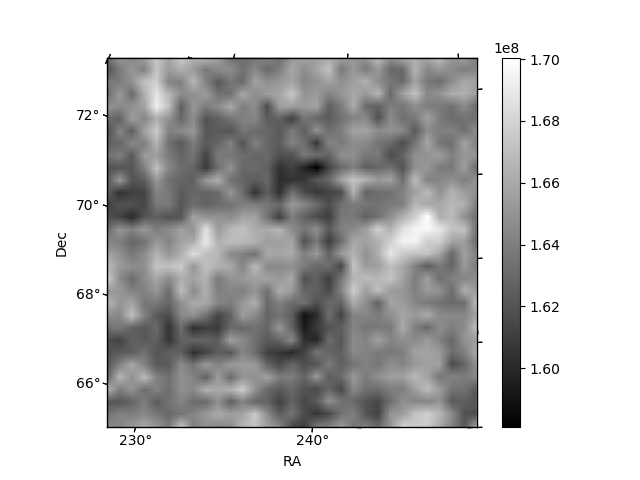
Quadrant C |
| Plot type | Count rate plots | Images |
|---|---|---|
| Comparison with Poisson distribution Blue bars denote a histogram of data divided into 1 sec bins. Red curve is a Poisson curve with rate = median count rate of data. |
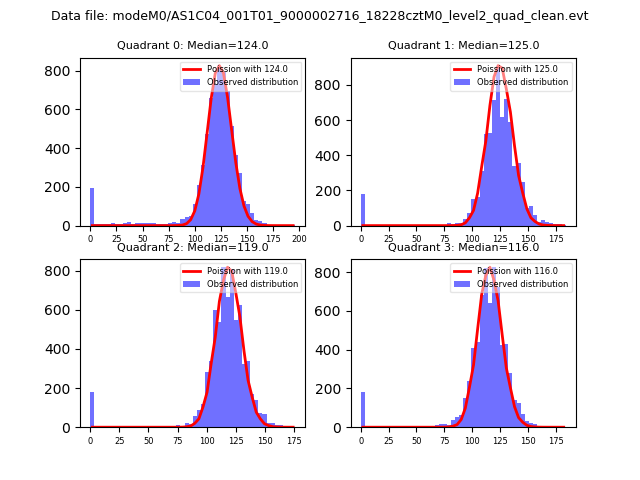 |
 |
| Quadrant-wise count rates Data is divided into 100 sec bins |
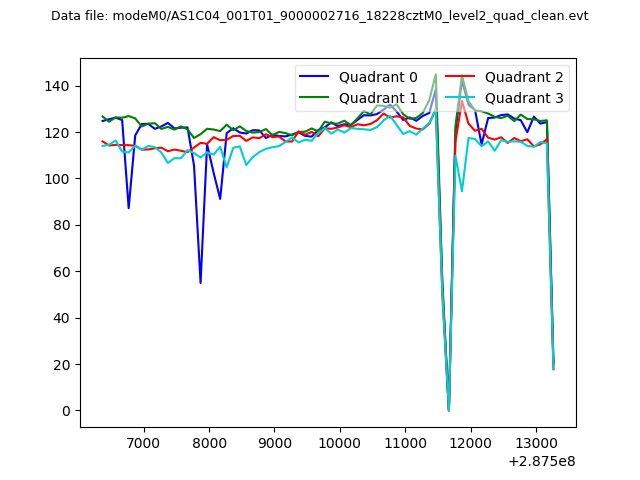 |
|
| Module-wise count rates for Quadrant A Data is divided into 100 sec bins |
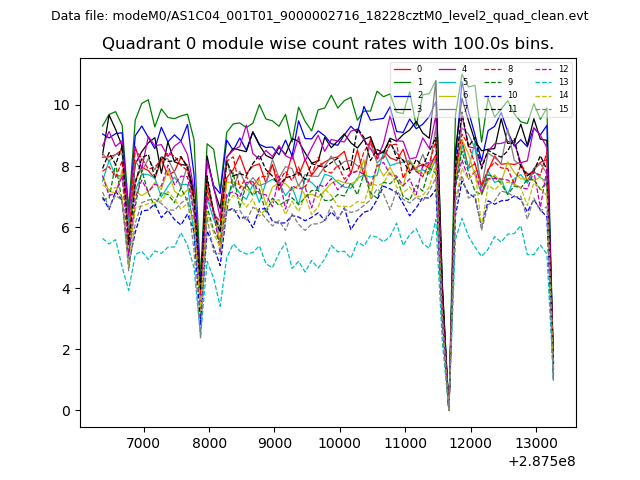 |
 |
| Module-wise count rates for Quadrant B Data is divided into 100 sec bins |
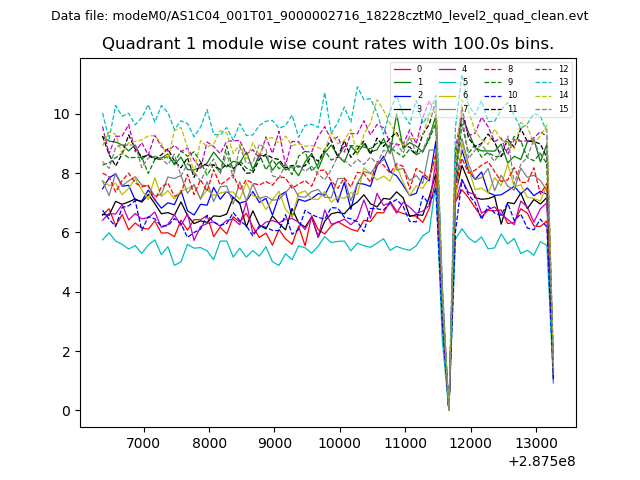 |
 |
| Module-wise count rates for Quadrant C Data is divided into 100 sec bins |
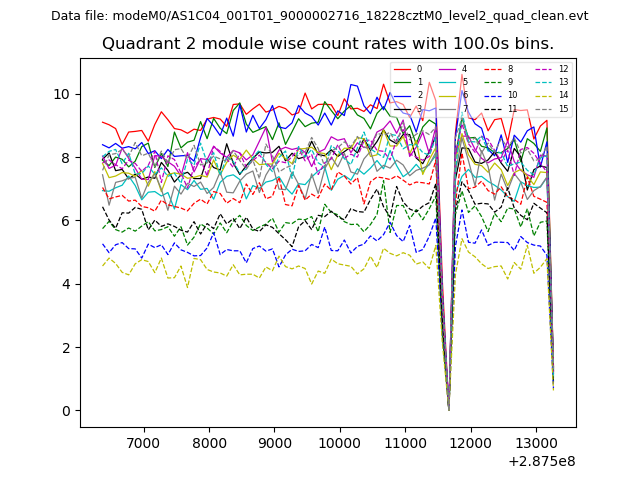 |
 |
| Module-wise count rates for Quadrant D Data is divided into 100 sec bins |
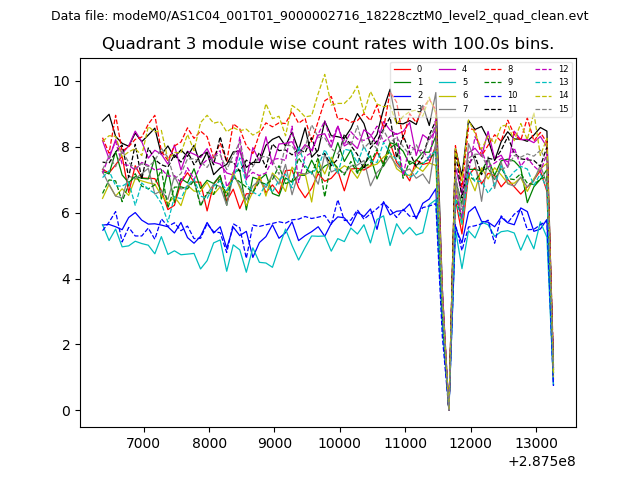 |
 |
| Parameter | Plot |
|---|---|
| CZT HV Monitor | 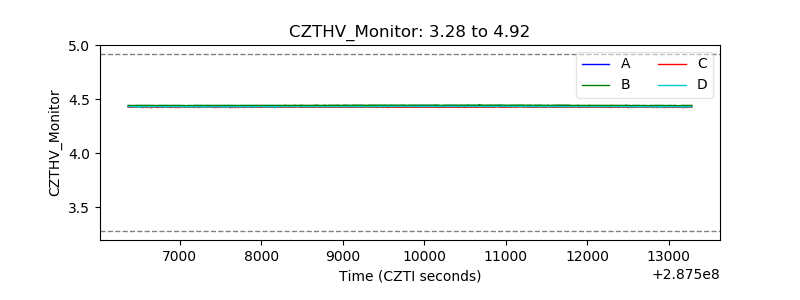 |
| D_VDD | 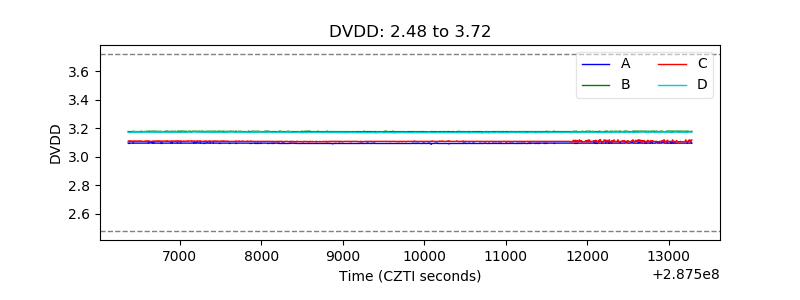 |
| Temperature 1 |  |
| Veto HV Monitor | 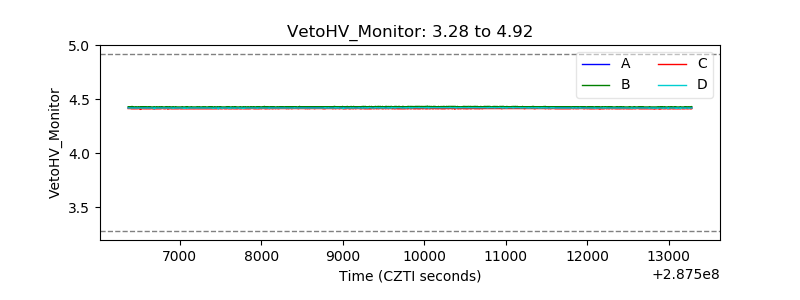 |
| Veto LLD |  |
| Alpha Counter | 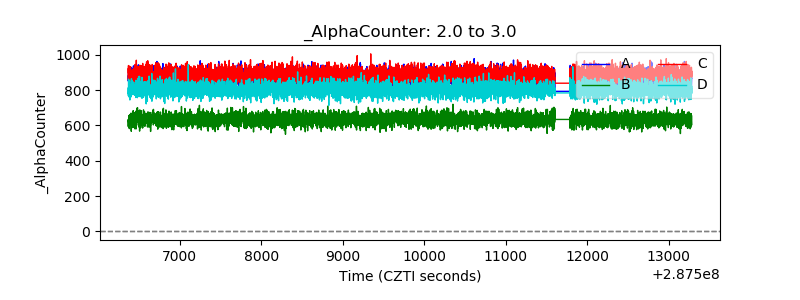 |
| _CPM_Rate | 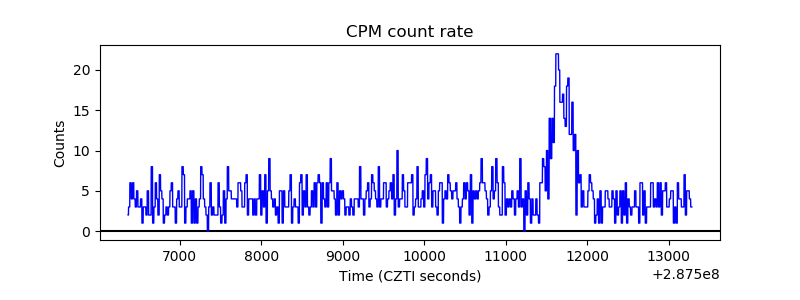 |
| CZT Counter |  |
| +2.5 Volts monitor |  |
| +5 Volts monitor | 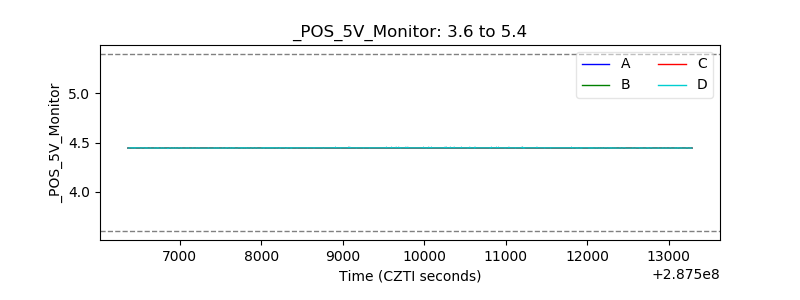 |
| _ROLL_ROT | 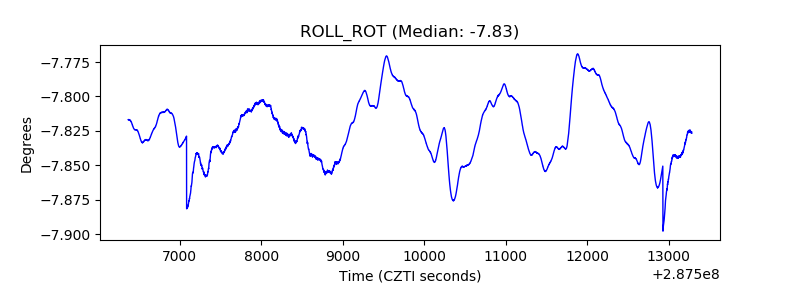 |
| _Roll_DEC | 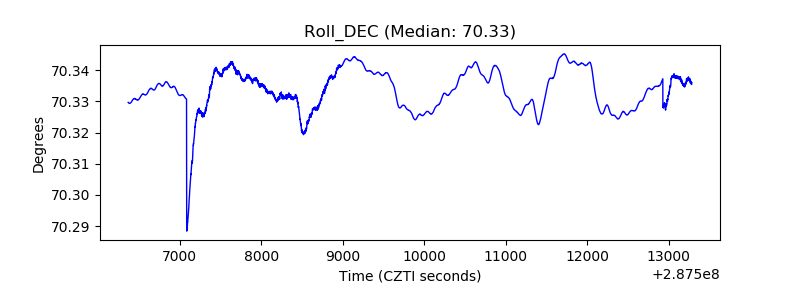 |
| _Roll_RA | 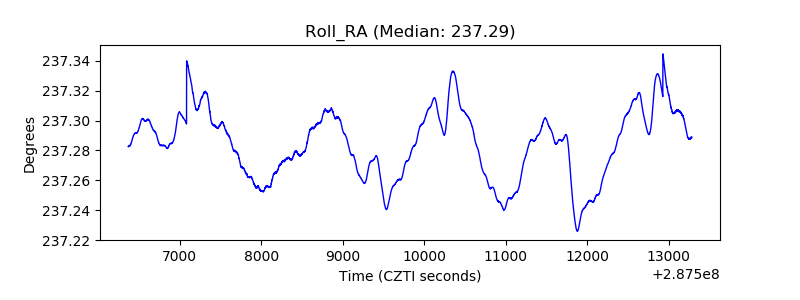 |
| Veto Counter |  |