| Param | Original file | Final file |
|---|---|---|
| Filename | modeM0/AS1C04_001T01_9000002716_18229cztM0_level2.evt | modeM0/AS1C04_001T01_9000002716_18229cztM0_level2_quad_clean.evt |
| Size (bytes) | 522,233,280 | 129,965,760 |
| Size | 498.0 MB | 123.9 MB |
| Events in quadrant A | 4,290,172 | 863,233 |
| Events in quadrant B | 3,444,938 | 890,853 |
| Events in quadrant C | 3,315,750 | 847,110 |
| Events in quadrant D | 4,279,277 | 836,876 |
| Mode SS | |||
|---|---|---|---|
| Quadrant | BADHDUFLAG | Total packets | Discarded packets |
| A | 0 | 146 | 0 |
| B | 0 | 146 | 0 |
| C | 0 | 146 | 0 |
| D | 0 | 146 | 0 |
| Mode M9 | |||
|---|---|---|---|
| Quadrant | BADHDUFLAG | Total packets | Discarded packets |
| A | 0 | 3 | 0 |
| B | 0 | 3 | 0 |
| C | 0 | 3 | 0 |
| D | 0 | 3 | 0 |
| Mode M0 | |||
|---|---|---|---|
| Quadrant | BADHDUFLAG | Total packets | Discarded packets |
| A | 0 | 17628 | 1 |
| B | 0 | 14984 | 1 |
| C | 0 | 14478 | 1 |
| D | 0 | 17550 | 1 |
| Quadrant | Total seconds | Saturated seconds | Saturation percentage |
|---|---|---|---|
| A | 7151 | 353 | 4.936373% |
| B | 7152 | 52 | 0.727069% |
| C | 7152 | 71 | 0.992729% |
| D | 7152 | 99 | 1.384228% |
Noise dominated data is calculated using 1-second bins in cleaned event files. If a bin has >2000 counts, and if more than 50% of those come from <1% of pixels, then it is considered to be noise-dominated and hence unusable.
| Quadrant | # 1 sec bins | Bins with >0 counts | Bins with >2000 counts | High rate bins dominated by noise | Noise dominated (total time) | Noise dominated (detector-on time) | Marked lightcurve |
|---|---|---|---|---|---|---|---|
| A | 7521 | 7152 | 215 | 215 | 2.86% | 3.01% | 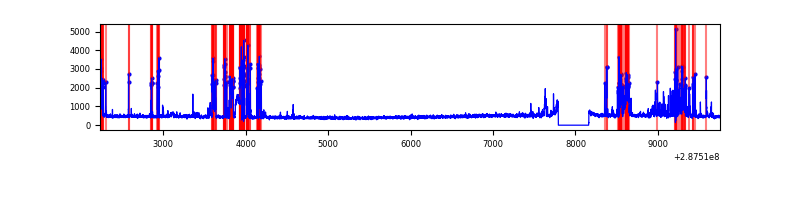 |
| B | 7522 | 7153 | 14 | 14 | 0.19% | 0.20% | 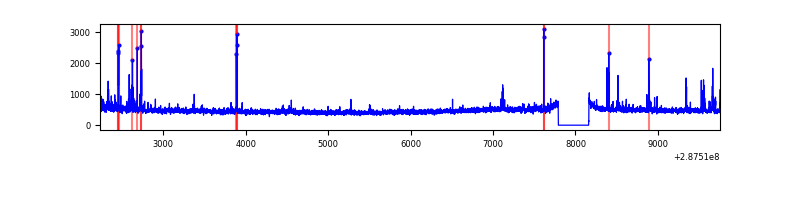 |
| C | 7522 | 7153 | 0 | 0 | 0.00% | 0.00% | 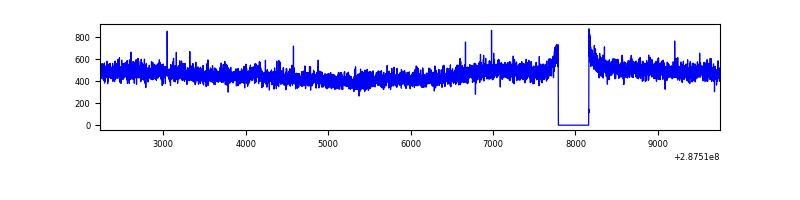 |
| D | 7522 | 7153 | 46 | 46 | 0.61% | 0.64% | 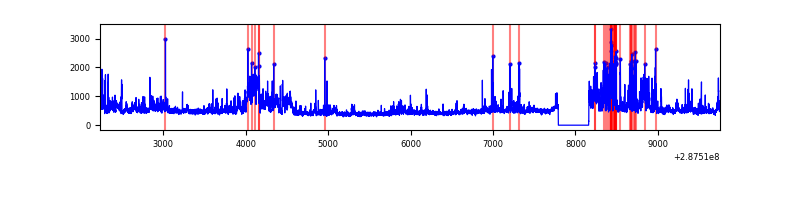 |
Top three noisy pixels from each quadrant. If the there are fewer than three noisy pixels in the level2.evt file, extra rows are filled as -1
| Pixel properties | Quadrant properties | ||||||
|---|---|---|---|---|---|---|---|
| Quadrant | DetID | PixID | Counts | Sigma | Mean | Median | Sigma |
| A | 15 | 174 | 1136359 | 6848.67 | 817 | 799 | 165.8 |
| A | 0 | 226 | 7073 | 37.84 | 817 | 799 | 165.8 |
| A | 12 | 194 | 6126 | 32.12 | 817 | 799 | 165.8 |
| B | 7 | 220 | 96750 | 606.0 | 831 | 810 | 158.3 |
| B | 4 | 171 | 49199 | 305.65 | 831 | 810 | 158.3 |
| B | 0 | 197 | 21589 | 131.25 | 831 | 810 | 158.3 |
| C | 14 | 238 | 123362 | 659.54 | 798 | 801 | 185.8 |
| C | 3 | 233 | 56750 | 301.08 | 798 | 801 | 185.8 |
| C | 8 | 128 | 9428 | 46.42 | 798 | 801 | 185.8 |
| D | 7 | 238 | 474391 | 2394.6 | 810 | 784 | 197.8 |
| D | 5 | 222 | 409455 | 2066.28 | 810 | 784 | 197.8 |
| D | 7 | 38 | 70154 | 350.74 | 810 | 784 | 197.8 |
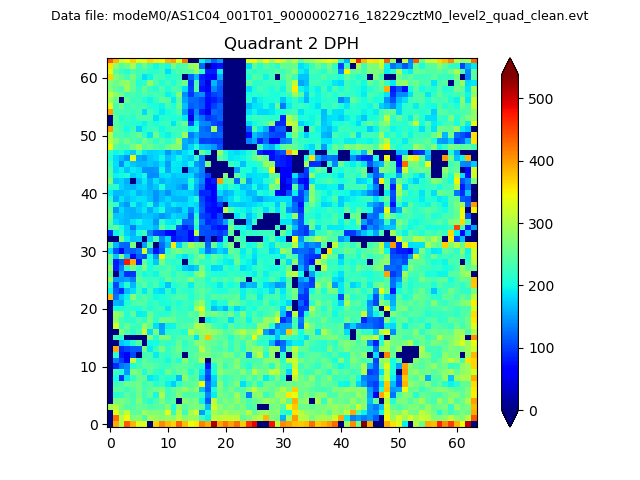
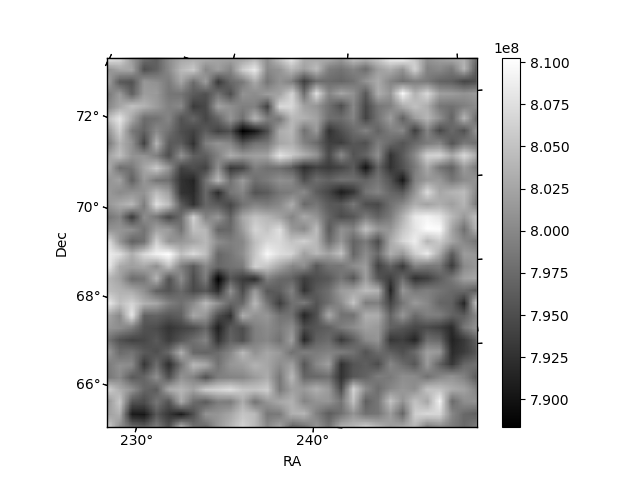
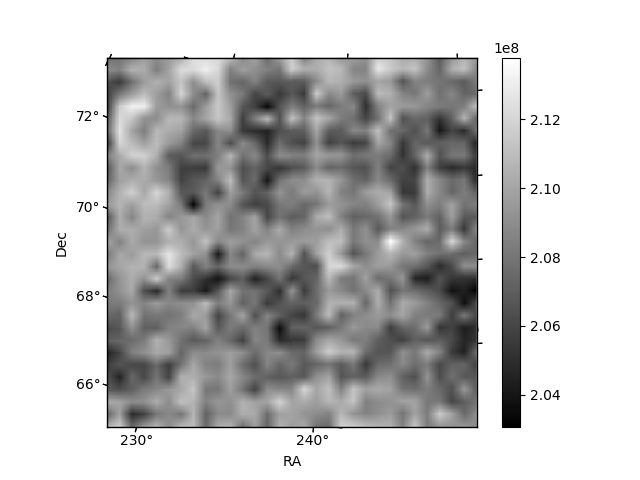
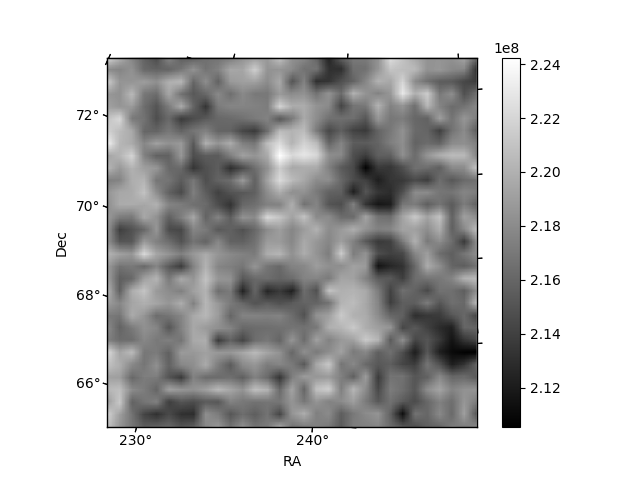
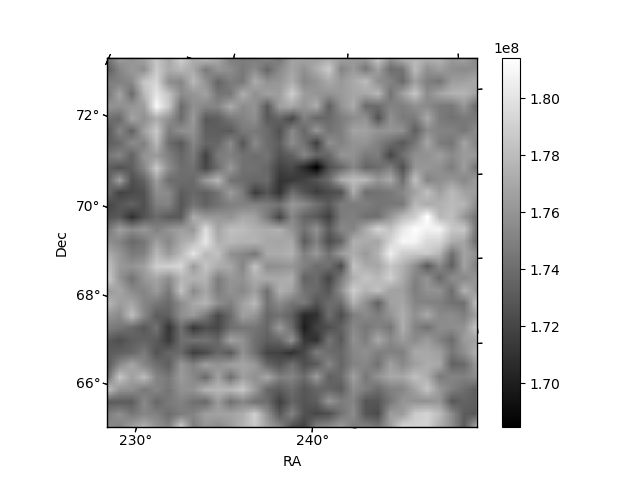
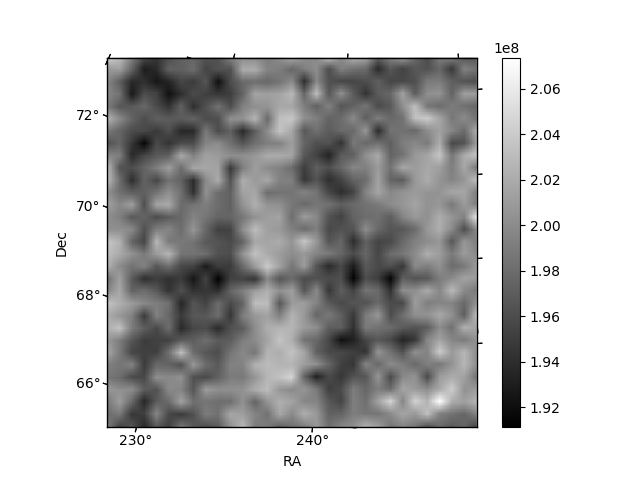
Histogram calculated using DETX and DETY for each event in the final _common_clean file
| Quadrant A | 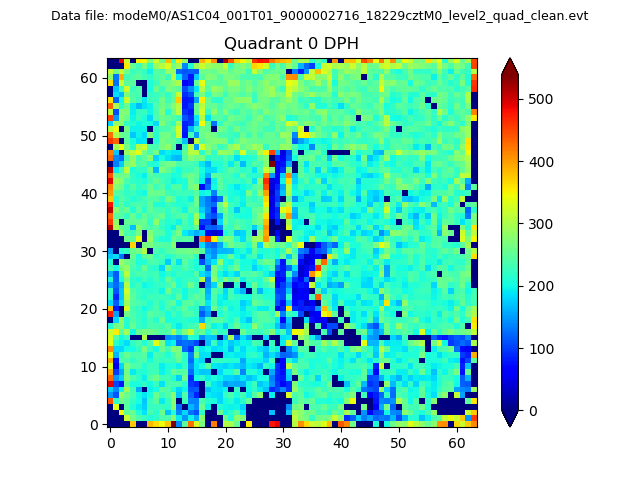 |
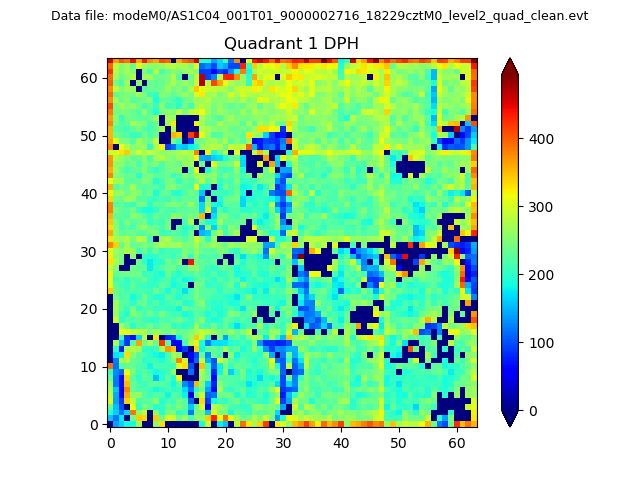 |
Quadrant B |
|---|---|---|---|
| Quadrant D | 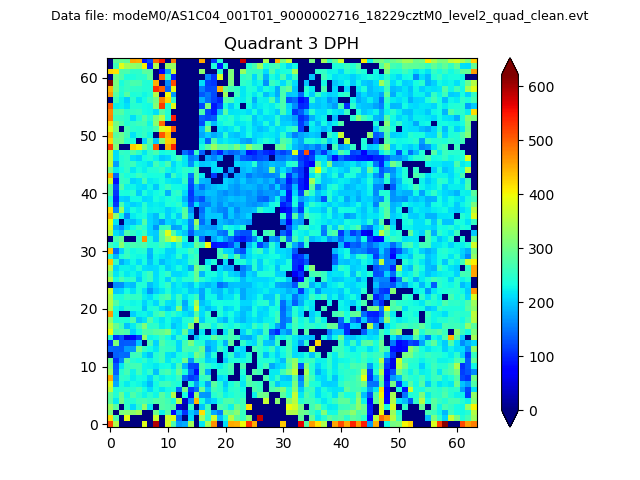 |
 |
Quadrant C |
| Plot type | Count rate plots | Images |
|---|---|---|
| Comparison with Poisson distribution Blue bars denote a histogram of data divided into 1 sec bins. Red curve is a Poisson curve with rate = median count rate of data. |
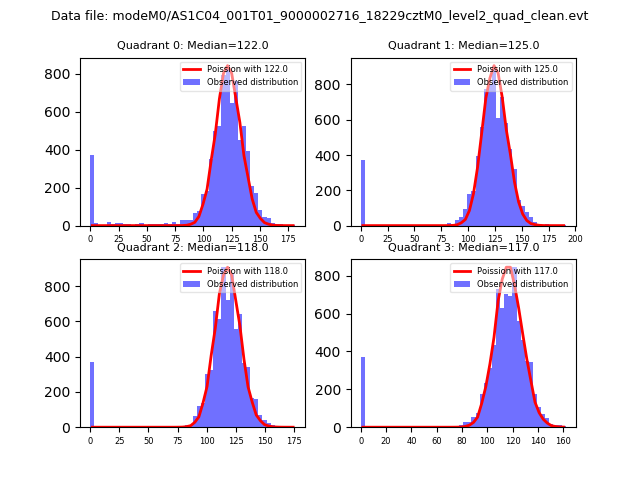 |
 |
| Quadrant-wise count rates Data is divided into 100 sec bins |
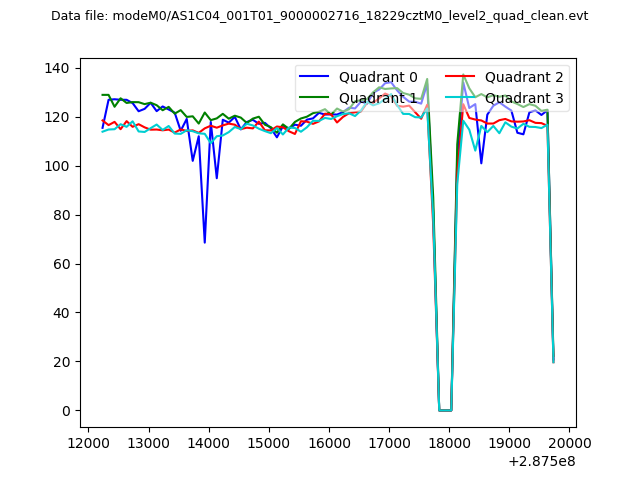 |
|
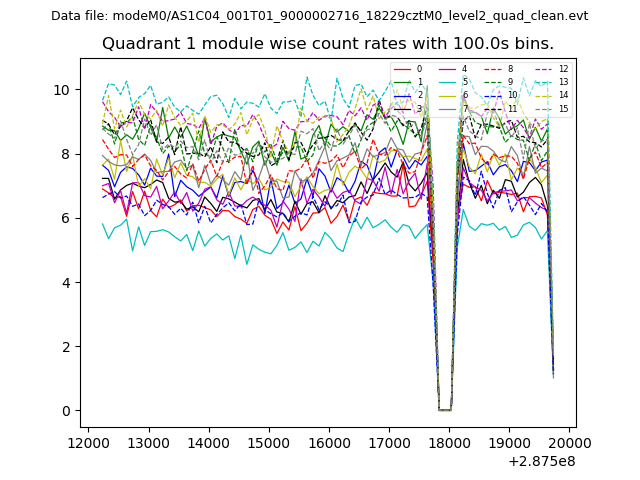
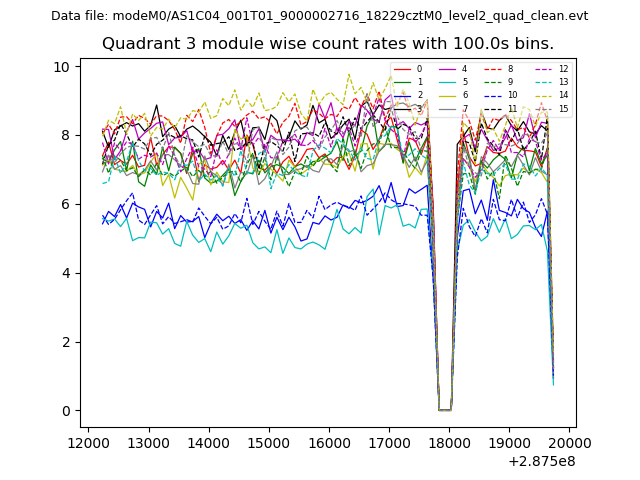
| Module-wise count rates for Quadrant A Data is divided into 100 sec bins |
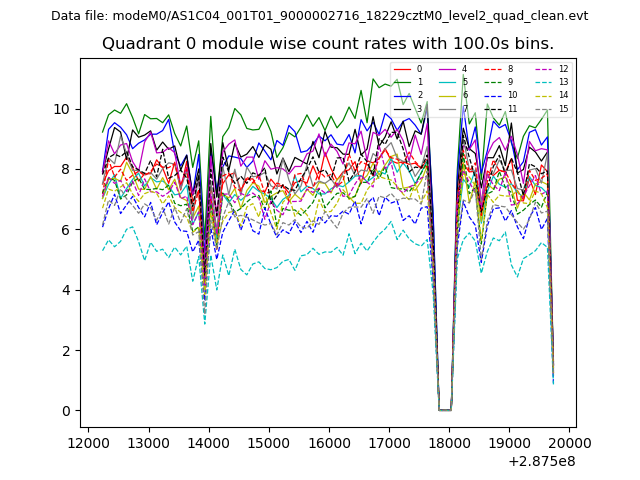 |
 |
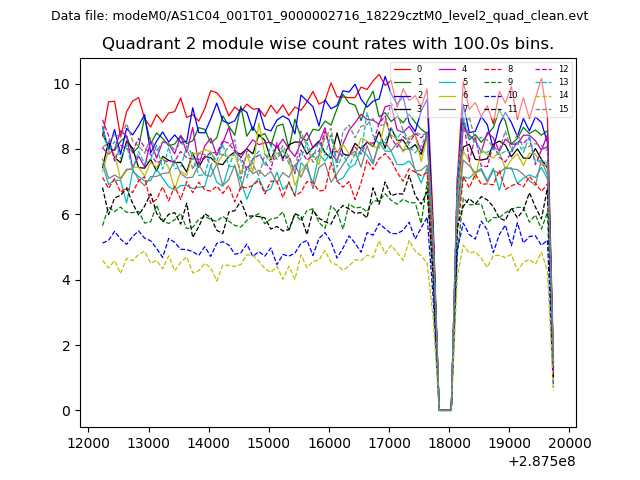
| Module-wise count rates for Quadrant B Data is divided into 100 sec bins |
 |
 |
| Module-wise count rates for Quadrant C Data is divided into 100 sec bins |
 |
 |
| Module-wise count rates for Quadrant D Data is divided into 100 sec bins |
 |
 |
| Parameter | Plot |
|---|---|
| CZT HV Monitor | 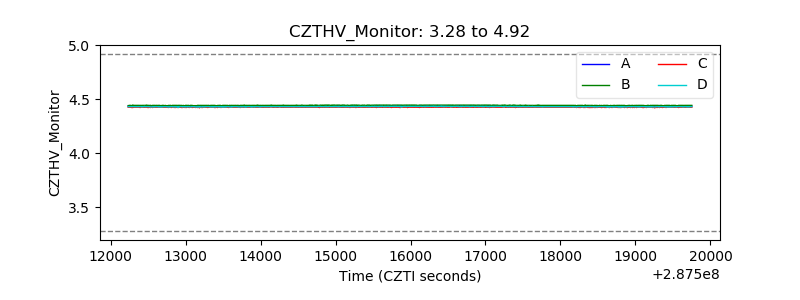 |
| D_VDD | 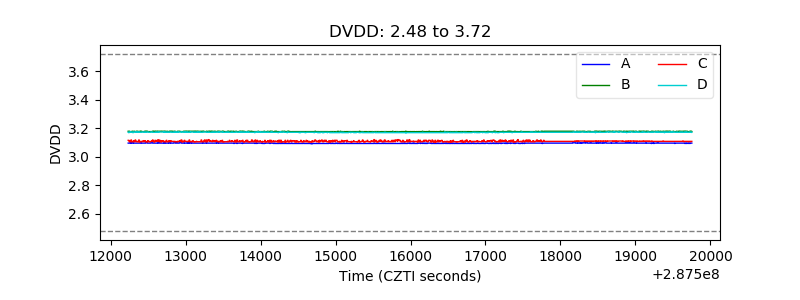 |
| Temperature 1 | 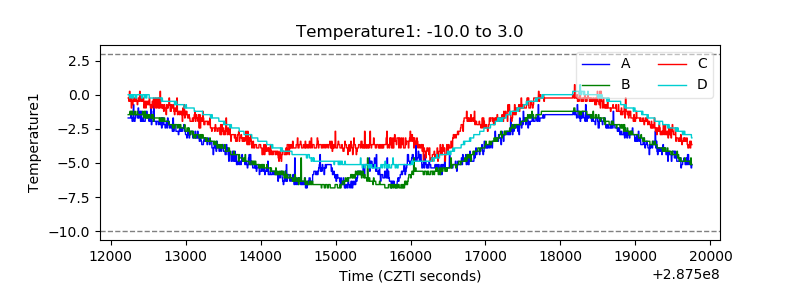 |
| Veto HV Monitor |  |
| Veto LLD | 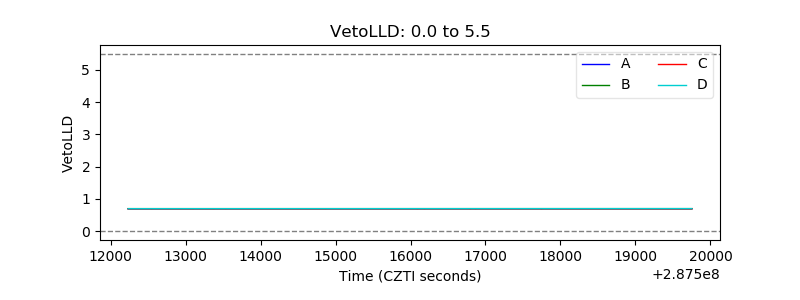 |
| Alpha Counter | 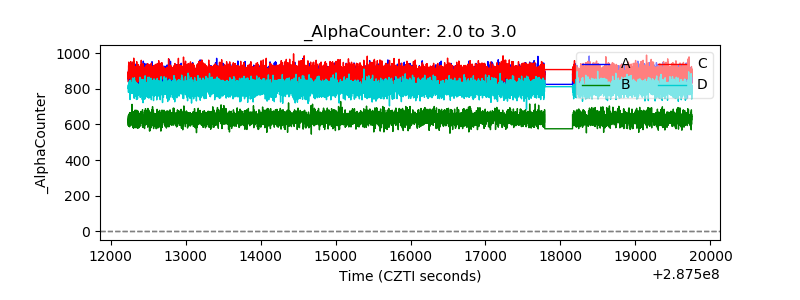 |
| _CPM_Rate | 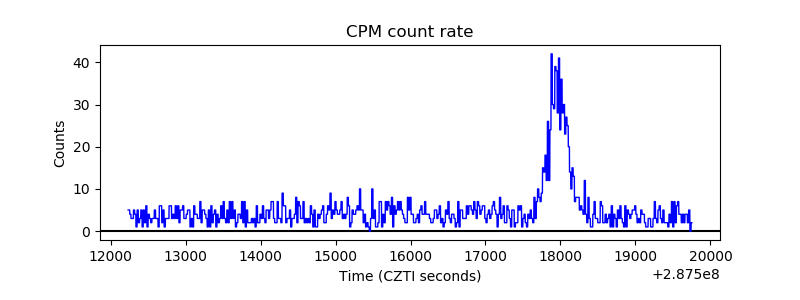 |
| CZT Counter | 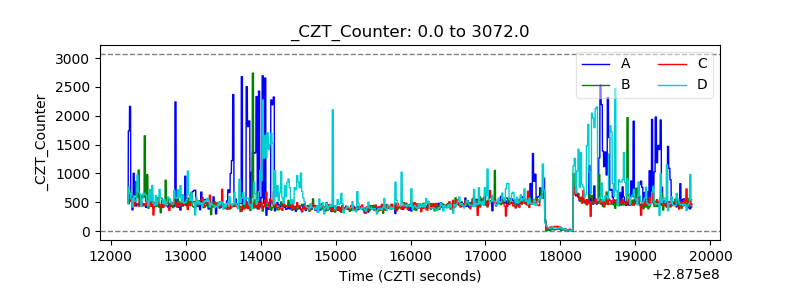 |
| +2.5 Volts monitor | 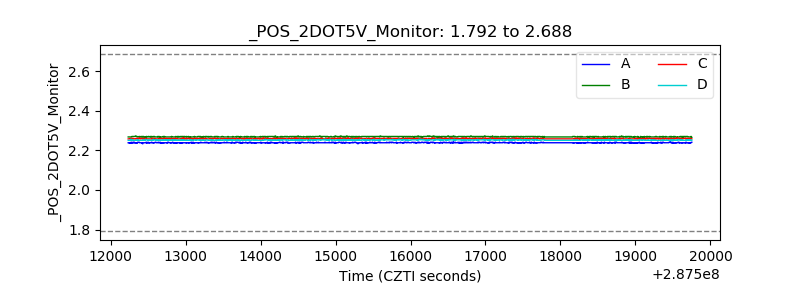 |
| +5 Volts monitor |  |
| _ROLL_ROT | 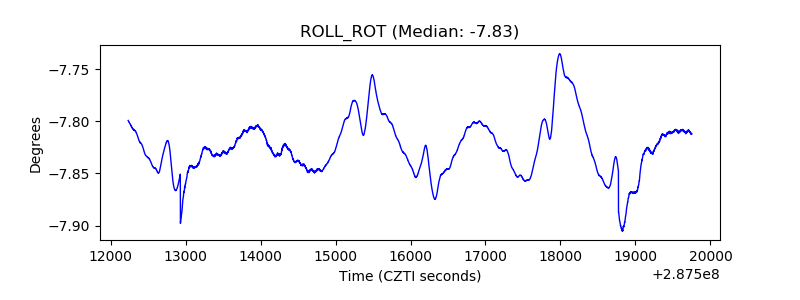 |
| _Roll_DEC | 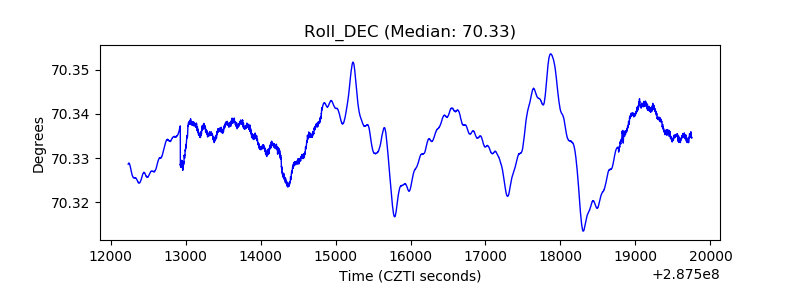 |
| _Roll_RA | 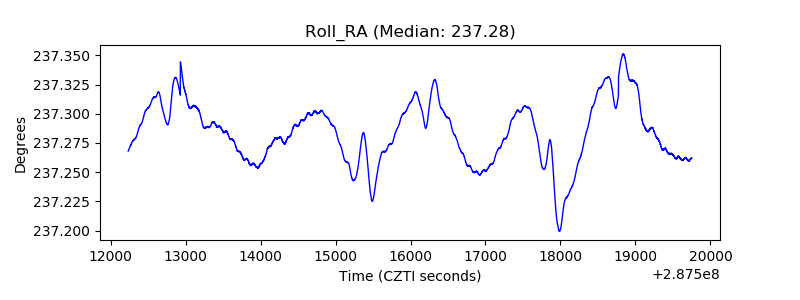 |
| Veto Counter | 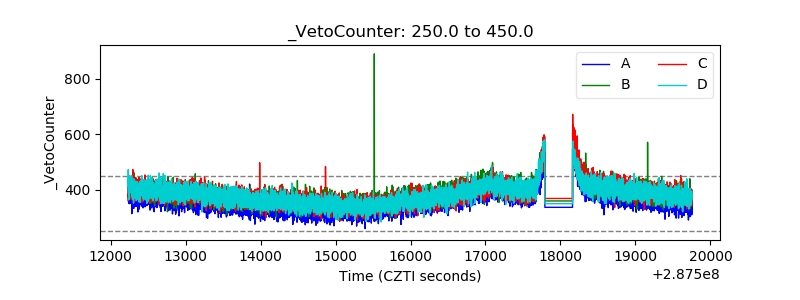 |