| Param | Original file | Final file |
|---|---|---|
| Filename | modeM0/AS1C04_001T01_9000002716_18231cztM0_level2.evt | modeM0/AS1C04_001T01_9000002716_18231cztM0_level2_quad_clean.evt |
| Size (bytes) | 1,026,296,640 | 229,714,560 |
| Size | 978.8 MB | 219.1 MB |
| Events in quadrant A | 6,361,612 | 1,574,004 |
| Events in quadrant B | 6,008,481 | 1,598,503 |
| Events in quadrant C | 5,994,747 | 1,541,876 |
| Events in quadrant D | 11,844,019 | 1,351,175 |
| Mode SS | |||
|---|---|---|---|
| Quadrant | BADHDUFLAG | Total packets | Discarded packets |
| A | 0 | 260 | 0 |
| B | 0 | 260 | 0 |
| C | 0 | 260 | 0 |
| D | 0 | 260 | 0 |
| Mode M9 | |||
|---|---|---|---|
| Quadrant | BADHDUFLAG | Total packets | Discarded packets |
| A | 0 | 13 | 0 |
| B | 0 | 13 | 0 |
| C | 0 | 13 | 0 |
| D | 0 | 13 | 0 |
| Mode M0 | |||
|---|---|---|---|
| Quadrant | BADHDUFLAG | Total packets | Discarded packets |
| A | 0 | 27916 | 2 |
| B | 0 | 26644 | 2 |
| C | 0 | 26343 | 2 |
| D | 0 | 44193 | 2 |
| Quadrant | Total seconds | Saturated seconds | Saturation percentage |
|---|---|---|---|
| A | 12910 | 198 | 1.533695% |
| B | 12910 | 89 | 0.689388% |
| C | 12910 | 119 | 0.921766% |
| D | 12911 | 1858 | 14.390830% |
Noise dominated data is calculated using 1-second bins in cleaned event files. If a bin has >2000 counts, and if more than 50% of those come from <1% of pixels, then it is considered to be noise-dominated and hence unusable.
| Quadrant | # 1 sec bins | Bins with >0 counts | Bins with >2000 counts | High rate bins dominated by noise | Noise dominated (total time) | Noise dominated (detector-on time) | Marked lightcurve |
|---|---|---|---|---|---|---|---|
| A | 14135 | 12912 | 76 | 76 | 0.54% | 0.59% | 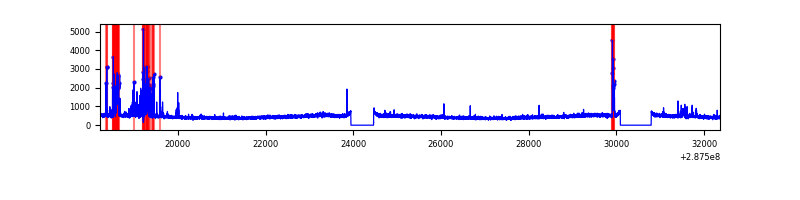 |
| B | 14135 | 12912 | 14 | 14 | 0.10% | 0.11% | 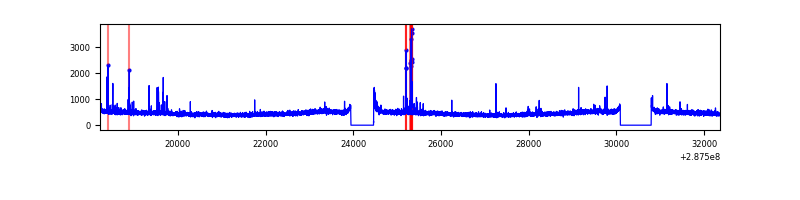 |
| C | 14135 | 12912 | 0 | 0 | 0.00% | 0.00% | 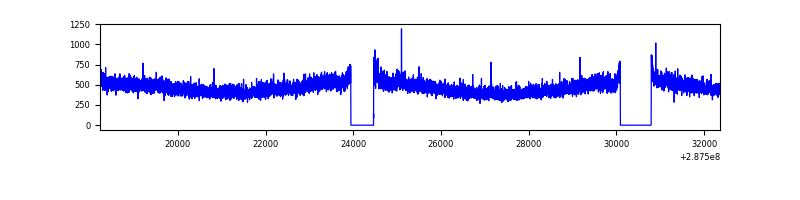 |
| D | 14136 | 12913 | 1624 | 1624 | 11.49% | 12.58% | 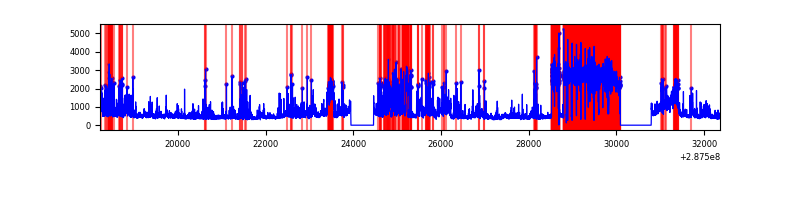 |
Top three noisy pixels from each quadrant. If the there are fewer than three noisy pixels in the level2.evt file, extra rows are filled as -1
| Pixel properties | Quadrant properties | ||||||
|---|---|---|---|---|---|---|---|
| Quadrant | DetID | PixID | Counts | Sigma | Mean | Median | Sigma |
| A | 15 | 174 | 619184 | 2043.8 | 1490 | 1455 | 302.2 |
| A | 0 | 226 | 12914 | 37.91 | 1490 | 1455 | 302.2 |
| A | 3 | 137 | 11464 | 33.12 | 1490 | 1455 | 302.2 |
| B | 7 | 220 | 86788 | 300.46 | 1494 | 1454 | 284.0 |
| B | 12 | 111 | 33818 | 113.95 | 1494 | 1454 | 284.0 |
| B | 0 | 197 | 32863 | 110.59 | 1494 | 1454 | 284.0 |
| C | 14 | 238 | 222368 | 658.79 | 1440 | 1446 | 335.3 |
| C | 3 | 233 | 153804 | 454.33 | 1440 | 1446 | 335.3 |
| C | 13 | 61 | 10281 | 26.35 | 1440 | 1446 | 335.3 |
| D | 7 | 238 | 4706194 | 14751.76 | 1313 | 1274 | 318.9 |
| D | 5 | 222 | 1040159 | 3257.31 | 1313 | 1274 | 318.9 |
| D | 13 | 168 | 527511 | 1649.96 | 1313 | 1274 | 318.9 |
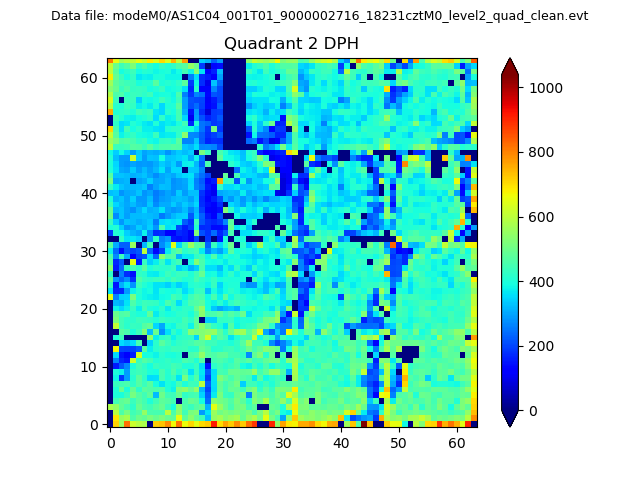
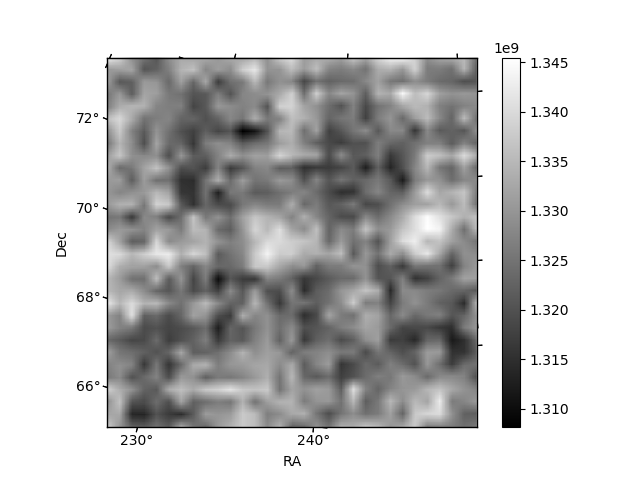
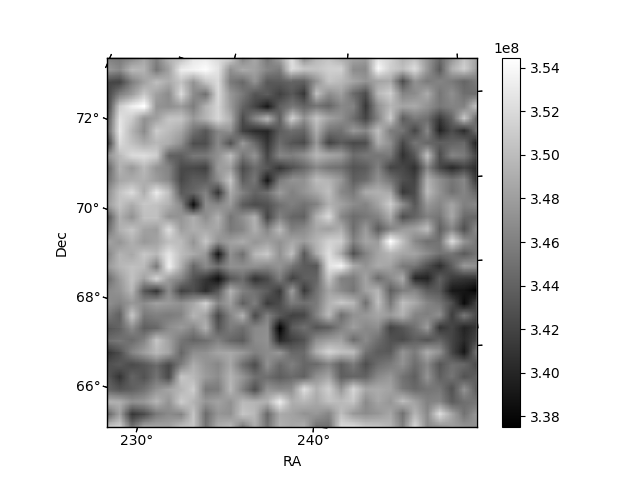
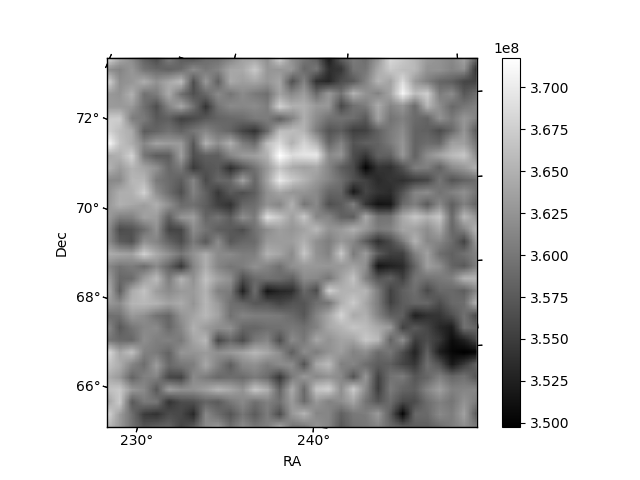
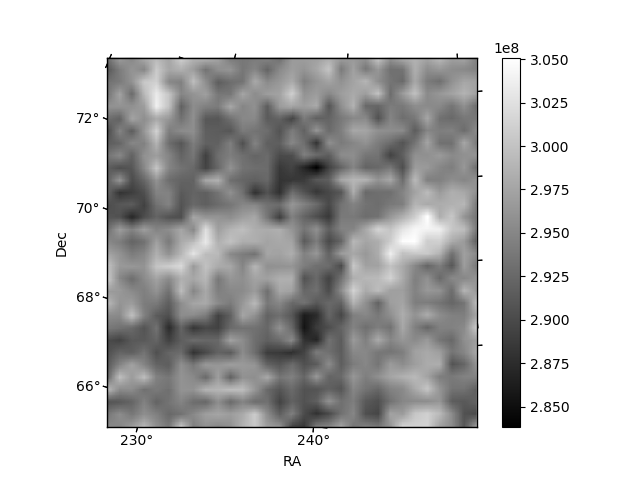
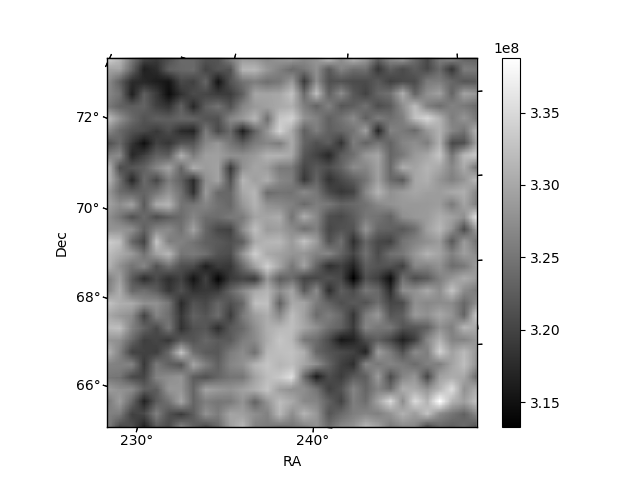
Histogram calculated using DETX and DETY for each event in the final _common_clean file
| Quadrant A | 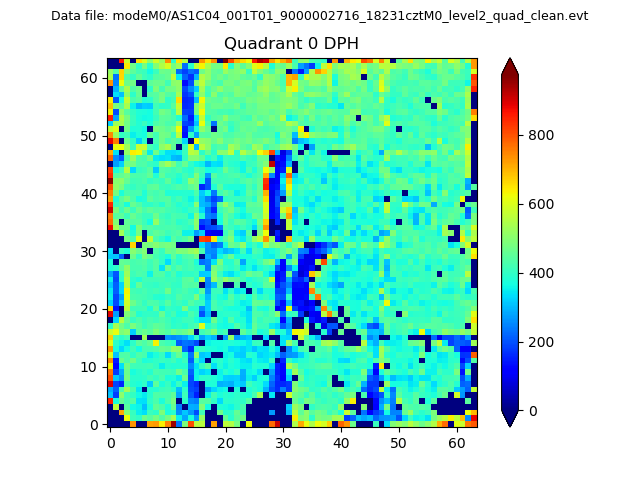 |
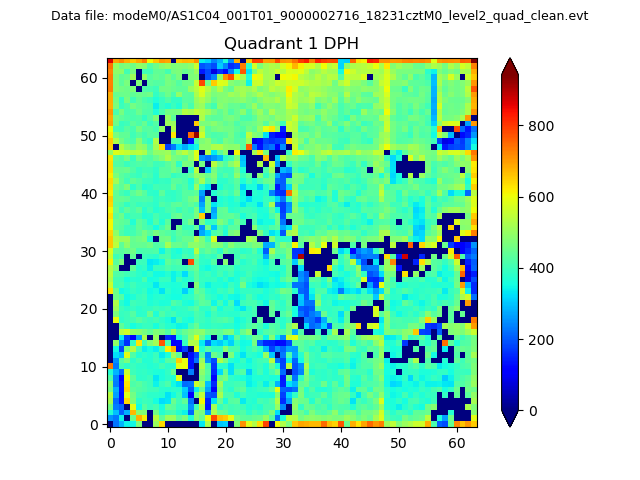 |
Quadrant B |
|---|---|---|---|
| Quadrant D | 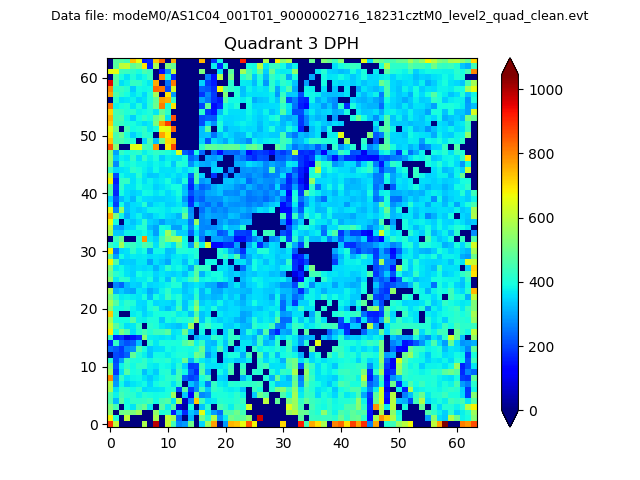 |
 |
Quadrant C |
| Plot type | Count rate plots | Images |
|---|---|---|
| Comparison with Poisson distribution Blue bars denote a histogram of data divided into 1 sec bins. Red curve is a Poisson curve with rate = median count rate of data. |
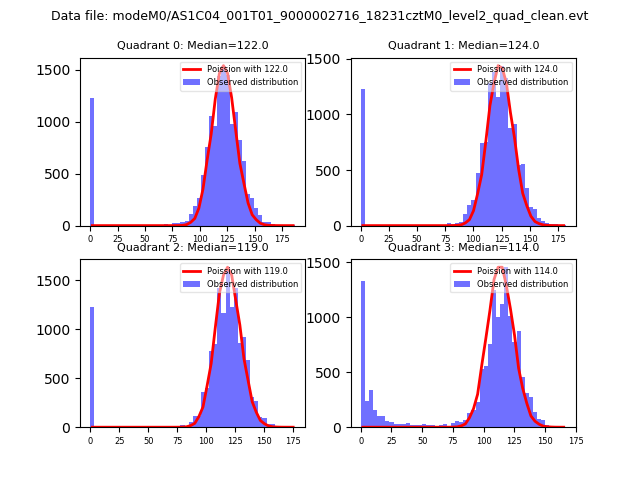 |
 |
| Quadrant-wise count rates Data is divided into 100 sec bins |
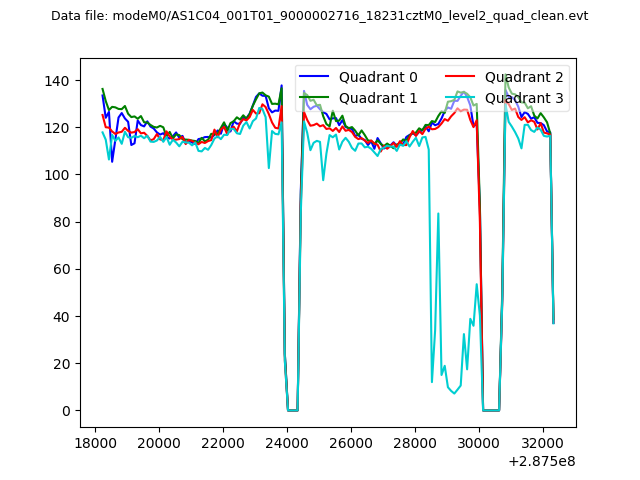 |
|
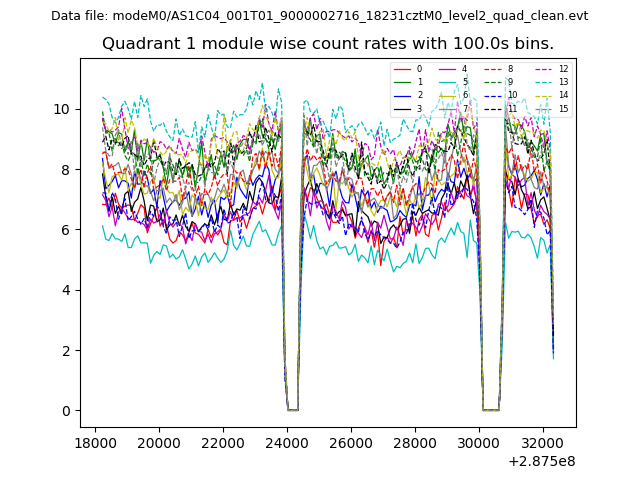
| Module-wise count rates for Quadrant A Data is divided into 100 sec bins |
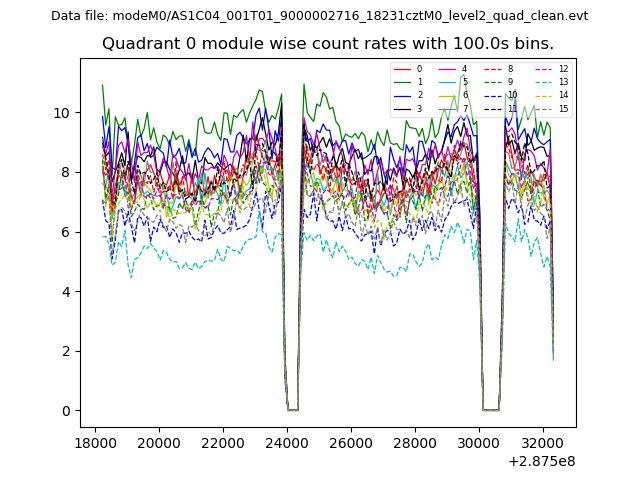 |
 |
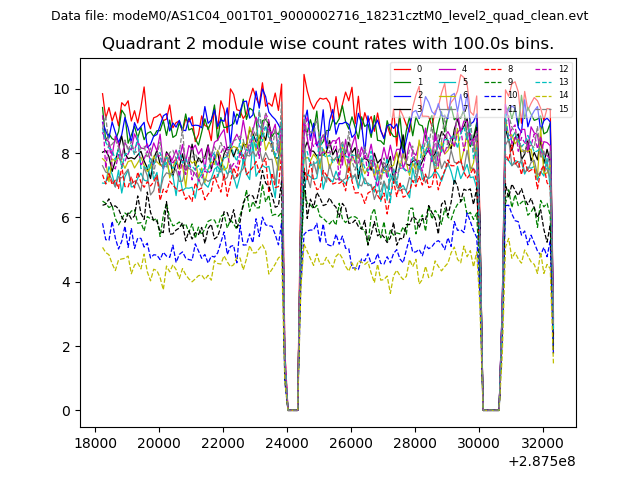
| Module-wise count rates for Quadrant B Data is divided into 100 sec bins |
 |
 |
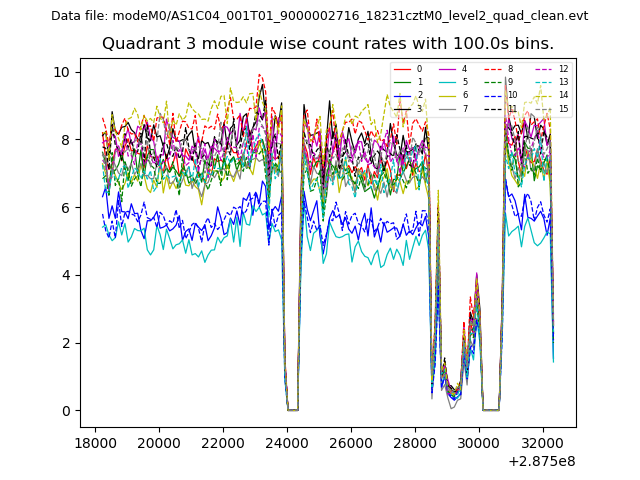
| Module-wise count rates for Quadrant C Data is divided into 100 sec bins |
 |
 |
| Module-wise count rates for Quadrant D Data is divided into 100 sec bins |
 |
 |
| Parameter | Plot |
|---|---|
| CZT HV Monitor | 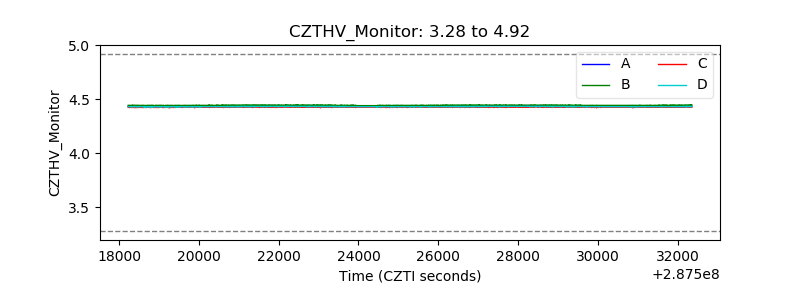 |
| D_VDD | 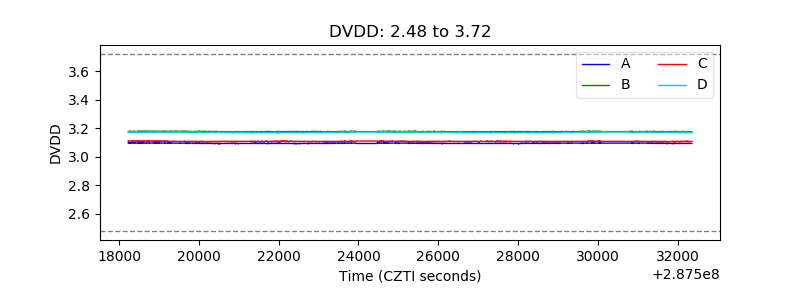 |
| Temperature 1 | 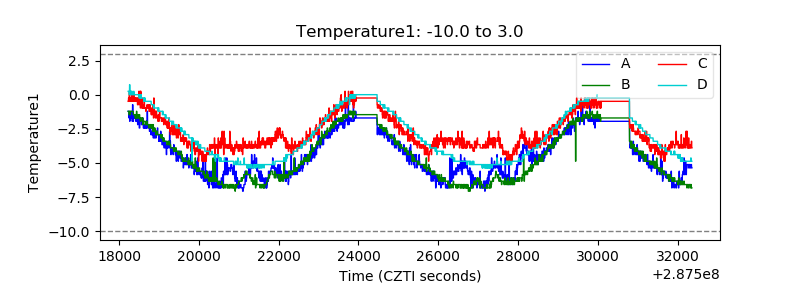 |
| Veto HV Monitor | 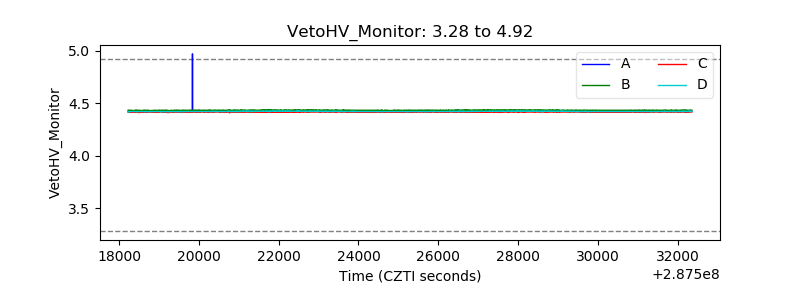 |
| Veto LLD | 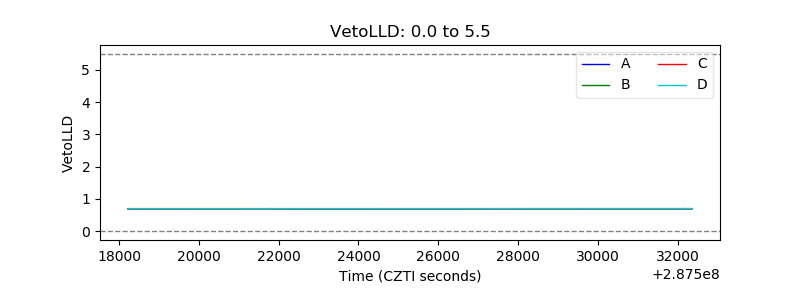 |
| Alpha Counter | 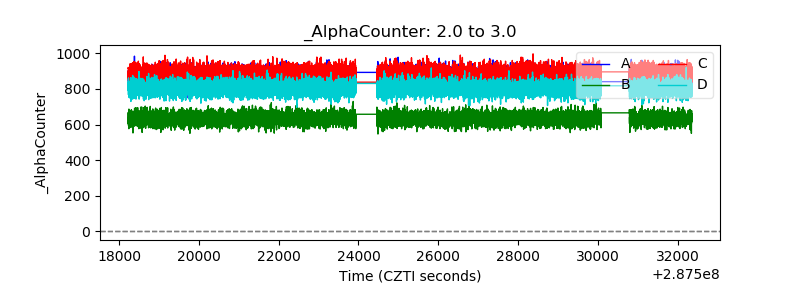 |
| _CPM_Rate | 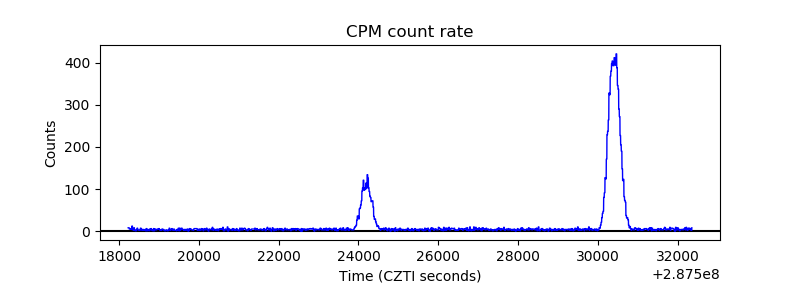 |
| CZT Counter | 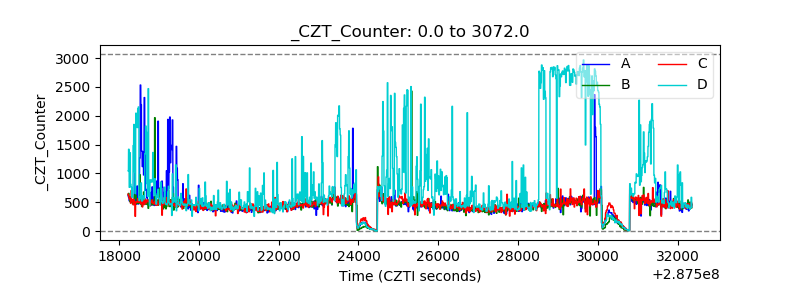 |
| +2.5 Volts monitor | 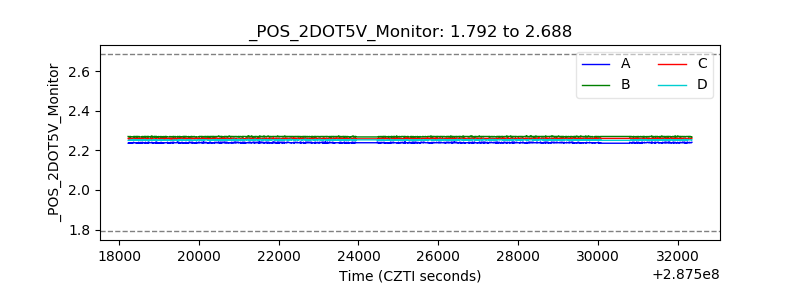 |
| +5 Volts monitor | 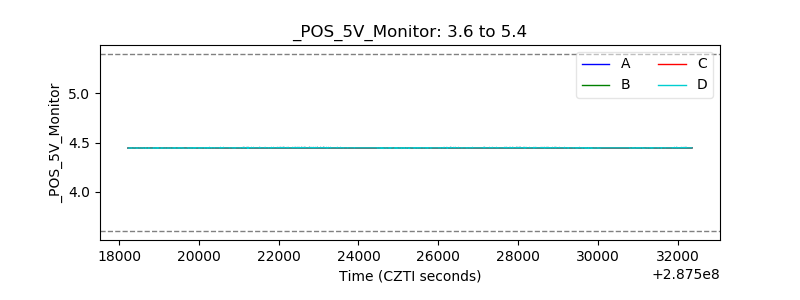 |
| _ROLL_ROT | 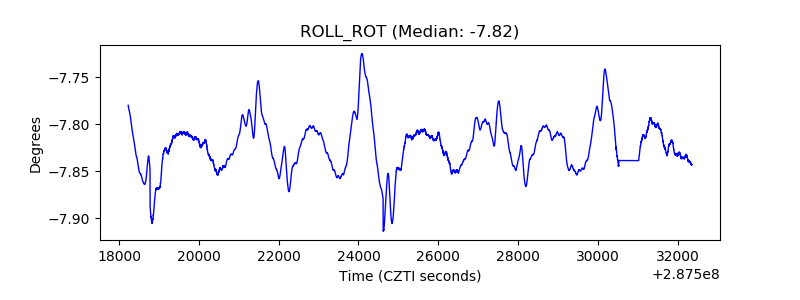 |
| _Roll_DEC | 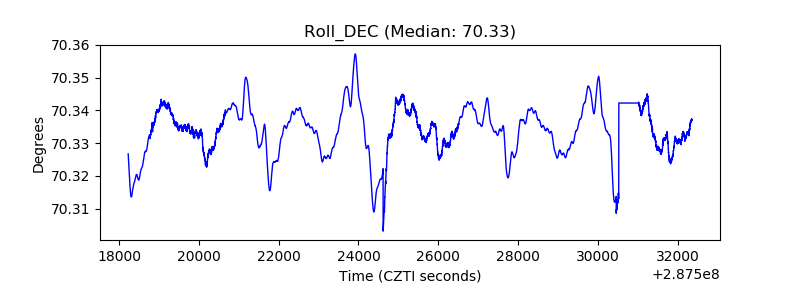 |
| _Roll_RA | 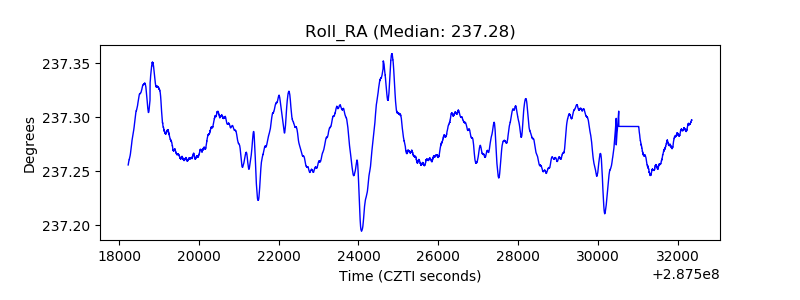 |
| Veto Counter | 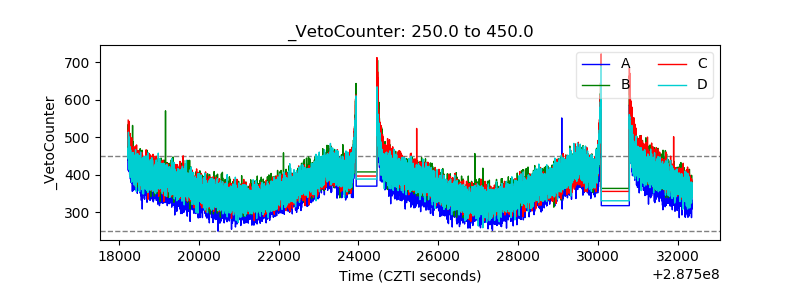 |