| Param | Original file | Final file |
|---|---|---|
| Filename | modeM0/AS1C04_001T01_9000002716_18232cztM0_level2.evt | modeM0/AS1C04_001T01_9000002716_18232cztM0_level2_quad_clean.evt |
| Size (bytes) | 743,040,000 | 121,109,760 |
| Size | 708.6 MB | 115.5 MB |
| Events in quadrant A | 3,355,461 | 879,343 |
| Events in quadrant B | 3,306,960 | 897,524 |
| Events in quadrant C | 3,342,475 | 861,743 |
| Events in quadrant D | 12,016,967 | 533,199 |
| Mode SS | |||
|---|---|---|---|
| Quadrant | BADHDUFLAG | Total packets | Discarded packets |
| A | 0 | 144 | 0 |
| B | 0 | 144 | 0 |
| C | 0 | 144 | 0 |
| D | 0 | 144 | 0 |
| Mode M9 | |||
|---|---|---|---|
| Quadrant | BADHDUFLAG | Total packets | Discarded packets |
| A | 0 | 16 | 0 |
| B | 0 | 16 | 0 |
| C | 0 | 16 | 0 |
| D | 0 | 16 | 0 |
| Mode M0 | |||
|---|---|---|---|
| Quadrant | BADHDUFLAG | Total packets | Discarded packets |
| A | 0 | 14952 | 2 |
| B | 0 | 14664 | 2 |
| C | 0 | 14712 | 2 |
| D | 0 | 40418 | 2 |
| Quadrant | Total seconds | Saturated seconds | Saturation percentage |
|---|---|---|---|
| A | 7112 | 76 | 1.068616% |
| B | 7113 | 69 | 0.970055% |
| C | 7113 | 89 | 1.251230% |
| D | 7113 | 3380 | 47.518628% |
Noise dominated data is calculated using 1-second bins in cleaned event files. If a bin has >2000 counts, and if more than 50% of those come from <1% of pixels, then it is considered to be noise-dominated and hence unusable.
| Quadrant | # 1 sec bins | Bins with >0 counts | Bins with >2000 counts | High rate bins dominated by noise | Noise dominated (total time) | Noise dominated (detector-on time) | Marked lightcurve |
|---|---|---|---|---|---|---|---|
| A | 8677 | 7114 | 19 | 19 | 0.22% | 0.27% | 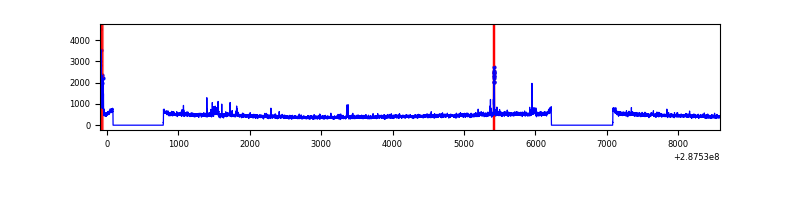 |
| B | 8678 | 7115 | 2 | 2 | 0.02% | 0.03% | 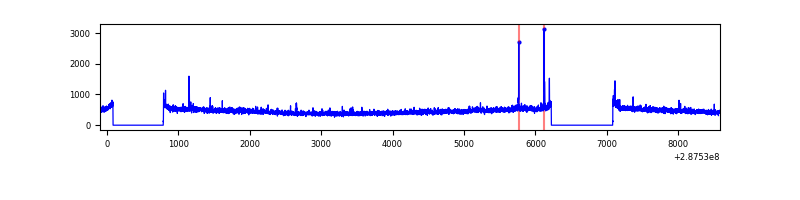 |
| C | 8678 | 7115 | 0 | 0 | 0.00% | 0.00% |  |
| D | 8678 | 7115 | 3152 | 3152 | 36.32% | 44.30% | 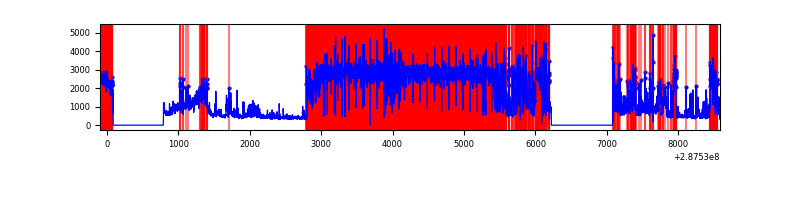 |
Top three noisy pixels from each quadrant. If the there are fewer than three noisy pixels in the level2.evt file, extra rows are filled as -1
| Pixel properties | Quadrant properties | ||||||
|---|---|---|---|---|---|---|---|
| Quadrant | DetID | PixID | Counts | Sigma | Mean | Median | Sigma |
| A | 15 | 174 | 162044 | 949.88 | 829 | 806 | 169.7 |
| A | 11 | 29 | 7922 | 41.92 | 829 | 806 | 169.7 |
| A | 0 | 226 | 7233 | 37.86 | 829 | 806 | 169.7 |
| B | 7 | 220 | 25582 | 156.27 | 834 | 811 | 158.5 |
| B | 12 | 111 | 19043 | 115.02 | 834 | 811 | 158.5 |
| B | 11 | 111 | 16409 | 98.4 | 834 | 811 | 158.5 |
| C | 14 | 238 | 125354 | 658.51 | 805 | 808 | 189.1 |
| C | 3 | 233 | 73644 | 385.11 | 805 | 808 | 189.1 |
| C | 7 | 174 | 7091 | 33.22 | 805 | 808 | 189.1 |
| D | 7 | 238 | 8298518 | 60993.18 | 555 | 537 | 136.0 |
| D | 1 | 52 | 816332 | 5996.39 | 555 | 537 | 136.0 |
| D | 5 | 222 | 497503 | 3652.88 | 555 | 537 | 136.0 |
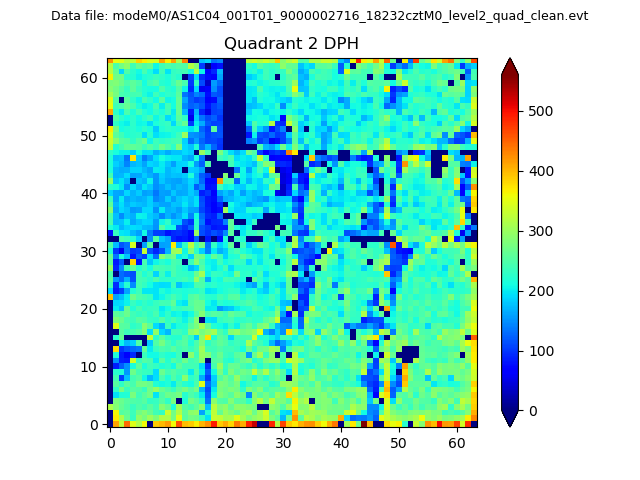
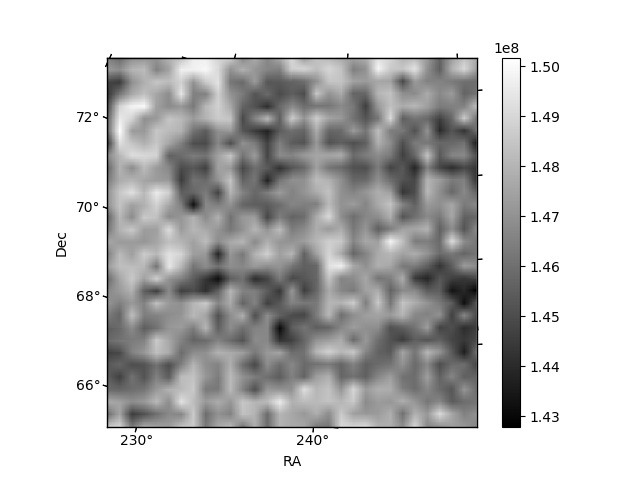
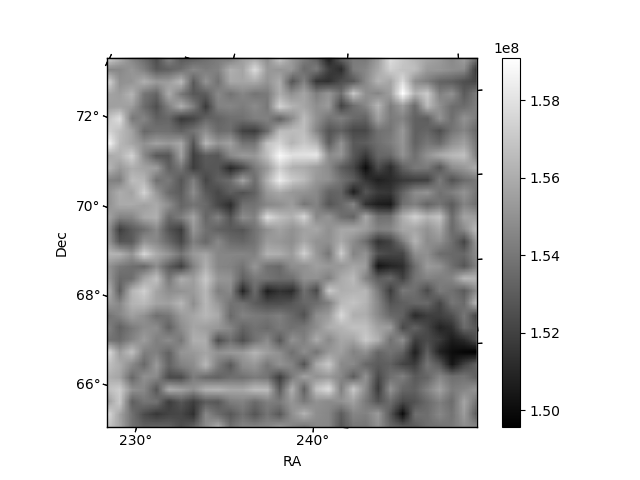
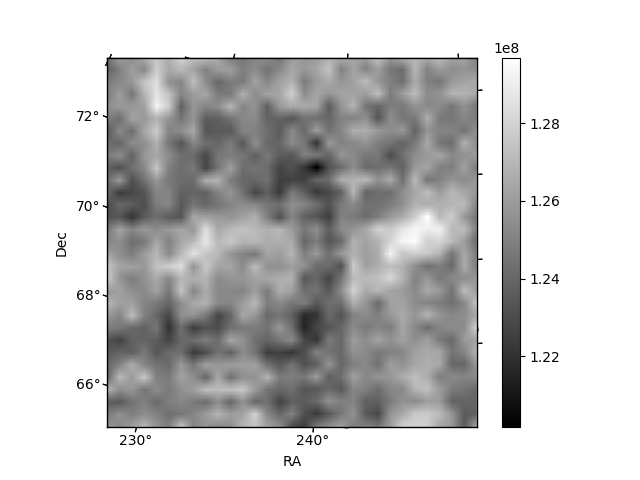
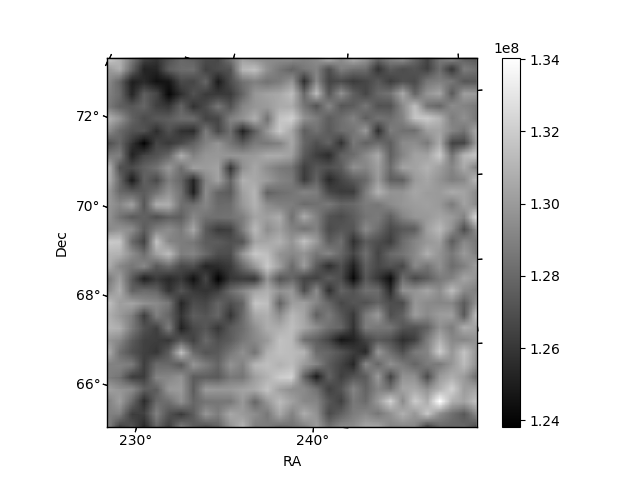
Histogram calculated using DETX and DETY for each event in the final _common_clean file
| Quadrant A | 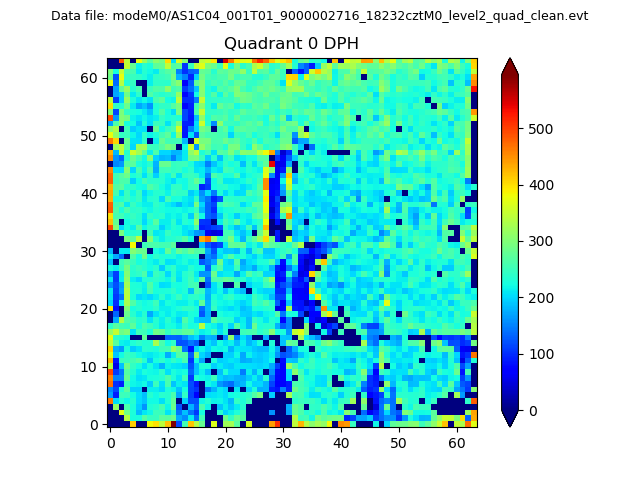 |
 |
Quadrant B |
|---|---|---|---|
| Quadrant D | 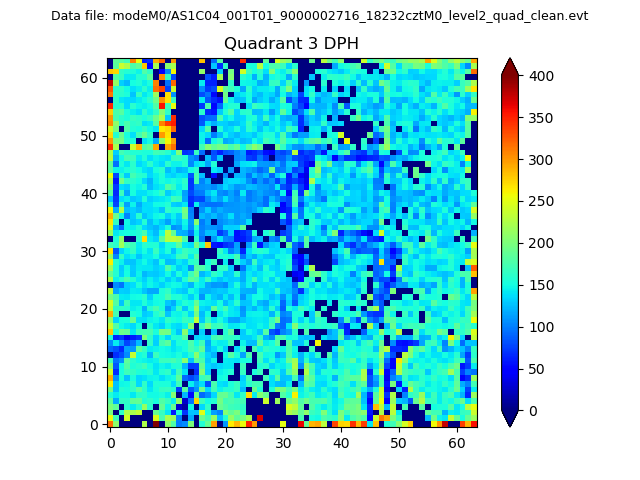 |
 |
Quadrant C |
| Plot type | Count rate plots | Images |
|---|---|---|
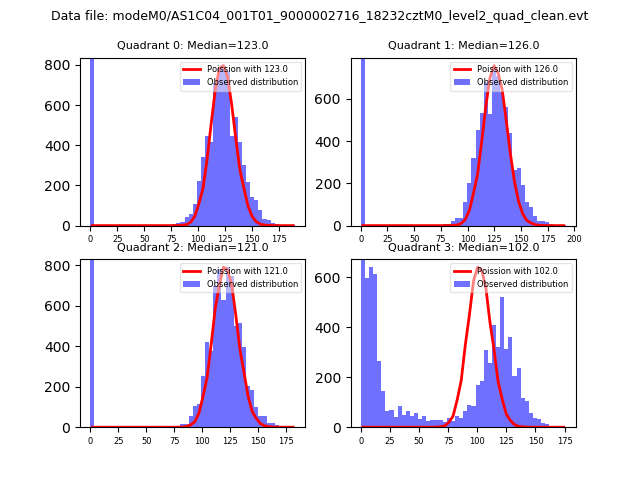
| Comparison with Poisson distribution Blue bars denote a histogram of data divided into 1 sec bins. Red curve is a Poisson curve with rate = median count rate of data. |
 |
 |
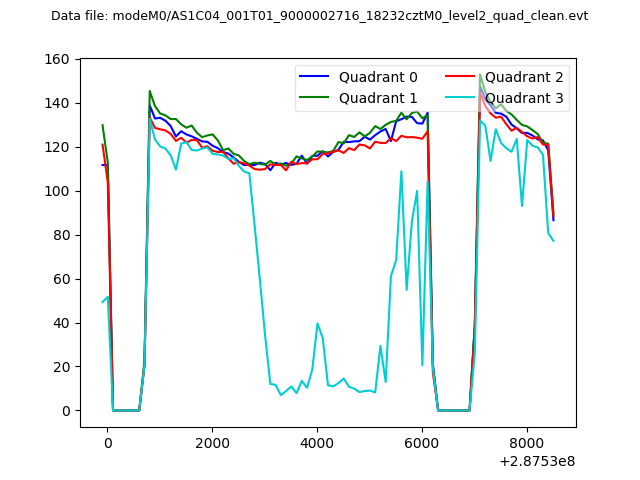
| Quadrant-wise count rates Data is divided into 100 sec bins |
 |
|
| Module-wise count rates for Quadrant A Data is divided into 100 sec bins |
 |
 |
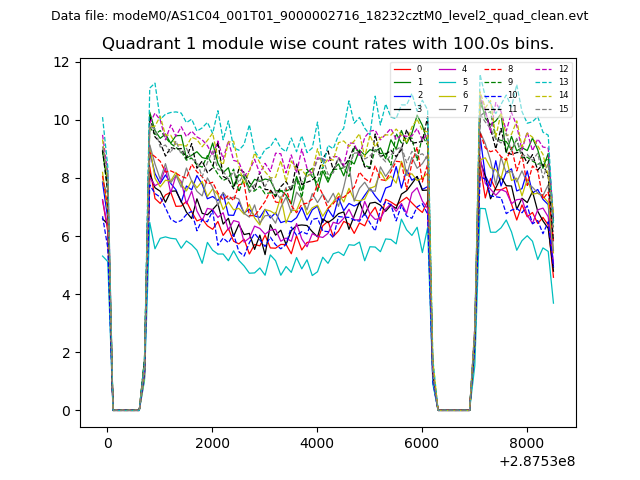
| Module-wise count rates for Quadrant B Data is divided into 100 sec bins |
 |
 |
| Module-wise count rates for Quadrant C Data is divided into 100 sec bins |
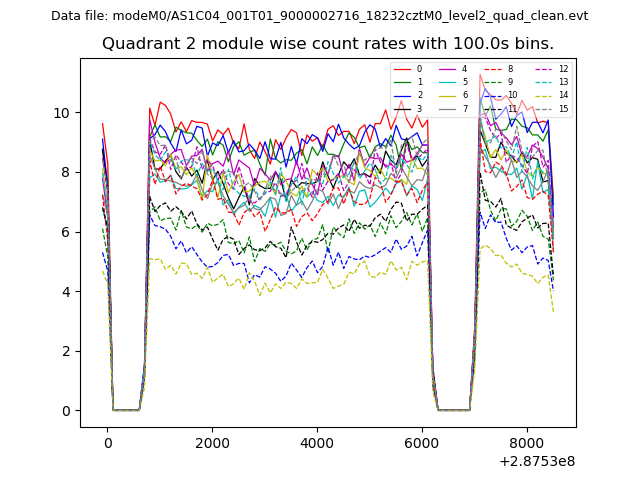 |
 |
| Module-wise count rates for Quadrant D Data is divided into 100 sec bins |
 |
 |
| Parameter | Plot |
|---|---|
| CZT HV Monitor |  |
| D_VDD | 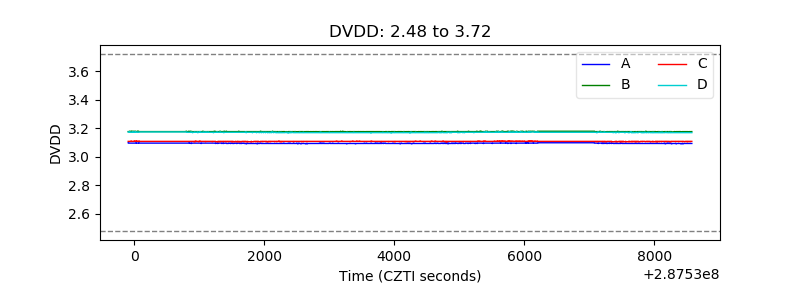 |
| Temperature 1 |  |
| Veto HV Monitor | 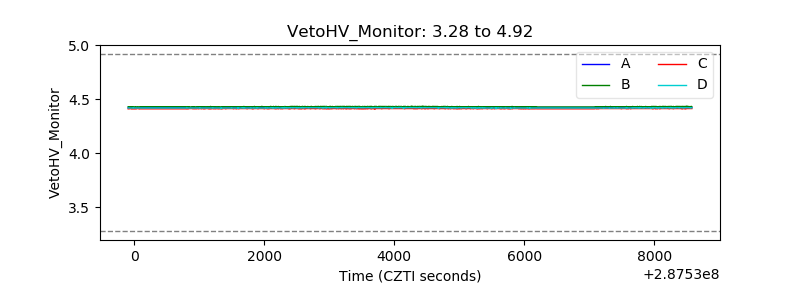 |
| Veto LLD | 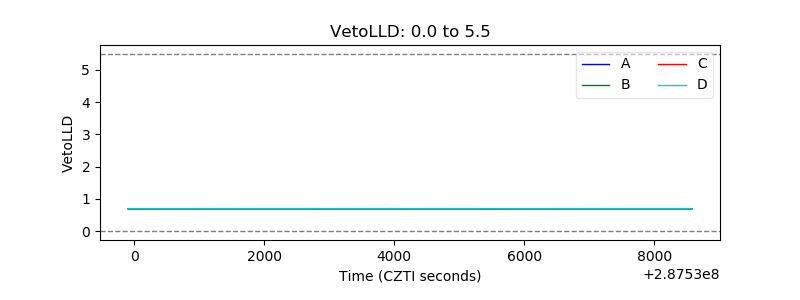 |
| Alpha Counter | 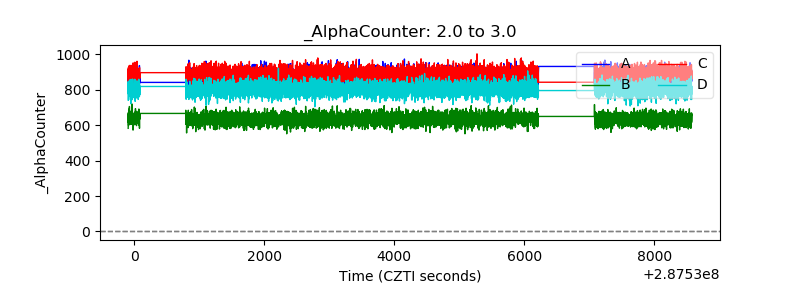 |
| _CPM_Rate | 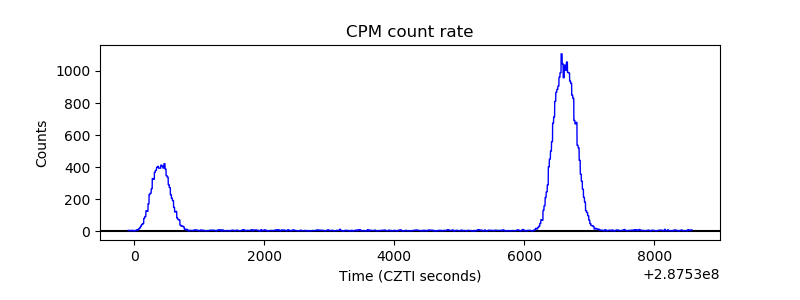 |
| CZT Counter | 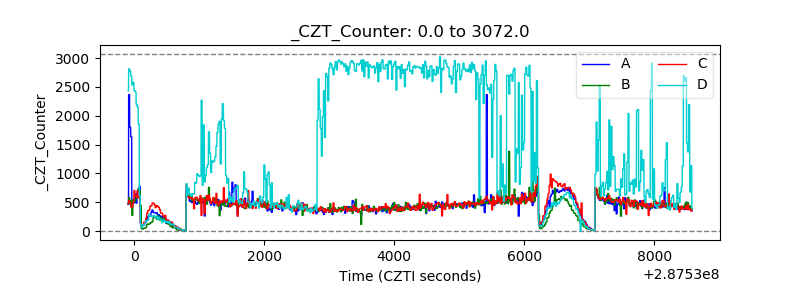 |
| +2.5 Volts monitor |  |
| +5 Volts monitor |  |
| _ROLL_ROT | 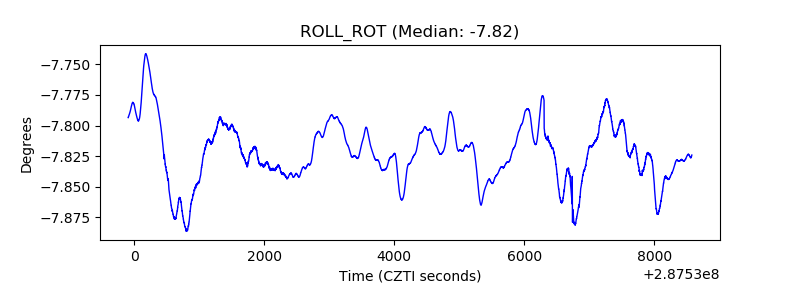 |
| _Roll_DEC | 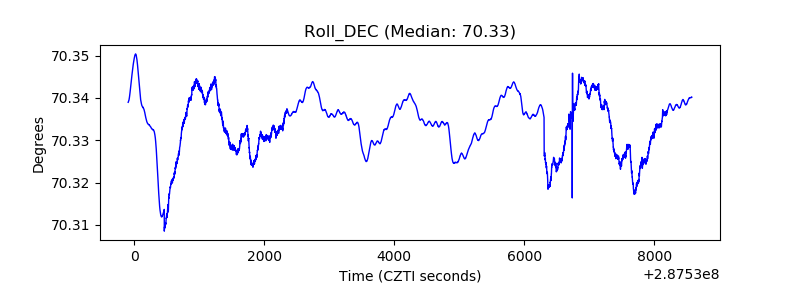 |
| _Roll_RA | 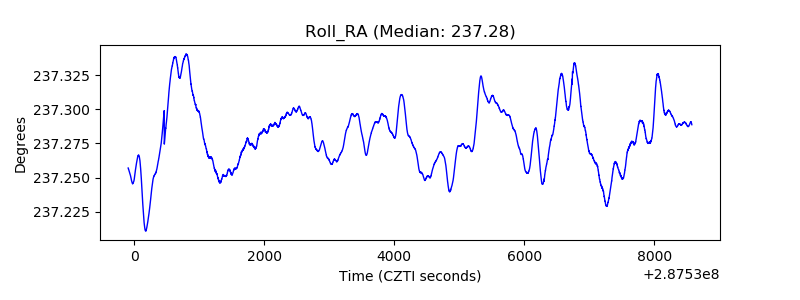 |
| Veto Counter | 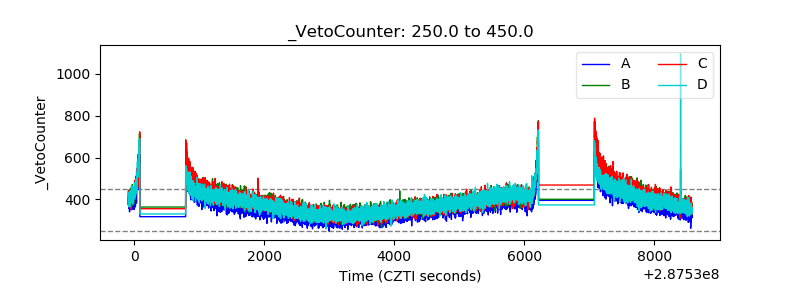 |