| Param | Original file | Final file |
|---|---|---|
| Filename | modeM0/AS1C04_001T01_9000002716_18237cztM0_level2.evt | modeM0/AS1C04_001T01_9000002716_18237cztM0_level2_quad_clean.evt |
| Size (bytes) | 388,353,600 | 103,458,240 |
| Size | 370.4 MB | 98.7 MB |
| Events in quadrant A | 2,894,148 | 717,474 |
| Events in quadrant B | 2,558,938 | 735,054 |
| Events in quadrant C | 2,419,610 | 686,720 |
| Events in quadrant D | 3,546,500 | 641,627 |
| Mode SS | |||
|---|---|---|---|
| Quadrant | BADHDUFLAG | Total packets | Discarded packets |
| A | 0 | 104 | 0 |
| B | 0 | 104 | 0 |
| C | 0 | 104 | 0 |
| D | 0 | 104 | 0 |
| Mode M9 | |||
|---|---|---|---|
| Quadrant | BADHDUFLAG | Total packets | Discarded packets |
| A | 0 | 13 | 0 |
| B | 0 | 14 | 0 |
| C | 0 | 14 | 0 |
| D | 0 | 14 | 0 |
| Mode M0 | |||
|---|---|---|---|
| Quadrant | BADHDUFLAG | Total packets | Discarded packets |
| A | 0 | 11851 | 2 |
| B | 0 | 10722 | 2 |
| C | 0 | 10389 | 2 |
| D | 0 | 14008 | 2 |
| Quadrant | Total seconds | Saturated seconds | Saturation percentage |
|---|---|---|---|
| A | 5022 | 114 | 2.270012% |
| B | 5022 | 30 | 0.597372% |
| C | 5022 | 45 | 0.896057% |
| D | 5022 | 451 | 8.980486% |
Noise dominated data is calculated using 1-second bins in cleaned event files. If a bin has >2000 counts, and if more than 50% of those come from <1% of pixels, then it is considered to be noise-dominated and hence unusable.
| Quadrant | # 1 sec bins | Bins with >0 counts | Bins with >2000 counts | High rate bins dominated by noise | Noise dominated (total time) | Noise dominated (detector-on time) | Marked lightcurve |
|---|---|---|---|---|---|---|---|
| A | 6382 | 5023 | 73 | 73 | 1.14% | 1.45% | 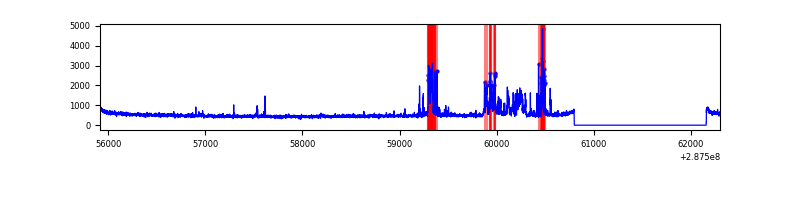 |
| B | 6382 | 5023 | 5 | 5 | 0.08% | 0.10% | 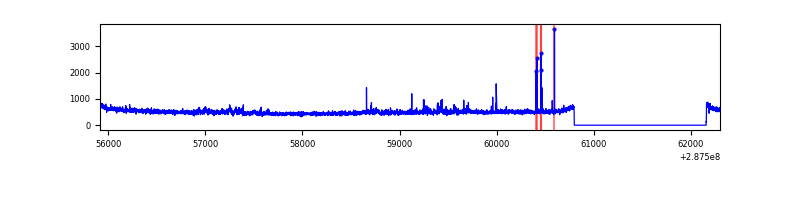 |
| C | 6382 | 5023 | 0 | 0 | 0.00% | 0.00% | 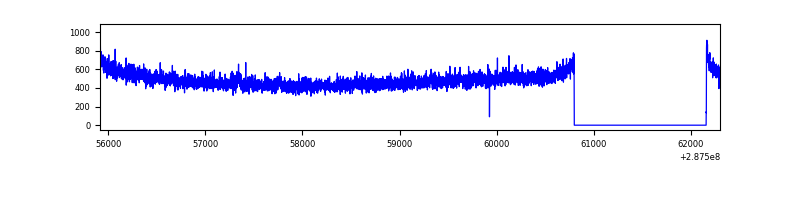 |
| D | 6382 | 5023 | 368 | 368 | 5.77% | 7.33% | 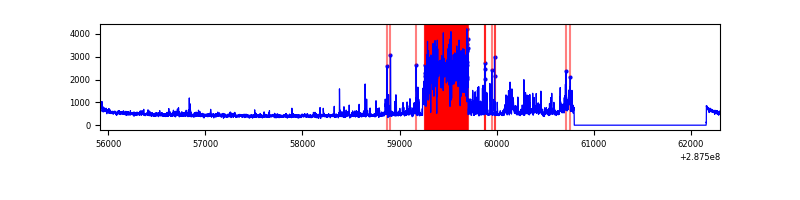 |
Top three noisy pixels from each quadrant. If the there are fewer than three noisy pixels in the level2.evt file, extra rows are filled as -1
| Pixel properties | Quadrant properties | ||||||
|---|---|---|---|---|---|---|---|
| Quadrant | DetID | PixID | Counts | Sigma | Mean | Median | Sigma |
| A | 15 | 174 | 474962 | 3741.94 | 628 | 614 | 126.8 |
| A | 0 | 226 | 5688 | 40.02 | 628 | 614 | 126.8 |
| A | 12 | 194 | 4636 | 31.72 | 628 | 614 | 126.8 |
| B | 0 | 189 | 46189 | 389.12 | 628 | 614 | 117.1 |
| B | 7 | 220 | 30903 | 258.61 | 628 | 614 | 117.1 |
| B | 12 | 111 | 12776 | 103.84 | 628 | 614 | 117.1 |
| C | 14 | 238 | 95954 | 701.63 | 592 | 595 | 135.9 |
| C | 7 | 174 | 9644 | 66.58 | 592 | 595 | 135.9 |
| C | 3 | 233 | 4700 | 30.2 | 592 | 595 | 135.9 |
| D | 7 | 238 | 1049257 | 7578.62 | 573 | 559 | 138.4 |
| D | 1 | 52 | 213699 | 1540.3 | 573 | 559 | 138.4 |
| D | 13 | 104 | 52505 | 375.4 | 573 | 559 | 138.4 |
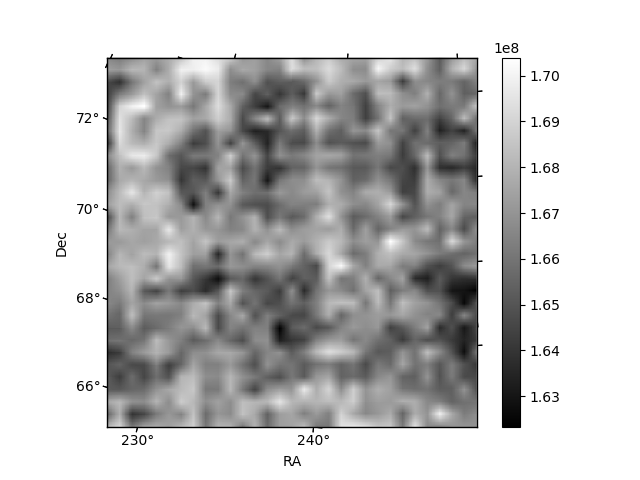
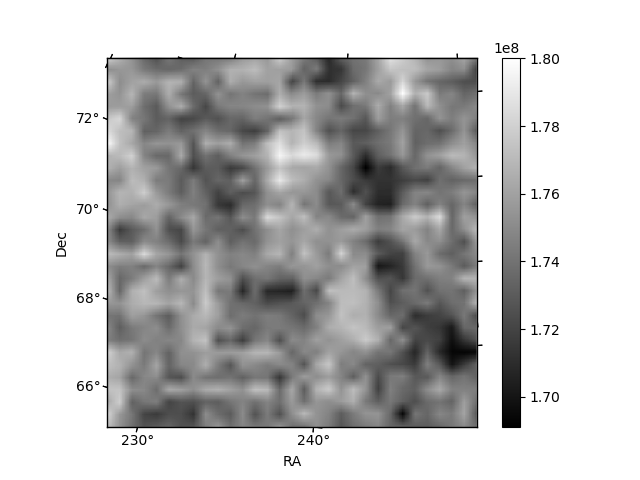
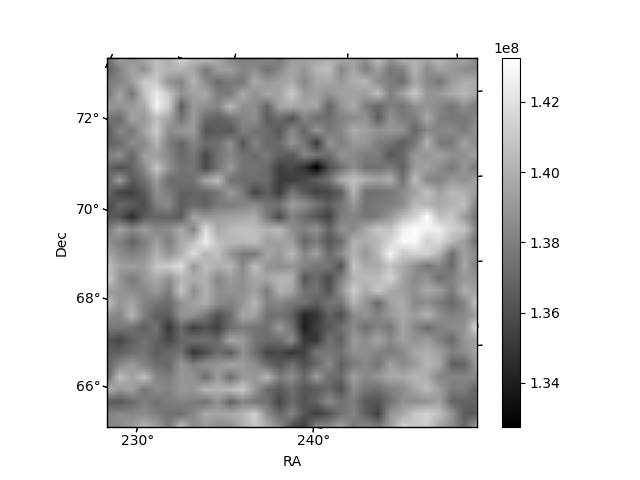
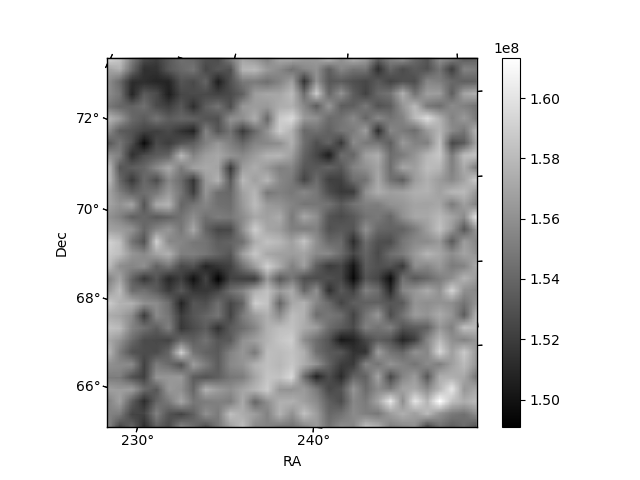
Histogram calculated using DETX and DETY for each event in the final _common_clean file
| Quadrant A |  |
 |
Quadrant B |
|---|---|---|---|
| Quadrant D |  |
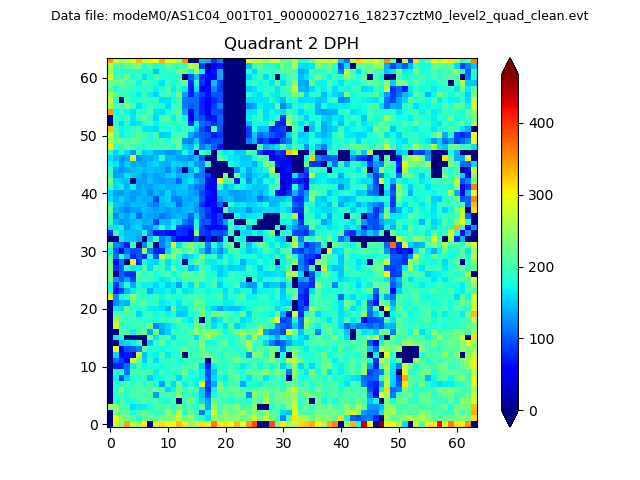 |
Quadrant C |
| Plot type | Count rate plots | Images |
|---|---|---|
| Comparison with Poisson distribution Blue bars denote a histogram of data divided into 1 sec bins. Red curve is a Poisson curve with rate = median count rate of data. |
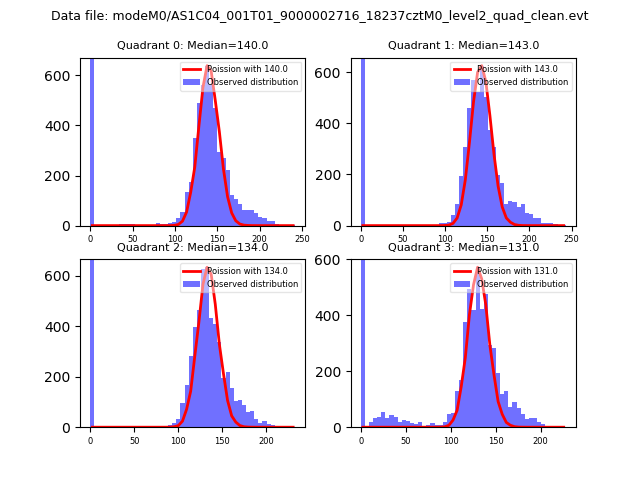 |
 |
| Quadrant-wise count rates Data is divided into 100 sec bins |
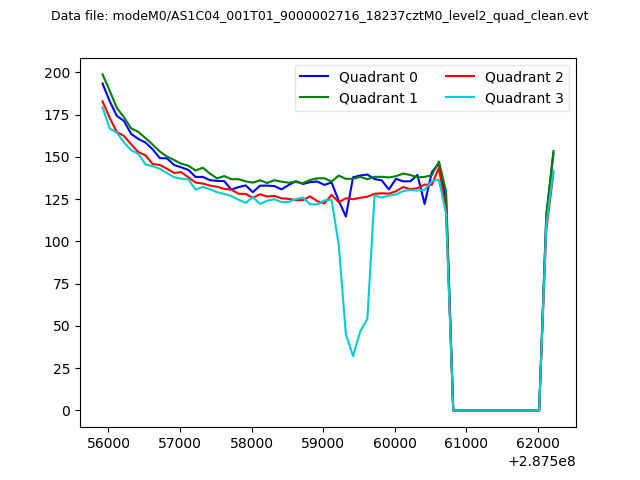 |
|
| Module-wise count rates for Quadrant A Data is divided into 100 sec bins |
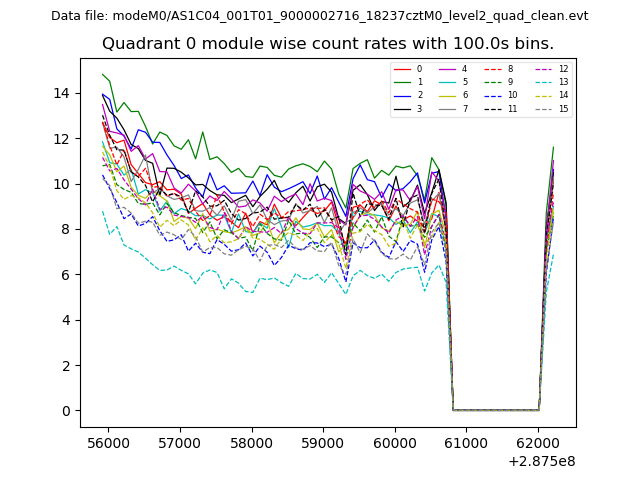 |
 |
| Module-wise count rates for Quadrant B Data is divided into 100 sec bins |
 |
 |
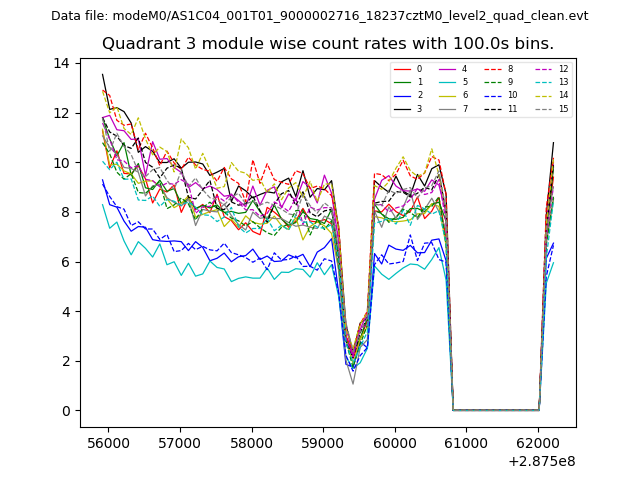
| Module-wise count rates for Quadrant C Data is divided into 100 sec bins |
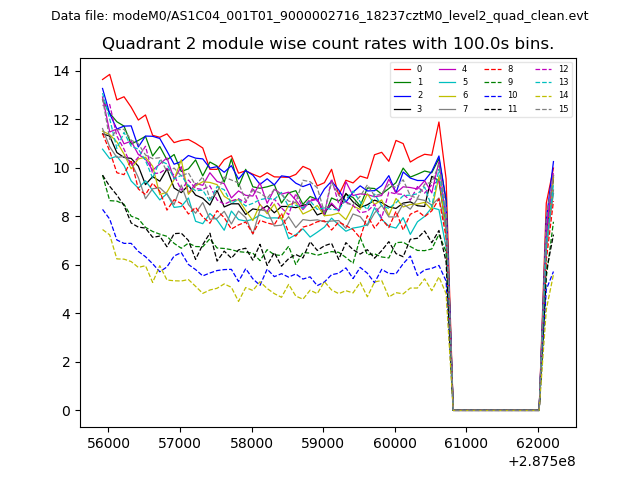 |
 |
| Module-wise count rates for Quadrant D Data is divided into 100 sec bins |
 |
 |
| Parameter | Plot |
|---|---|
| CZT HV Monitor |  |
| D_VDD |  |
| Temperature 1 | 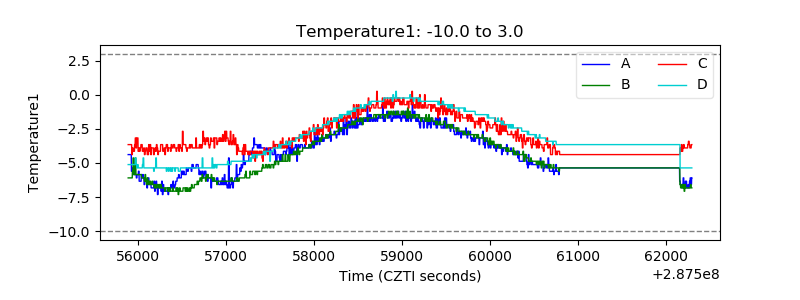 |
| Veto HV Monitor | 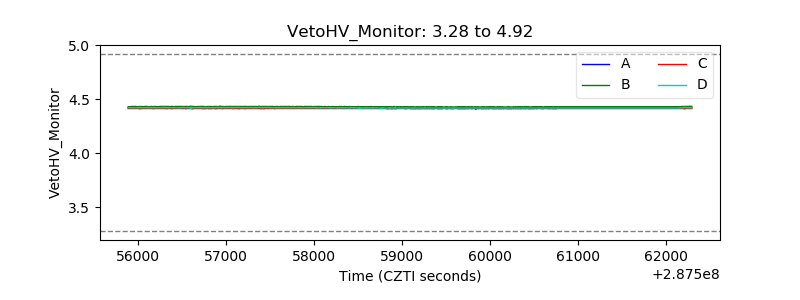 |
| Veto LLD | 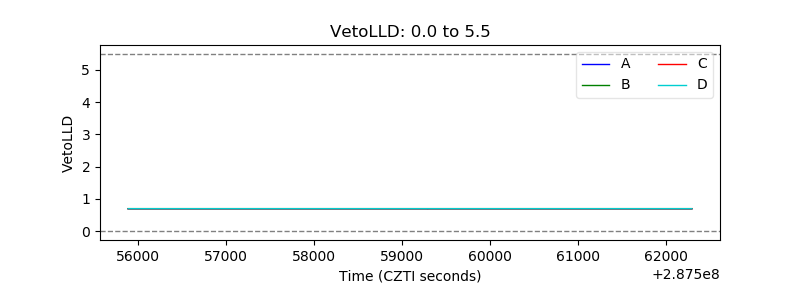 |
| Alpha Counter | 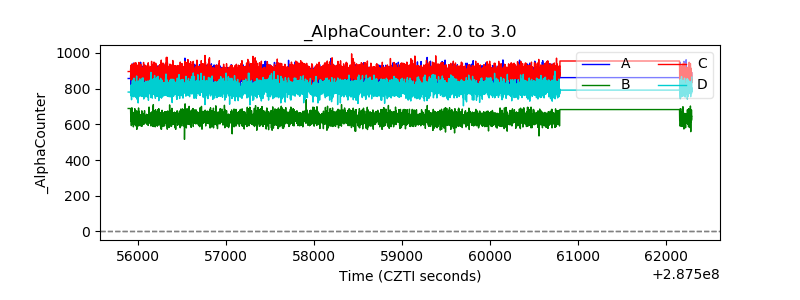 |
| _CPM_Rate | 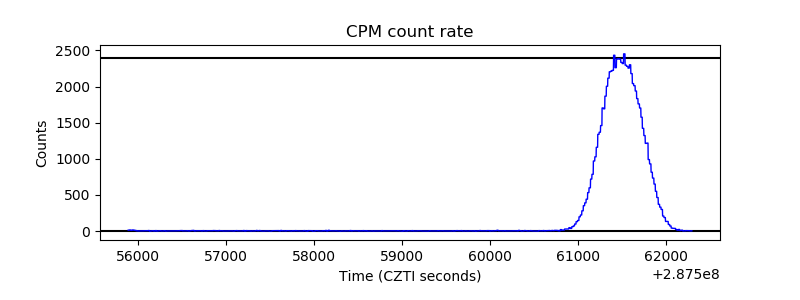 |
| CZT Counter | 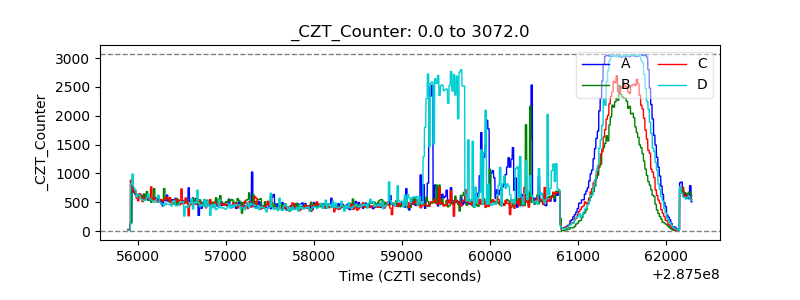 |
| +2.5 Volts monitor |  |
| +5 Volts monitor | 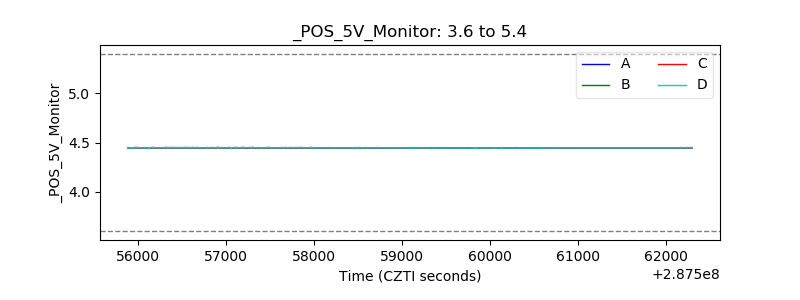 |
| _ROLL_ROT | 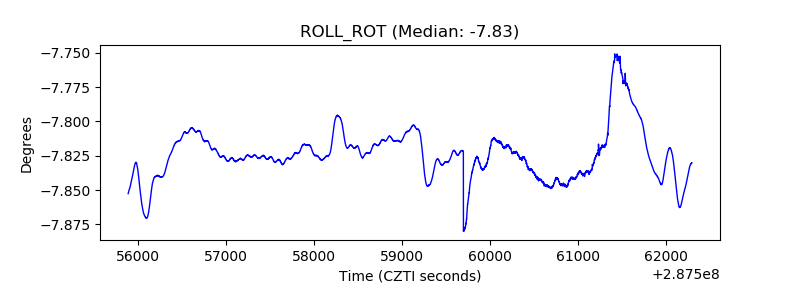 |
| _Roll_DEC | 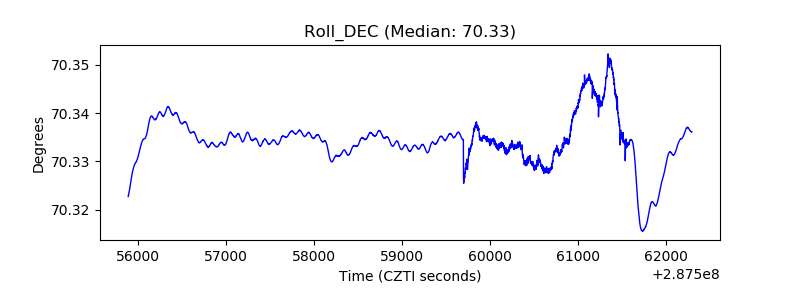 |
| _Roll_RA | 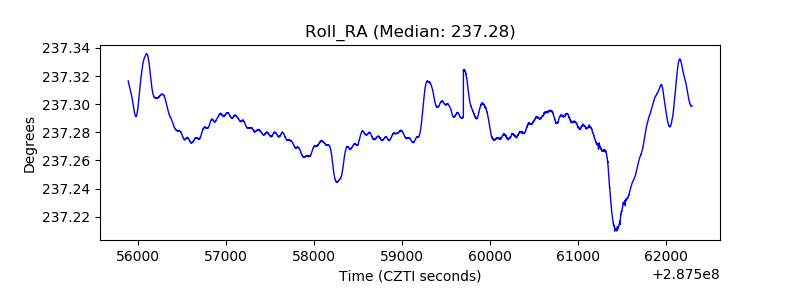 |
| Veto Counter | 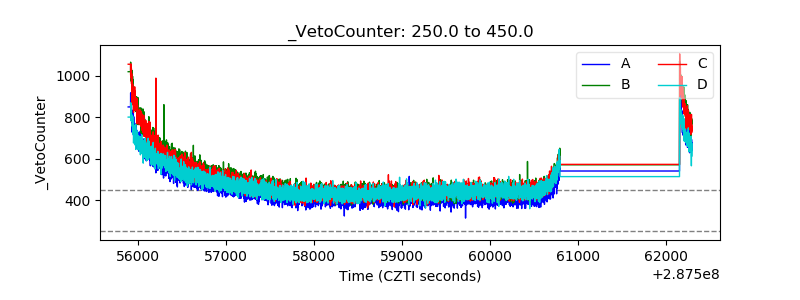 |