| Param | Original file | Final file |
|---|---|---|
| Filename | modeM0/AS1C04_001T01_9000002716_18238cztM0_level2.evt | modeM0/AS1C04_001T01_9000002716_18238cztM0_level2_quad_clean.evt |
| Size (bytes) | 12,323,520 | 4,060,800 |
| Size | 11.8 MB | 3.9 MB |
| Events in quadrant A | 91,963 | 26,807 |
| Events in quadrant B | 91,106 | 26,911 |
| Events in quadrant C | 89,107 | 24,658 |
| Events in quadrant D | 87,366 | 25,317 |
| Mode SS | |||
|---|---|---|---|
| Quadrant | BADHDUFLAG | Total packets | Discarded packets |
| A | 0 | 4 | 0 |
| B | 0 | 4 | 0 |
| C | 0 | 4 | 0 |
| D | 0 | 4 | 0 |
| Mode M9 | |||
|---|---|---|---|
| Quadrant | BADHDUFLAG | Total packets | Discarded packets |
| A | 0 | 5 | 0 |
| B | 0 | 6 | 0 |
| C | 0 | 6 | 0 |
| D | 0 | 6 | 0 |
| Mode M0 | |||
|---|---|---|---|
| Quadrant | BADHDUFLAG | Total packets | Discarded packets |
| A | 0 | 381 | 1 |
| B | 0 | 385 | 1 |
| C | 0 | 372 | 1 |
| D | 0 | 367 | 1 |
| Quadrant | Total seconds | Saturated seconds | Saturation percentage |
|---|---|---|---|
| A | 141 | 8 | 5.673759% |
| B | 141 | 5 | 3.546099% |
| C | 141 | 6 | 4.255319% |
| D | 141 | 2 | 1.418440% |
Noise dominated data is calculated using 1-second bins in cleaned event files. If a bin has >2000 counts, and if more than 50% of those come from <1% of pixels, then it is considered to be noise-dominated and hence unusable.
| Quadrant | # 1 sec bins | Bins with >0 counts | Bins with >2000 counts | High rate bins dominated by noise | Noise dominated (total time) | Noise dominated (detector-on time) | Marked lightcurve |
|---|---|---|---|---|---|---|---|
| A | 141 | 141 | 0 | 0 | 0.00% | 0.00% | 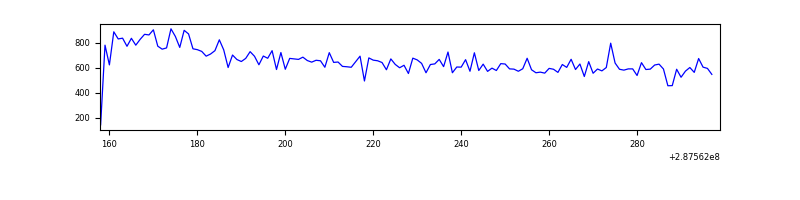 |
| B | 141 | 141 | 0 | 0 | 0.00% | 0.00% | 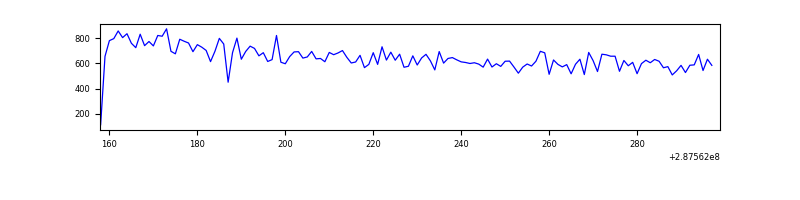 |
| C | 141 | 141 | 0 | 0 | 0.00% | 0.00% | 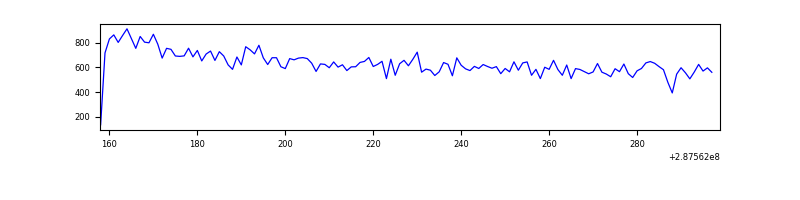 |
| D | 141 | 141 | 0 | 0 | 0.00% | 0.00% | 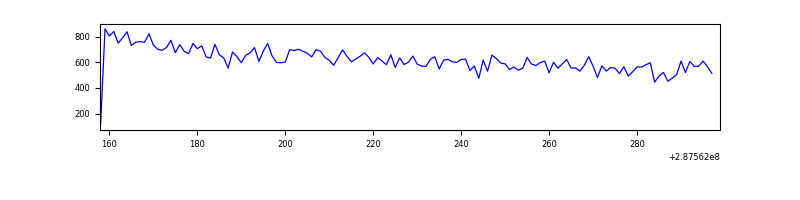 |
Top three noisy pixels from each quadrant. If the there are fewer than three noisy pixels in the level2.evt file, extra rows are filled as -1
| Pixel properties | Quadrant properties | ||||||
|---|---|---|---|---|---|---|---|
| Quadrant | DetID | PixID | Counts | Sigma | Mean | Median | Sigma |
| A | 11 | 29 | 529 | 74.18 | 23 | 22 | 6.8 |
| A | 2 | 242 | 415 | 57.5 | 23 | 22 | 6.8 |
| A | 4 | 2 | 256 | 34.24 | 23 | 22 | 6.8 |
| B | 12 | 111 | 440 | 65.7 | 23 | 22 | 6.4 |
| B | 11 | 111 | 431 | 64.29 | 23 | 22 | 6.4 |
| B | 14 | 111 | 413 | 61.46 | 23 | 22 | 6.4 |
| C | 14 | 238 | 3760 | 559.28 | 21 | 21 | 6.7 |
| C | 7 | 174 | 1248 | 183.53 | 21 | 21 | 6.7 |
| C | 1 | 16 | 239 | 32.61 | 21 | 21 | 6.7 |
| D | 3 | 238 | 2114 | 282.74 | 22 | 21 | 7.4 |
| D | 3 | 254 | 917 | 121.04 | 22 | 21 | 7.4 |
| D | 1 | 52 | 288 | 36.07 | 22 | 21 | 7.4 |
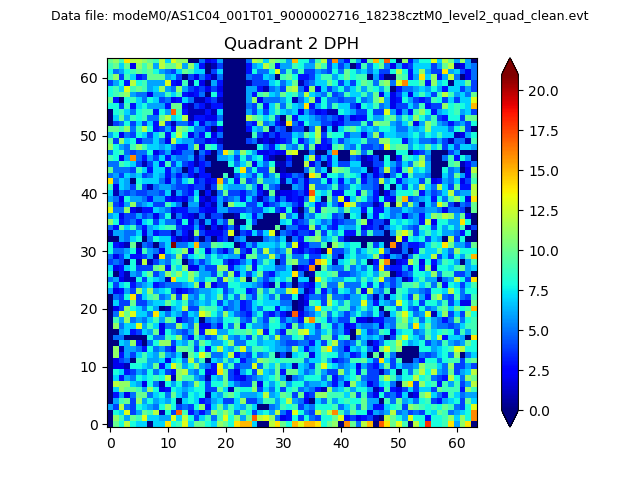
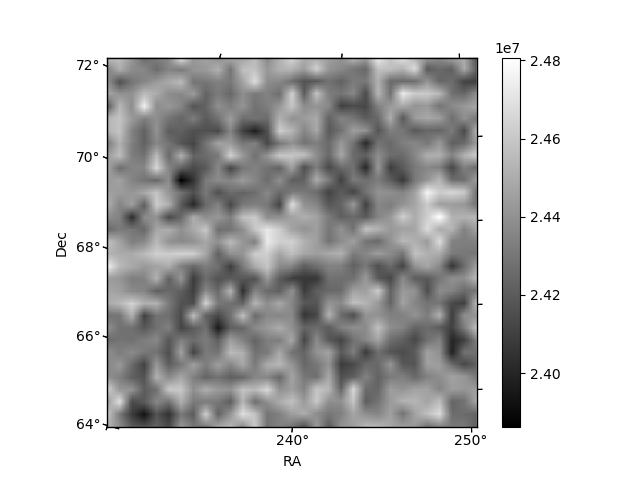
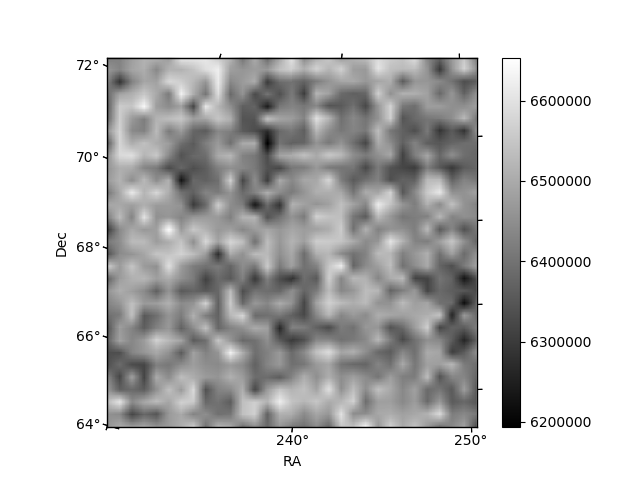
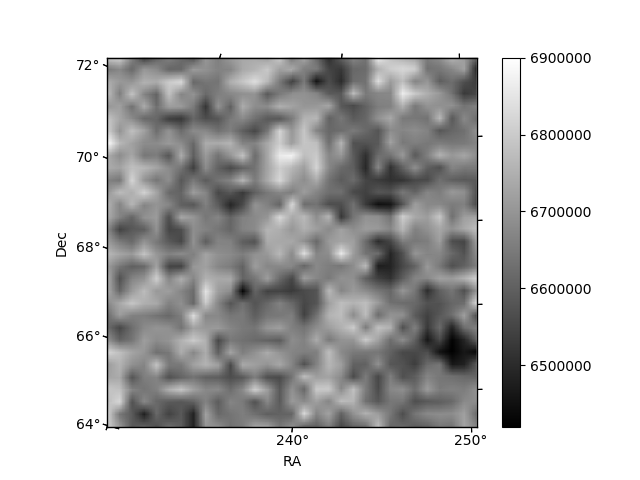
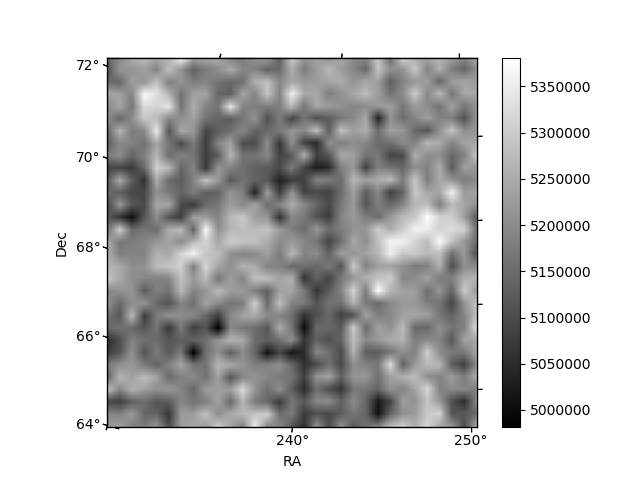
Histogram calculated using DETX and DETY for each event in the final _common_clean file
| Quadrant A | 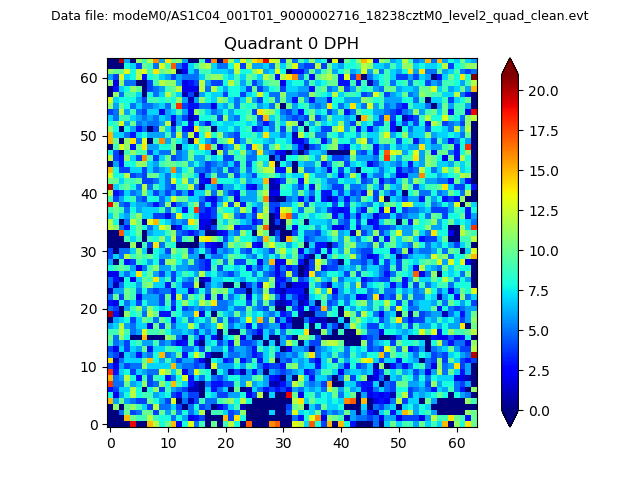 |
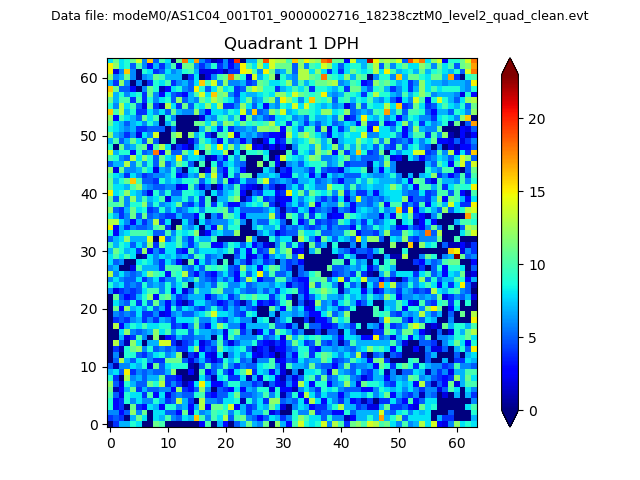 |
Quadrant B |
|---|---|---|---|
| Quadrant D | 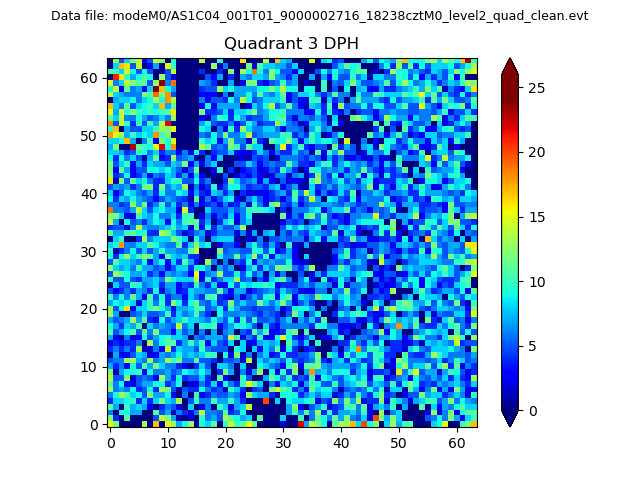 |
 |
Quadrant C |
| Plot type | Count rate plots | Images |
|---|---|---|
| Comparison with Poisson distribution Blue bars denote a histogram of data divided into 1 sec bins. Red curve is a Poisson curve with rate = median count rate of data. |
 |
 |
| Quadrant-wise count rates Data is divided into 100 sec bins |
 |
|
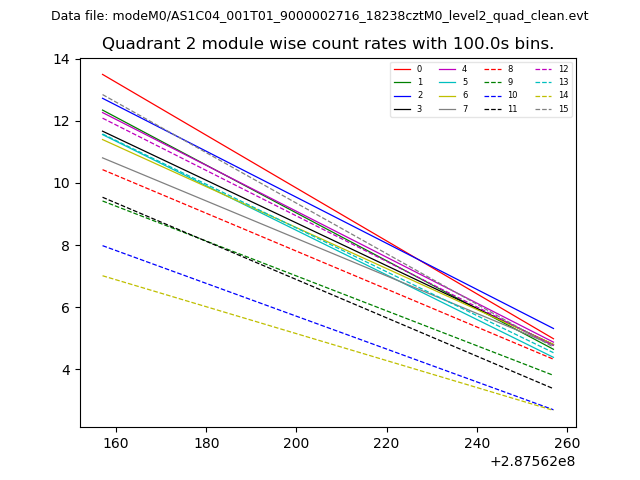
| Module-wise count rates for Quadrant A Data is divided into 100 sec bins |
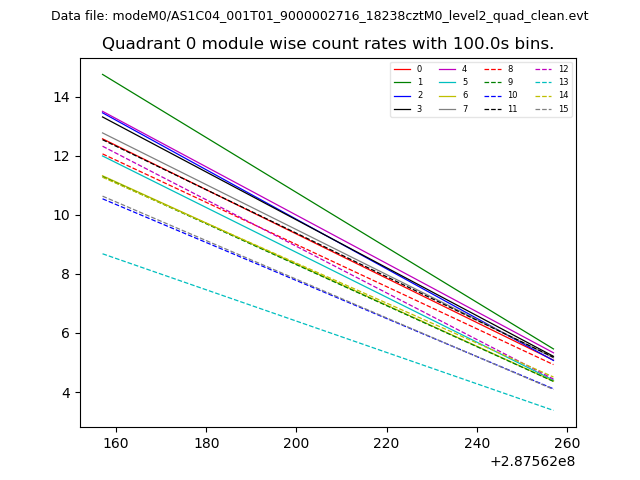 |
 |
| Module-wise count rates for Quadrant B Data is divided into 100 sec bins |
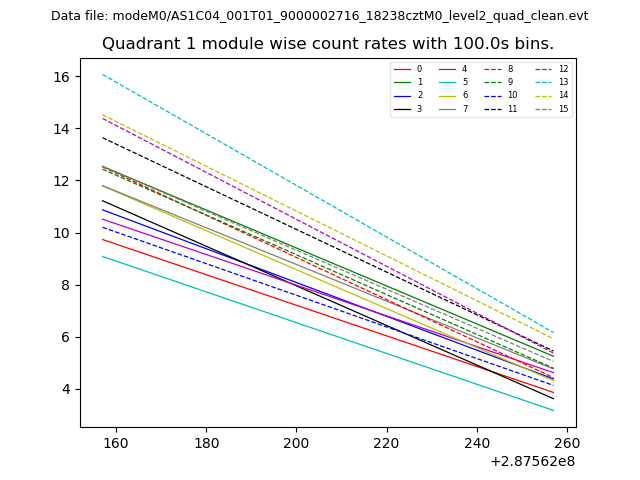 |
 |
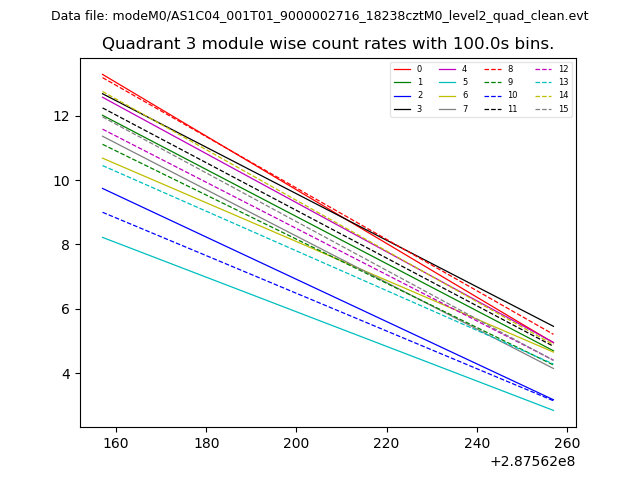
| Module-wise count rates for Quadrant C Data is divided into 100 sec bins |
 |
 |
| Module-wise count rates for Quadrant D Data is divided into 100 sec bins |
 |
 |
| Parameter | Plot |
|---|---|
| CZT HV Monitor | 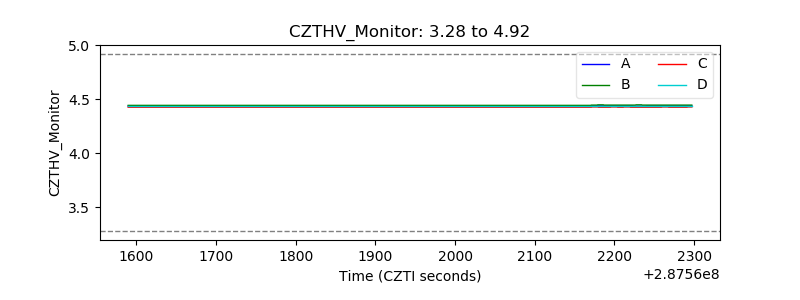 |
| D_VDD | 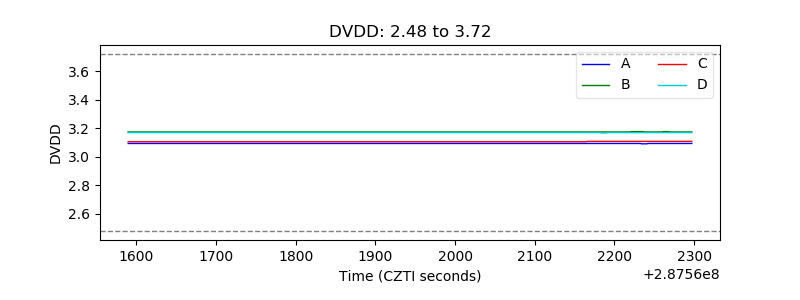 |
| Temperature 1 | 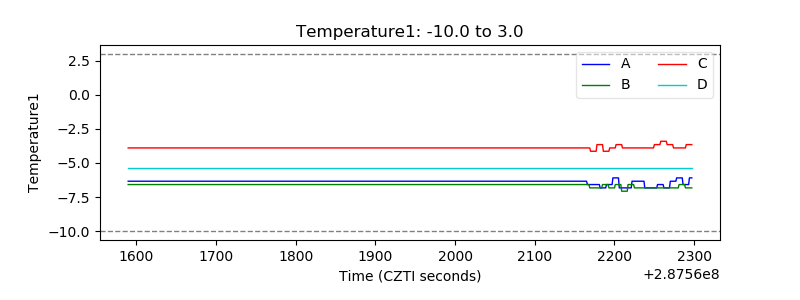 |
| Veto HV Monitor | 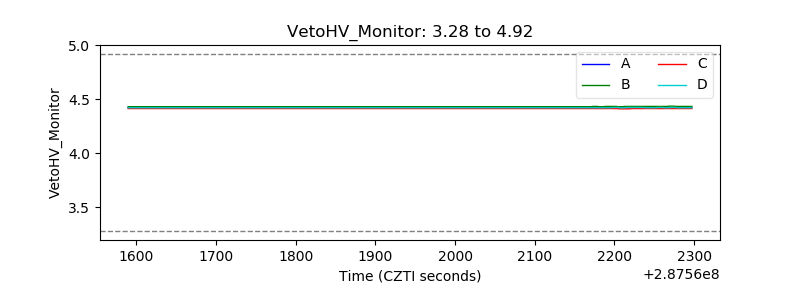 |
| Veto LLD | 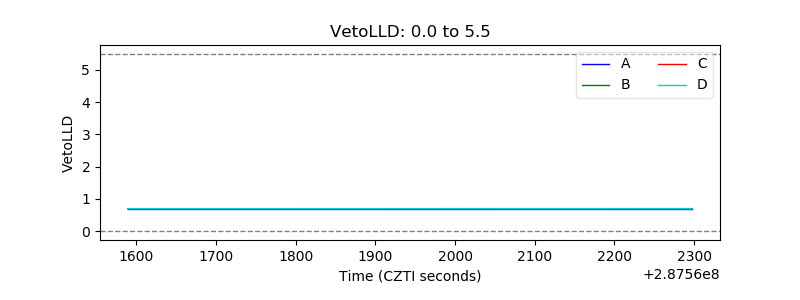 |
| Alpha Counter |  |
| _CPM_Rate | 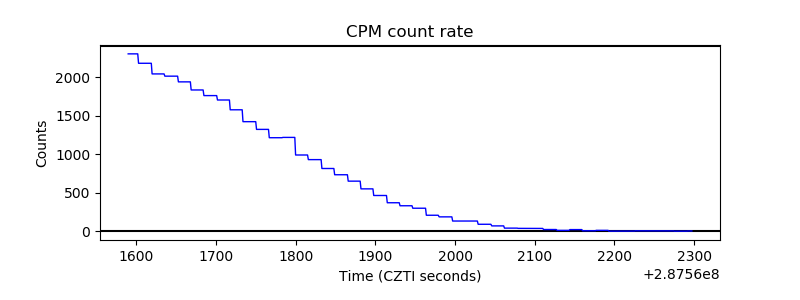 |
| CZT Counter | 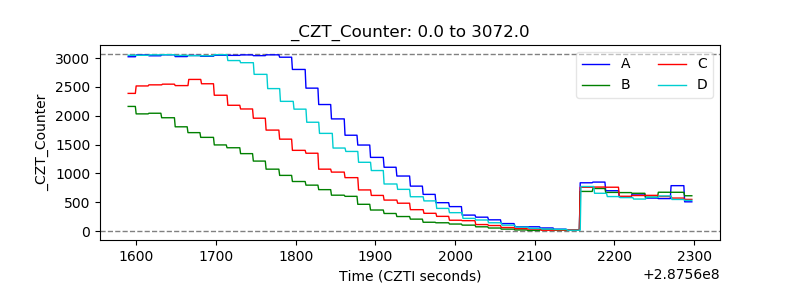 |
| +2.5 Volts monitor |  |
| +5 Volts monitor |  |
| _ROLL_ROT | 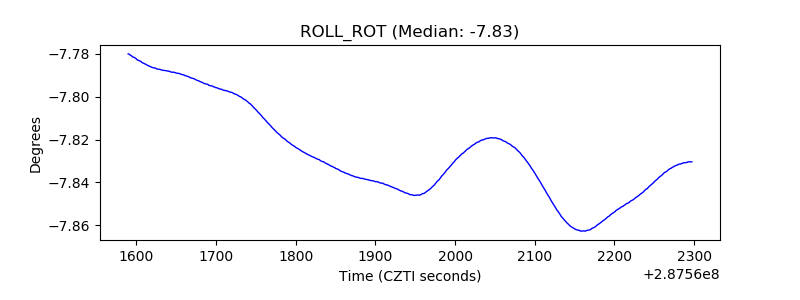 |
| _Roll_DEC | 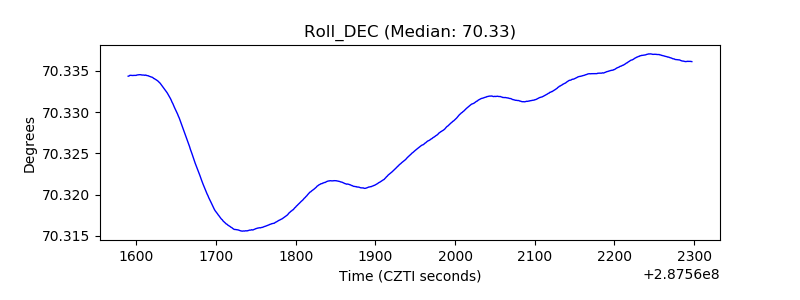 |
| _Roll_RA | 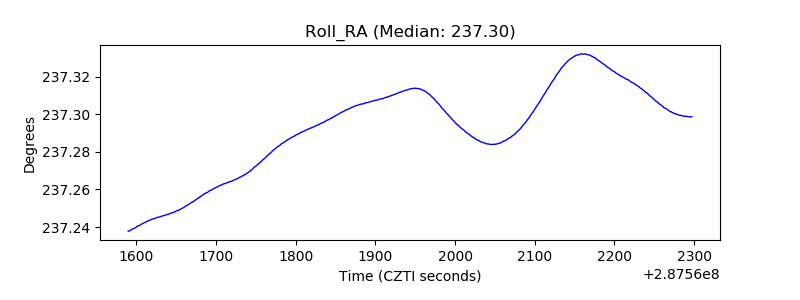 |
| Veto Counter | 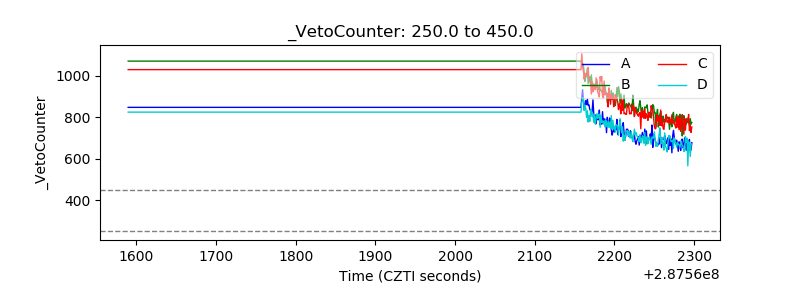 |