| Param | Original file | Final file |
|---|---|---|
| Filename | modeM0/AS1A05_019T01_9000002718cztM0_level2.fits | modeM0/AS1A05_019T01_9000002718cztM0_level2_quad_clean.evt |
| Size (bytes) | 1,568,934,720 | 1,486,647,360 |
| Size | 1.5 GB | 1.4 GB |
| Events in quadrant A | 9,760,158 | 9,031,408 |
| Events in quadrant B | 9,377,374 | 9,037,975 |
| Events in quadrant C | 9,316,098 | 8,396,833 |
| Events in quadrant D | 8,172,492 | 7,669,080 |
| Mode M9 | |||
|---|---|---|---|
| Quadrant | BADHDUFLAG | Total packets | Discarded packets |
| A | 0 | 259 | 0 |
| B | 0 | 259 | 0 |
| C | 0 | 259 | 0 |
| D | 0 | 259 | 0 |
| Mode M0 | |||
|---|---|---|---|
| Quadrant | BADHDUFLAG | Total packets | Discarded packets |
| A | 0 | 344505 | 0 |
| B | 0 | 338066 | 0 |
| C | 0 | 330923 | 0 |
| D | 0 | 397671 | 0 |
| Mode SS | |||
|---|---|---|---|
| Quadrant | BADHDUFLAG | Total packets | Discarded packets |
| A | 0 | 3238 | 0 |
| B | 0 | 3238 | 0 |
| C | 0 | 3238 | 0 |
| D | 0 | 3238 | 0 |
| Quadrant | Total seconds | Saturated seconds | Saturation percentage |
|---|---|---|---|
| A | 158925 | 2639 | 1.660532% |
| B | 158925 | 2335 | 1.469246% |
| C | 158925 | 2314 | 1.456033% |
| D | 158925 | 5137 | 3.232342% |
Noise dominated data is calculated using 1-second bins in cleaned event files. If a bin has >2000 counts, and if more than 50% of those come from <1% of pixels, then it is considered to be noise-dominated and hence unusable.
| Quadrant | # 1 sec bins | Bins with >0 counts | Bins with >2000 counts | High rate bins dominated by noise | Noise dominated (total time) | Noise dominated (detector-on time) | Marked lightcurve |
|---|---|---|---|---|---|---|---|
| A | 184840 | 158922 | 0 | 0 | 0.00% | 0.00% |  |
| B | 184840 | 158924 | 0 | 0 | 0.00% | 0.00% |  |
| C | 184840 | 158926 | 0 | 0 | 0.00% | 0.00% | 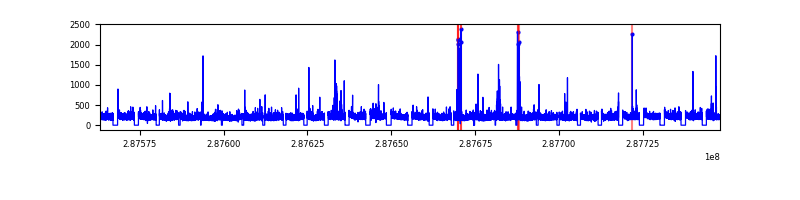 |
| D | 184839 | 158887 | 0 | 0 | 0.00% | 0.00% | 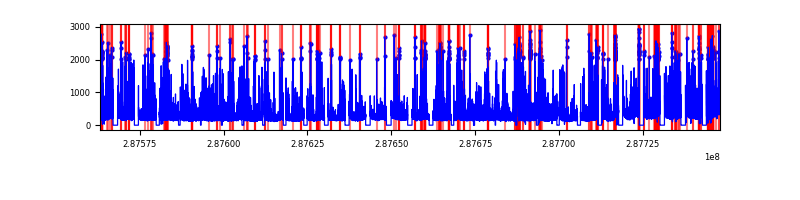 |
Top three noisy pixels from each quadrant. If the there are fewer than three noisy pixels in the level2.evt file, extra rows are filled as -1
| Pixel properties | Quadrant properties | ||||||
|---|---|---|---|---|---|---|---|
| Quadrant | DetID | PixID | Counts | Sigma | Mean | Median | Sigma |
| A | 0 | 29 | 9101 | 10.8 | 2541 | 2381 | 622.3 |
| A | 7 | 110 | 7795 | 8.7 | 2541 | 2381 | 622.3 |
| A | 9 | 19 | 7242 | 7.81 | 2541 | 2381 | 622.3 |
| B | 2 | 9 | 7667 | 10.9 | 2475 | 2366 | 486.2 |
| B | 2 | 8 | 6403 | 8.3 | 2475 | 2366 | 486.2 |
| B | 14 | 254 | 6077 | 7.63 | 2475 | 2366 | 486.2 |
| C | 12 | 241 | 6433 | 6.61 | 2461 | 2292 | 626.7 |
| C | 3 | 126 | 6346 | 6.47 | 2461 | 2292 | 626.7 |
| C | 2 | 191 | 6253 | 6.32 | 2461 | 2292 | 626.7 |
| D | 10 | 190 | 6129 | 6.55 | 2328 | 2115 | 613.2 |
| D | 3 | 14 | 5906 | 6.18 | 2328 | 2115 | 613.2 |
| D | 6 | 231 | 5783 | 5.98 | 2328 | 2115 | 613.2 |
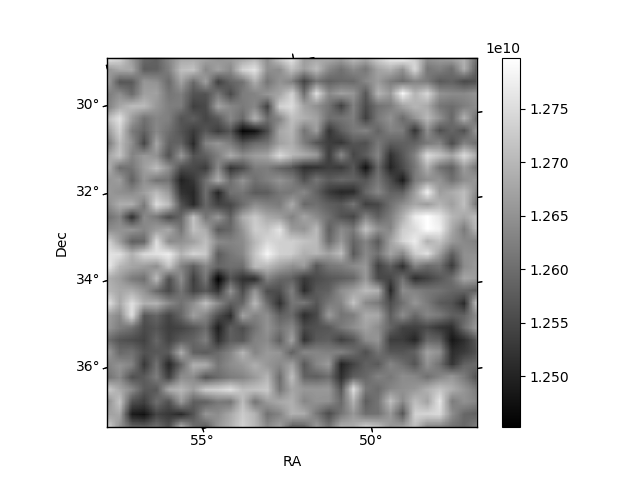
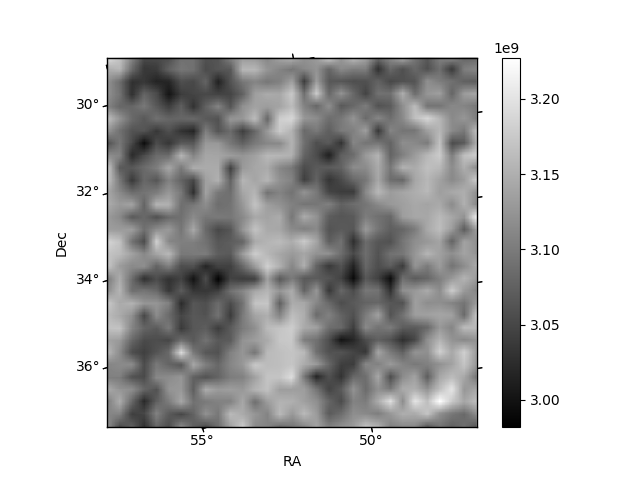
Histogram calculated using DETX and DETY for each event in the final _common_clean file
| Quadrant A | 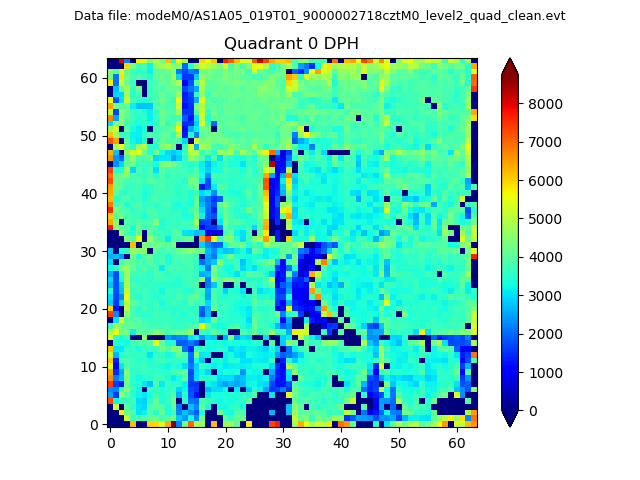 |
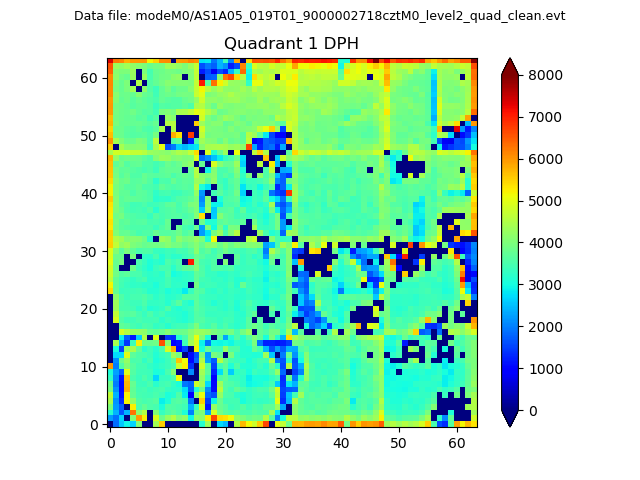 |
Quadrant B |
|---|---|---|---|
| Quadrant D |  |
 |
Quadrant C |
| Plot type | Count rate plots | Images |
|---|---|---|
| Comparison with Poisson distribution Blue bars denote a histogram of data divided into 1 sec bins. Red curve is a Poisson curve with rate = median count rate of data. |
 |
 |
| Quadrant-wise count rates Data is divided into 100 sec bins |
 |
|
| Module-wise count rates for Quadrant A Data is divided into 100 sec bins |
 |
 |
| Module-wise count rates for Quadrant B Data is divided into 100 sec bins |
 |
 |
| Module-wise count rates for Quadrant C Data is divided into 100 sec bins |
 |
 |
| Module-wise count rates for Quadrant D Data is divided into 100 sec bins |
 |
 |
| Parameter | Plot |
|---|---|
| CZT HV Monitor |  |
| D_VDD |  |
| Temperature 1 |  |
| Veto HV Monitor |  |
| Veto LLD |  |
| Alpha Counter |  |
| _CPM_Rate | 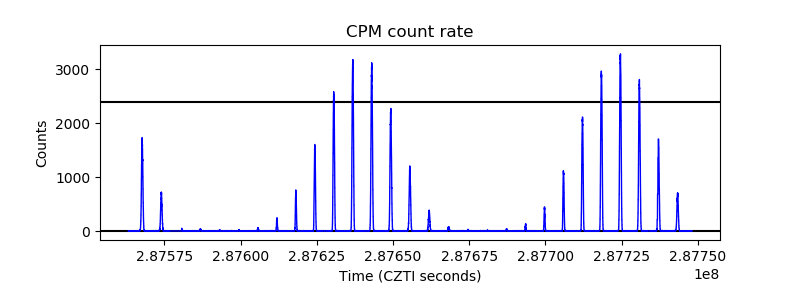 |
| CZT Counter |  |
| +2.5 Volts monitor |  |
| +5 Volts monitor |  |
| _ROLL_ROT |  |
| _Roll_DEC |  |
| _Roll_RA | 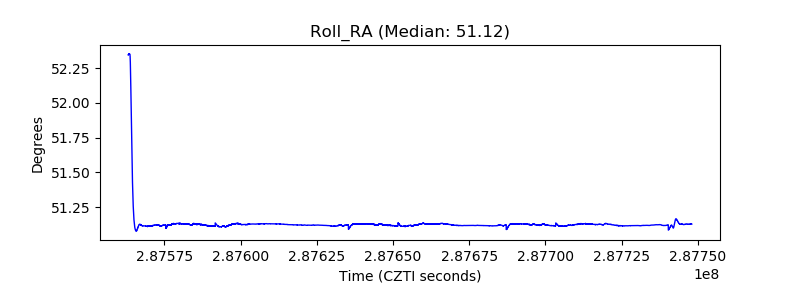 |
| Veto Counter | 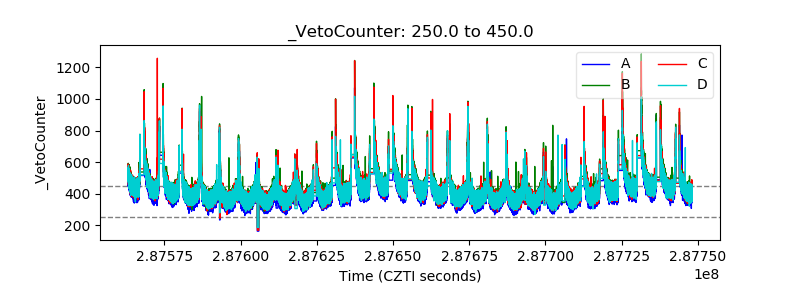 |