| Param | Original file | Final file |
|---|---|---|
| Filename | modeM0/AS1A05_019T01_9000002718_18237cztM0_level2.evt | modeM0/AS1A05_019T01_9000002718_18237cztM0_level2_quad_clean.evt |
| Size (bytes) | 19,900,800 | 2,090,880 |
| Size | 19.0 MB | 2.0 MB |
| Events in quadrant A | 130,982 | 9,549 |
| Events in quadrant B | 129,226 | 9,765 |
| Events in quadrant C | 128,504 | 9,129 |
| Events in quadrant D | 193,082 | 8,246 |
| Mode M0 | |||
|---|---|---|---|
| Quadrant | BADHDUFLAG | Total packets | Discarded packets |
| A | 0 | 510 | 0 |
| B | 0 | 505 | 0 |
| C | 0 | 511 | 0 |
| D | 0 | 740 | 4 |
| Mode SS | |||
|---|---|---|---|
| Quadrant | BADHDUFLAG | Total packets | Discarded packets |
| A | 0 | 6 | 0 |
| B | 0 | 6 | 0 |
| C | 0 | 6 | 0 |
| D | 0 | 6 | 0 |
| Quadrant | Total seconds | Saturated seconds | Saturation percentage |
|---|---|---|---|
| A | 250 | 1 | 0.400000% |
| B | 250 | 0 | 0.000000% |
| C | 250 | 2 | 0.800000% |
| D | 249 | 14 | 5.622490% |
Noise dominated data is calculated using 1-second bins in cleaned event files. If a bin has >2000 counts, and if more than 50% of those come from <1% of pixels, then it is considered to be noise-dominated and hence unusable.
| Quadrant | # 1 sec bins | Bins with >0 counts | Bins with >2000 counts | High rate bins dominated by noise | Noise dominated (total time) | Noise dominated (detector-on time) | Marked lightcurve |
|---|---|---|---|---|---|---|---|
| A | 250 | 250 | 0 | 0 | 0.00% | 0.00% | 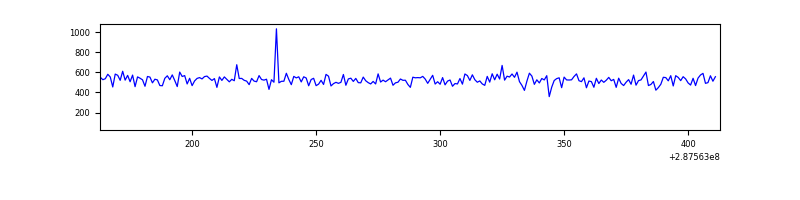 |
| B | 250 | 250 | 0 | 0 | 0.00% | 0.00% | 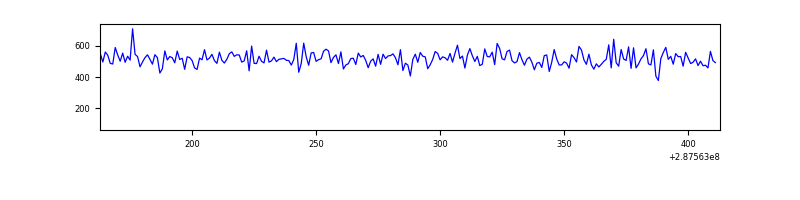 |
| C | 250 | 250 | 0 | 0 | 0.00% | 0.00% | 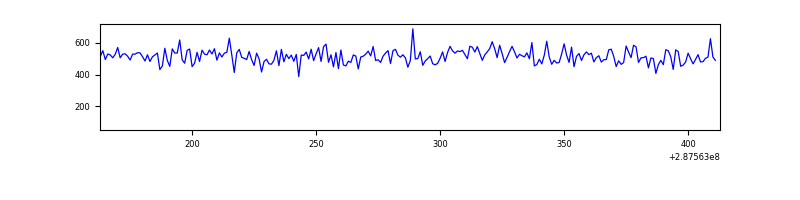 |
| D | 249 | 249 | 12 | 12 | 4.82% | 4.82% | 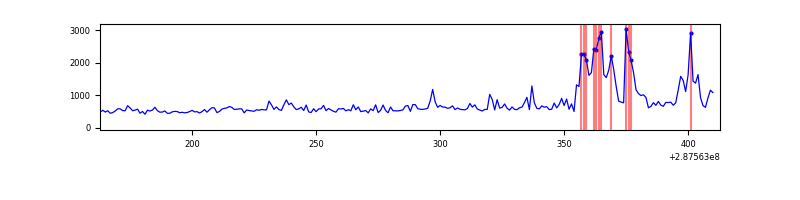 |
Top three noisy pixels from each quadrant. If the there are fewer than three noisy pixels in the level2.evt file, extra rows are filled as -1
| Pixel properties | Quadrant properties | ||||||
|---|---|---|---|---|---|---|---|
| Quadrant | DetID | PixID | Counts | Sigma | Mean | Median | Sigma |
| A | 11 | 29 | 542 | 57.5 | 33 | 33 | 8.9 |
| A | 0 | 226 | 287 | 28.69 | 33 | 33 | 8.9 |
| A | 3 | 137 | 251 | 24.63 | 33 | 33 | 8.9 |
| B | 12 | 111 | 714 | 80.92 | 33 | 32 | 8.4 |
| B | 11 | 111 | 657 | 74.16 | 33 | 32 | 8.4 |
| B | 14 | 111 | 601 | 67.51 | 33 | 32 | 8.4 |
| C | 14 | 238 | 5024 | 553.34 | 31 | 31 | 9.0 |
| C | 7 | 174 | 1237 | 133.65 | 31 | 31 | 9.0 |
| C | 13 | 61 | 256 | 24.94 | 31 | 31 | 9.0 |
| D | 1 | 52 | 75499 | 8002.05 | 31 | 29 | 9.4 |
| D | 2 | 234 | 795 | 81.22 | 31 | 29 | 9.4 |
| D | 14 | 226 | 289 | 27.57 | 31 | 29 | 9.4 |
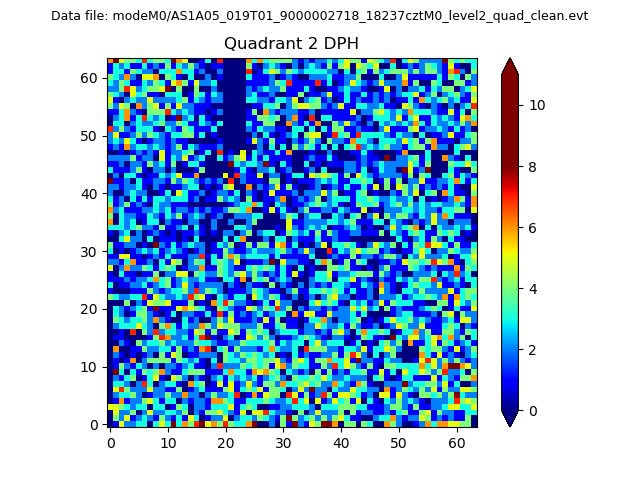
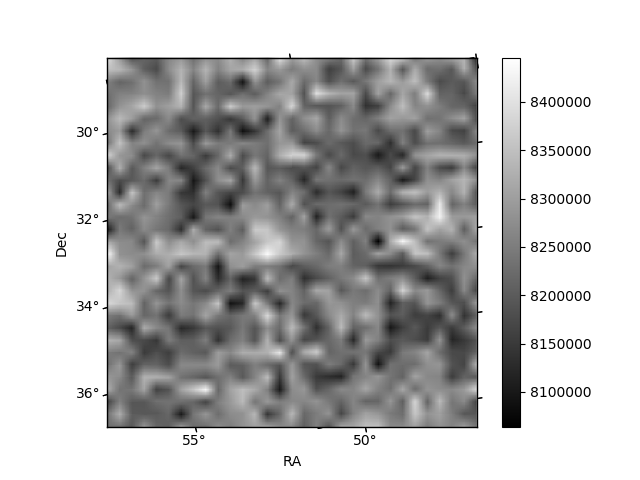
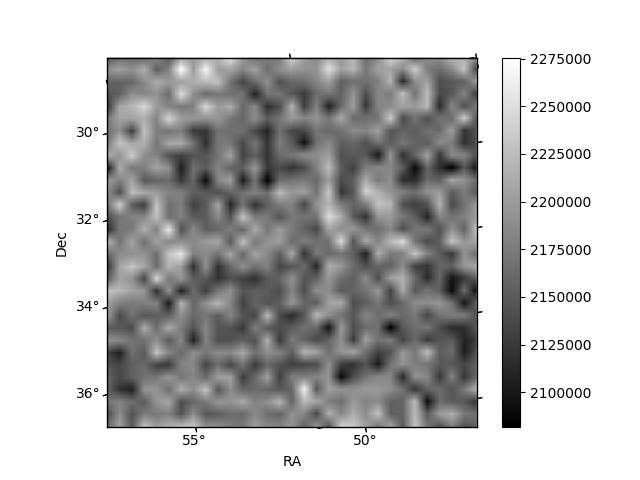
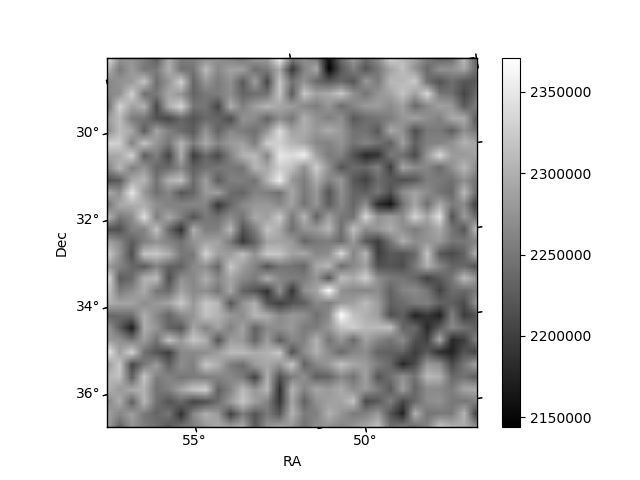
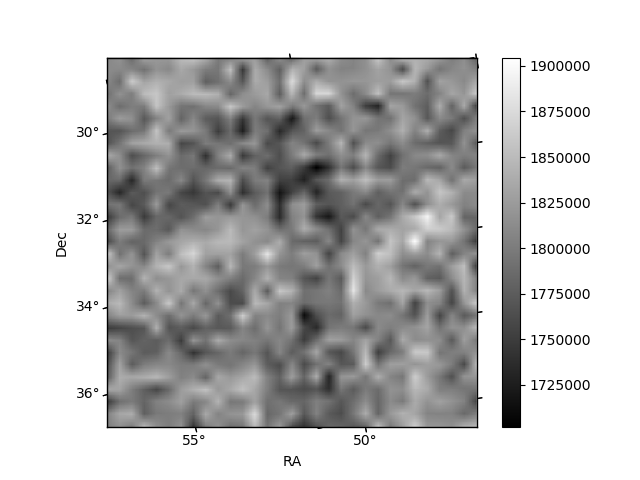
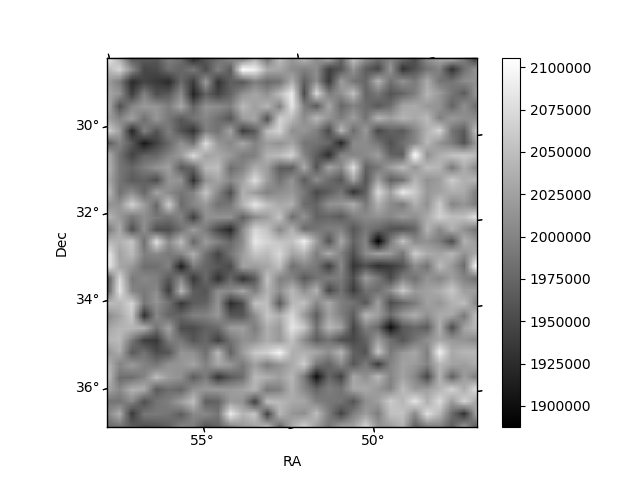
Histogram calculated using DETX and DETY for each event in the final _common_clean file
| Quadrant A | 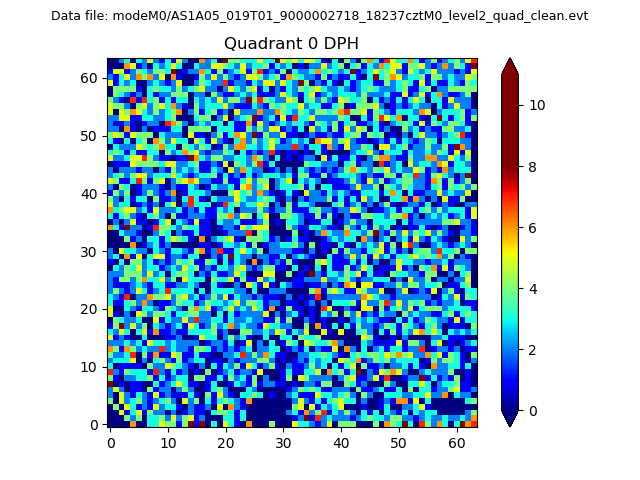 |
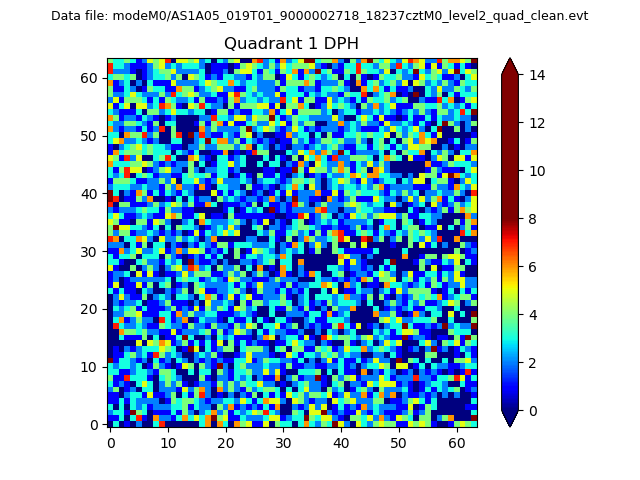 |
Quadrant B |
|---|---|---|---|
| Quadrant D | 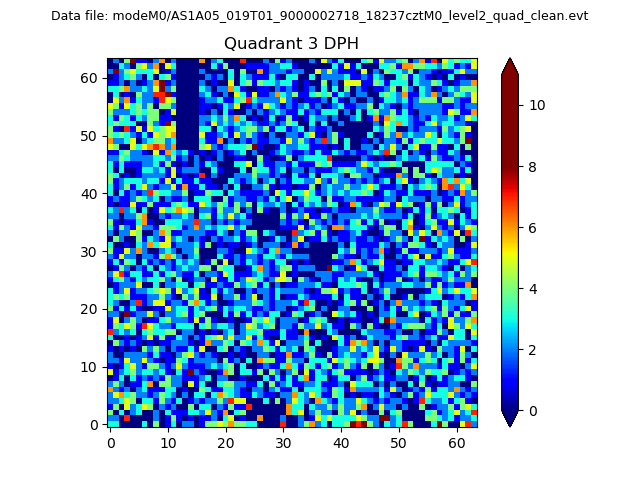 |
 |
Quadrant C |
| Plot type | Count rate plots | Images |
|---|---|---|
| Comparison with Poisson distribution Blue bars denote a histogram of data divided into 1 sec bins. Red curve is a Poisson curve with rate = median count rate of data. |
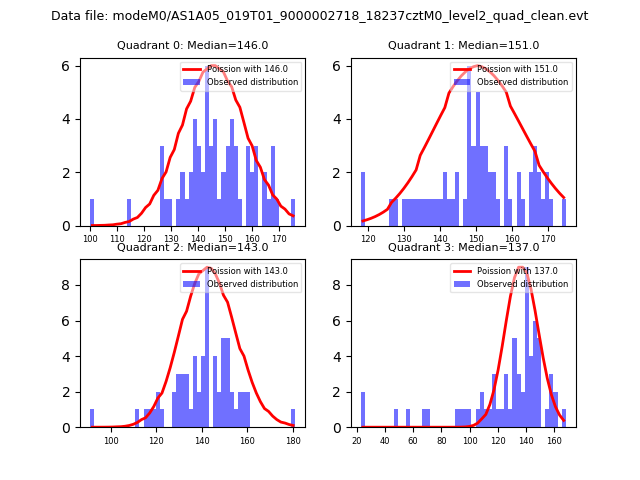 |
 |
| Quadrant-wise count rates Data is divided into 100 sec bins |
 |
|
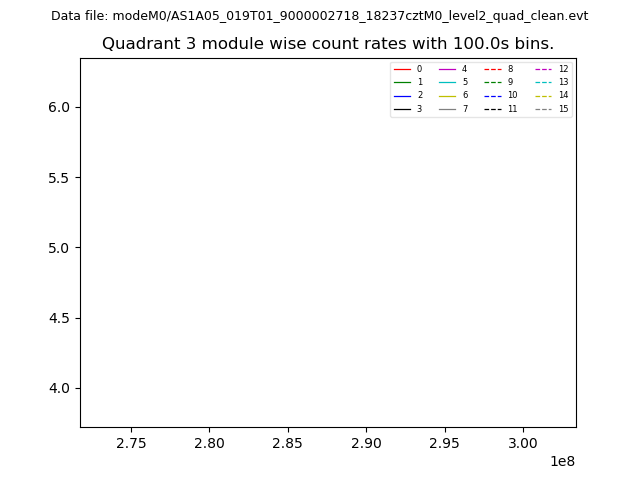
| Module-wise count rates for Quadrant A Data is divided into 100 sec bins |
 |
 |
| Module-wise count rates for Quadrant B Data is divided into 100 sec bins |
 |
 |
| Module-wise count rates for Quadrant C Data is divided into 100 sec bins |
 |
 |
| Module-wise count rates for Quadrant D Data is divided into 100 sec bins |
 |
 |
| Parameter | Plot |
|---|---|
| CZT HV Monitor | 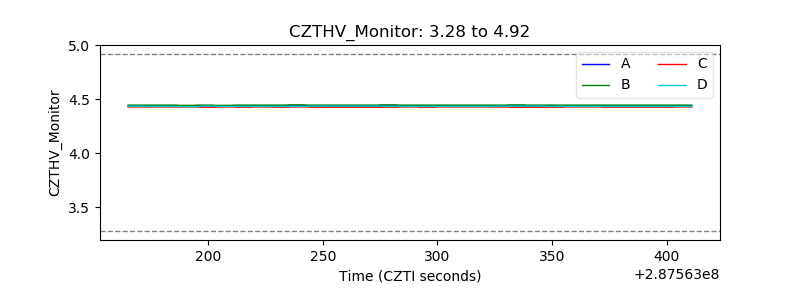 |
| D_VDD | 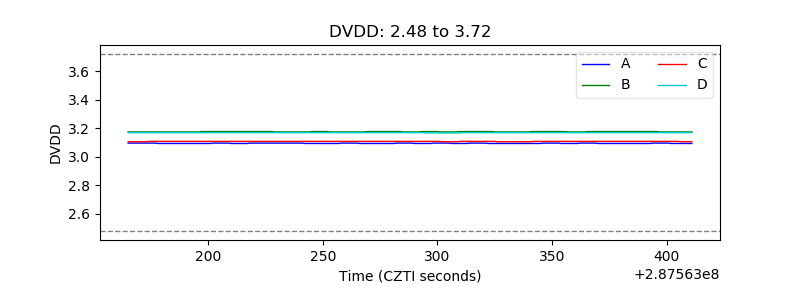 |
| Temperature 1 | 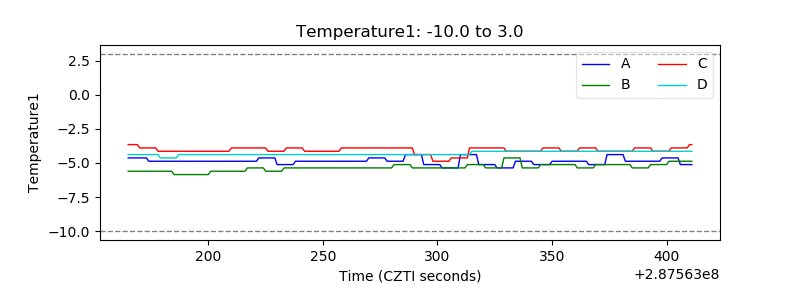 |
| Veto HV Monitor | 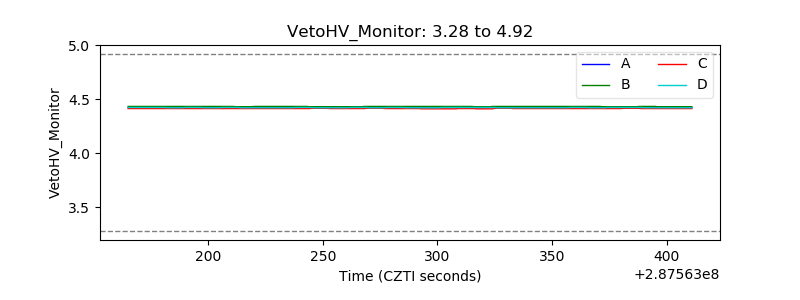 |
| Veto LLD | 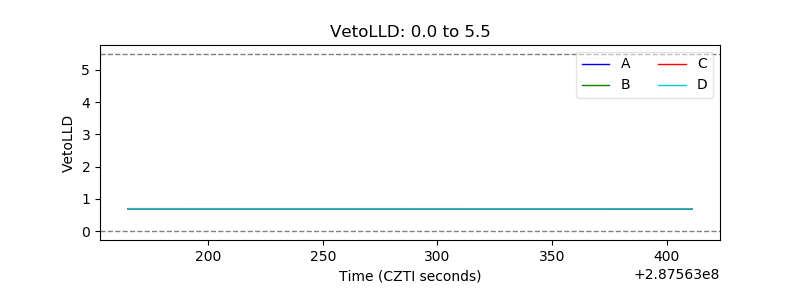 |
| Alpha Counter | 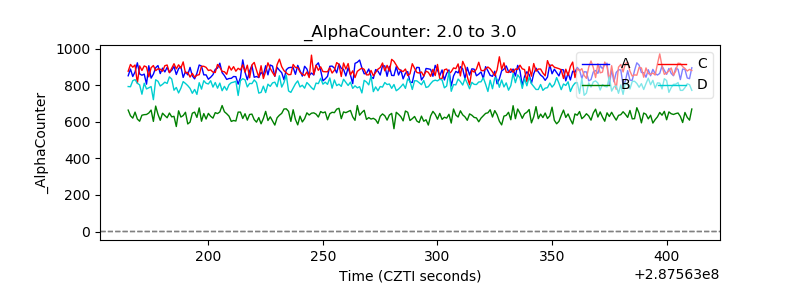 |
| _CPM_Rate | 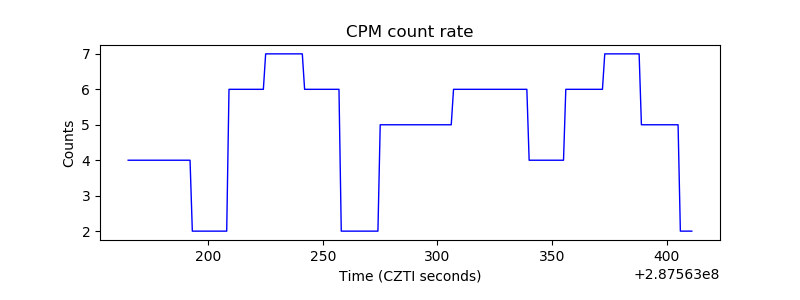 |
| CZT Counter | 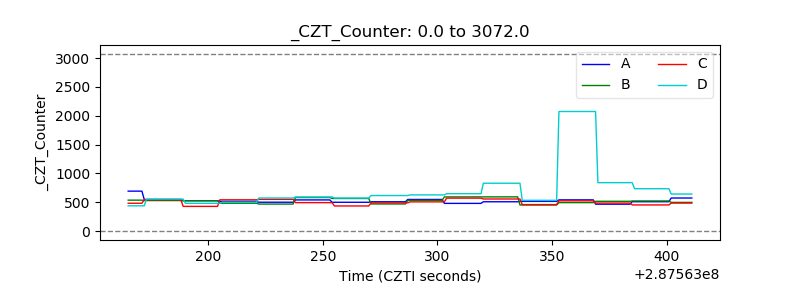 |
| +2.5 Volts monitor |  |
| +5 Volts monitor |  |
| _ROLL_ROT | 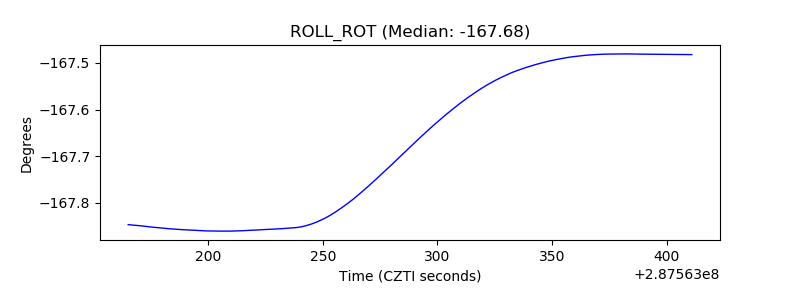 |
| _Roll_DEC | 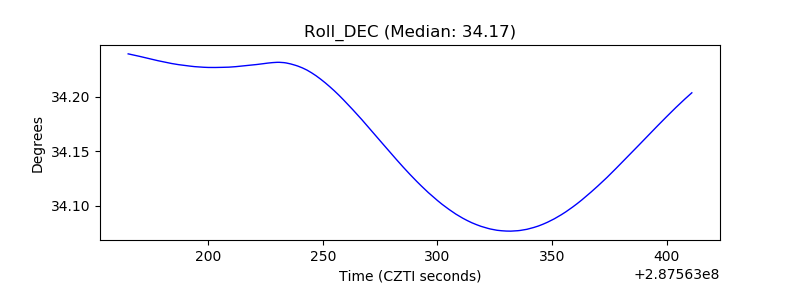 |
| _Roll_RA | 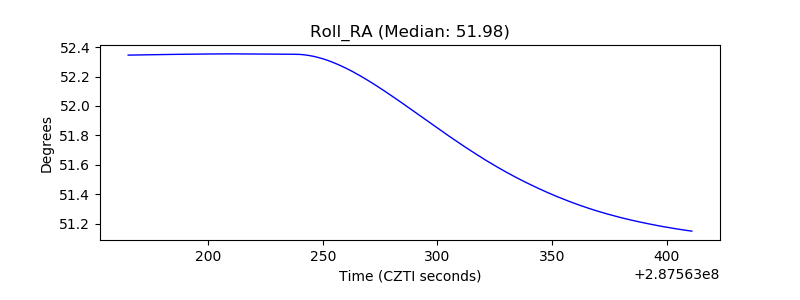 |
| Veto Counter | 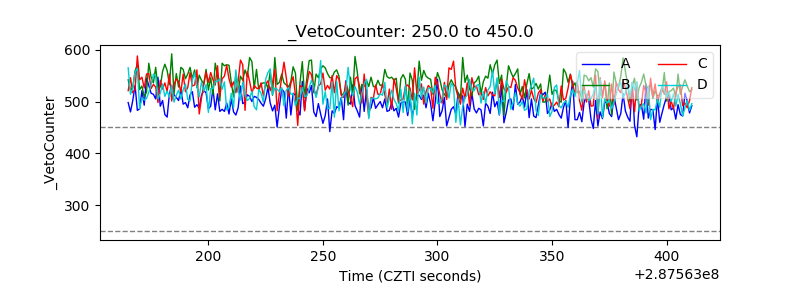 |