| Param | Original file | Final file |
|---|---|---|
| Filename | modeM0/AS1A05_019T01_9000002718_18238cztM0_level2.evt | modeM0/AS1A05_019T01_9000002718_18238cztM0_level2_quad_clean.evt |
| Size (bytes) | 416,753,280 | 87,503,040 |
| Size | 397.4 MB | 83.4 MB |
| Events in quadrant A | 2,973,992 | 587,123 |
| Events in quadrant B | 2,732,420 | 601,220 |
| Events in quadrant C | 2,598,631 | 561,198 |
| Events in quadrant D | 3,964,506 | 537,501 |
| Mode M9 | |||
|---|---|---|---|
| Quadrant | BADHDUFLAG | Total packets | Discarded packets |
| A | 0 | 14 | 0 |
| B | 0 | 14 | 0 |
| C | 0 | 14 | 0 |
| D | 0 | 14 | 0 |
| Mode M0 | |||
|---|---|---|---|
| Quadrant | BADHDUFLAG | Total packets | Discarded packets |
| A | 0 | 11968 | 1 |
| B | 0 | 11180 | 1 |
| C | 0 | 10909 | 1 |
| D | 0 | 15107 | 1 |
| Mode SS | |||
|---|---|---|---|
| Quadrant | BADHDUFLAG | Total packets | Discarded packets |
| A | 0 | 106 | 0 |
| B | 0 | 106 | 0 |
| C | 0 | 106 | 0 |
| D | 0 | 106 | 0 |
| Quadrant | Total seconds | Saturated seconds | Saturation percentage |
|---|---|---|---|
| A | 5175 | 149 | 2.879227% |
| B | 5175 | 93 | 1.797101% |
| C | 5175 | 79 | 1.526570% |
| D | 5175 | 398 | 7.690821% |
Noise dominated data is calculated using 1-second bins in cleaned event files. If a bin has >2000 counts, and if more than 50% of those come from <1% of pixels, then it is considered to be noise-dominated and hence unusable.
| Quadrant | # 1 sec bins | Bins with >0 counts | Bins with >2000 counts | High rate bins dominated by noise | Noise dominated (total time) | Noise dominated (detector-on time) | Marked lightcurve |
|---|---|---|---|---|---|---|---|
| A | 6550 | 5176 | 69 | 69 | 1.05% | 1.33% | 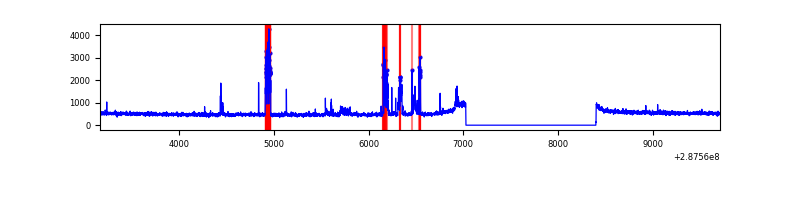 |
| B | 6550 | 5176 | 8 | 8 | 0.12% | 0.15% | 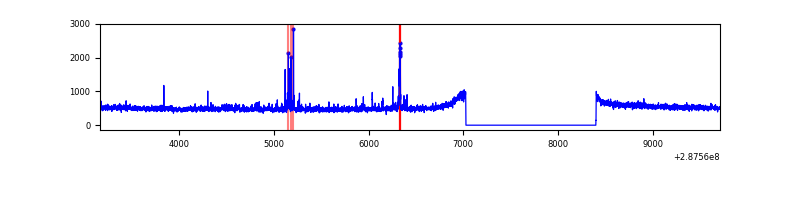 |
| C | 6550 | 5176 | 0 | 0 | 0.00% | 0.00% | 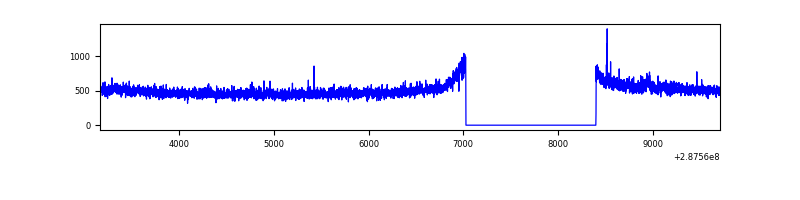 |
| D | 6550 | 5176 | 316 | 316 | 4.82% | 6.11% | 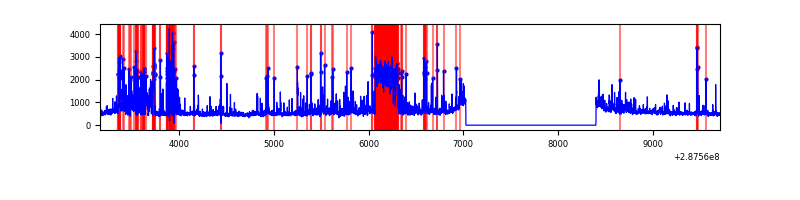 |
Top three noisy pixels from each quadrant. If the there are fewer than three noisy pixels in the level2.evt file, extra rows are filled as -1
| Pixel properties | Quadrant properties | ||||||
|---|---|---|---|---|---|---|---|
| Quadrant | DetID | PixID | Counts | Sigma | Mean | Median | Sigma |
| A | 15 | 174 | 351534 | 2577.62 | 680 | 669 | 136.1 |
| A | 4 | 2 | 6698 | 44.29 | 680 | 669 | 136.1 |
| A | 0 | 226 | 6108 | 39.96 | 680 | 669 | 136.1 |
| B | 0 | 197 | 31494 | 237.66 | 677 | 662 | 129.7 |
| B | 7 | 220 | 28186 | 212.16 | 677 | 662 | 129.7 |
| B | 12 | 111 | 14428 | 106.11 | 677 | 662 | 129.7 |
| C | 14 | 238 | 100786 | 672.03 | 637 | 642 | 149.0 |
| C | 7 | 174 | 4874 | 28.4 | 637 | 642 | 149.0 |
| C | 4 | 223 | 4817 | 28.01 | 637 | 642 | 149.0 |
| D | 1 | 52 | 1301179 | 8291.33 | 642 | 624 | 156.9 |
| D | 7 | 238 | 69403 | 438.48 | 642 | 624 | 156.9 |
| D | 13 | 104 | 50488 | 317.89 | 642 | 624 | 156.9 |
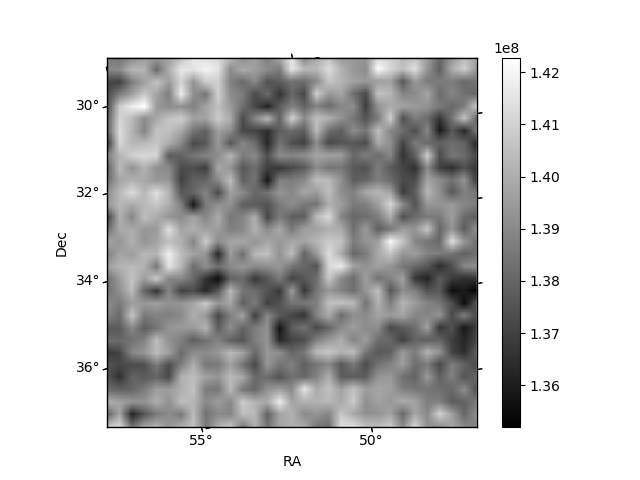
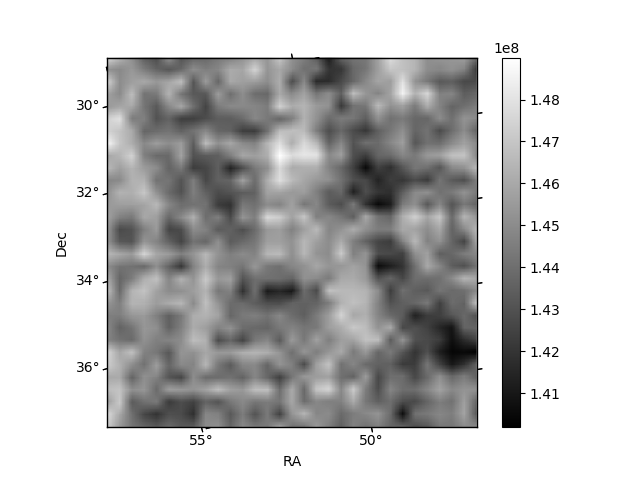
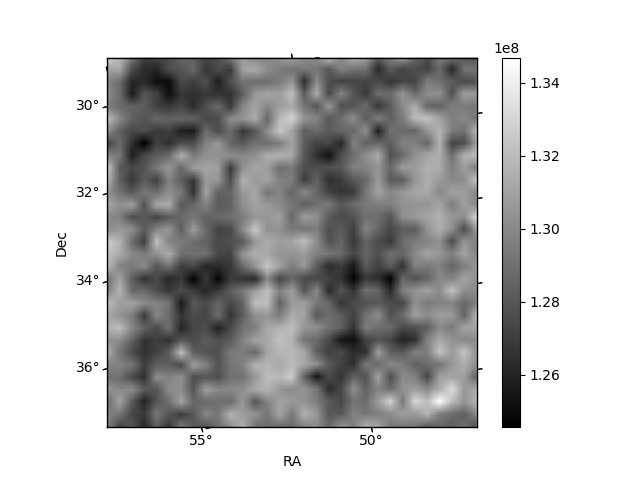
Histogram calculated using DETX and DETY for each event in the final _common_clean file
| Quadrant A | 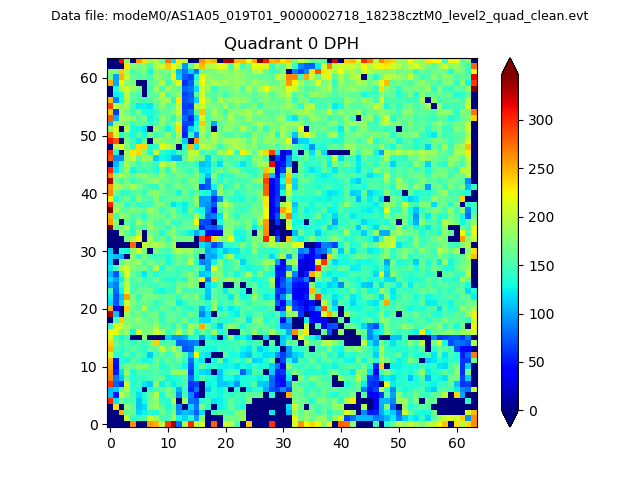 |
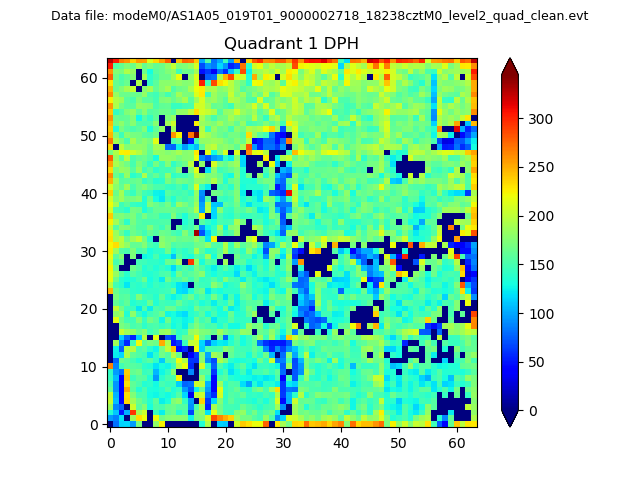 |
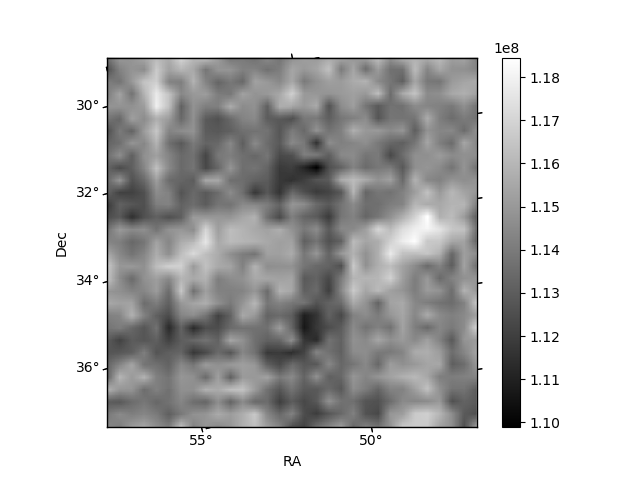
Quadrant B |
|---|---|---|---|
| Quadrant D | 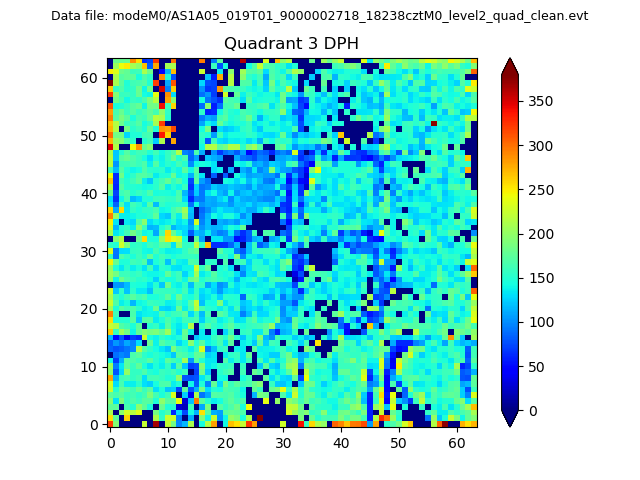 |
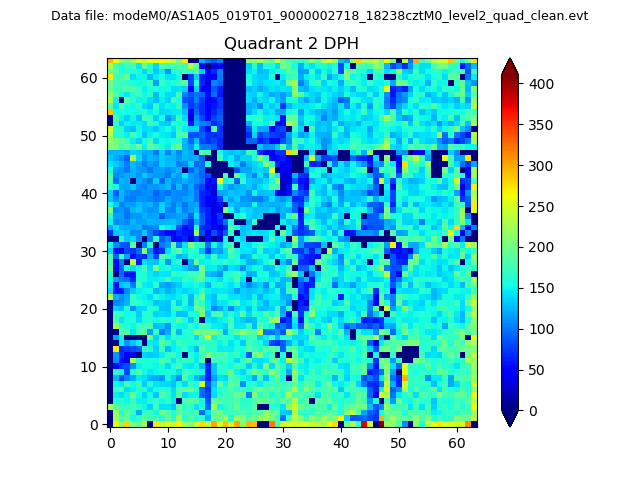 |
Quadrant C |
| Plot type | Count rate plots | Images |
|---|---|---|
| Comparison with Poisson distribution Blue bars denote a histogram of data divided into 1 sec bins. Red curve is a Poisson curve with rate = median count rate of data. |
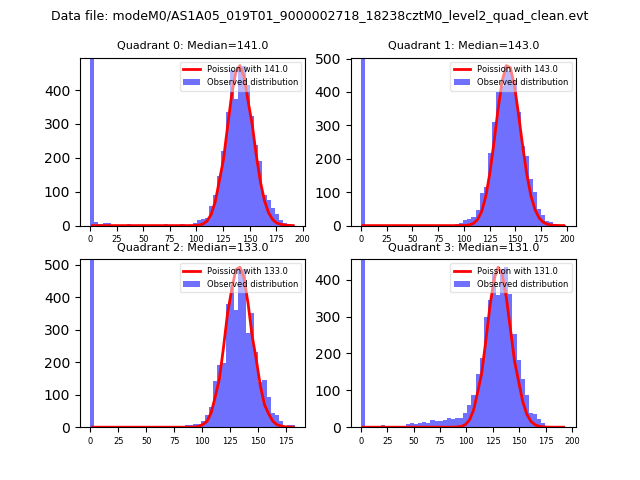 |
 |
| Quadrant-wise count rates Data is divided into 100 sec bins |
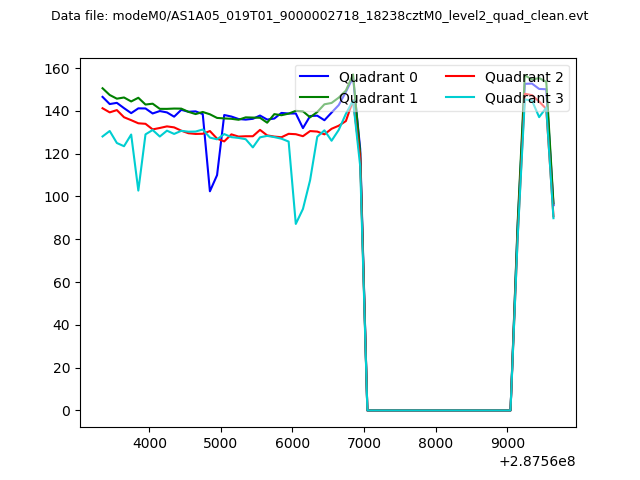 |
|
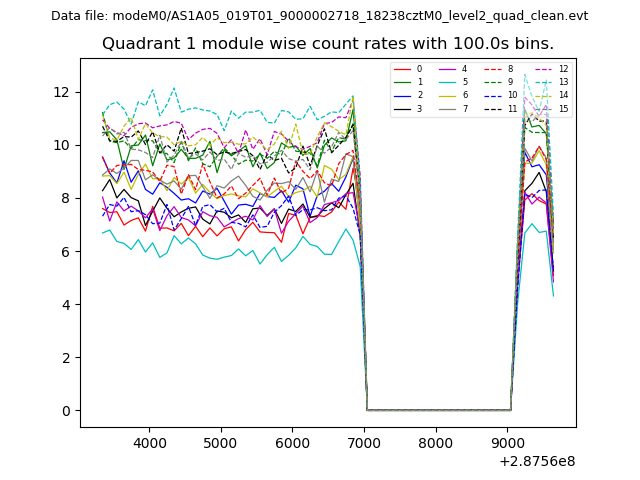
| Module-wise count rates for Quadrant A Data is divided into 100 sec bins |
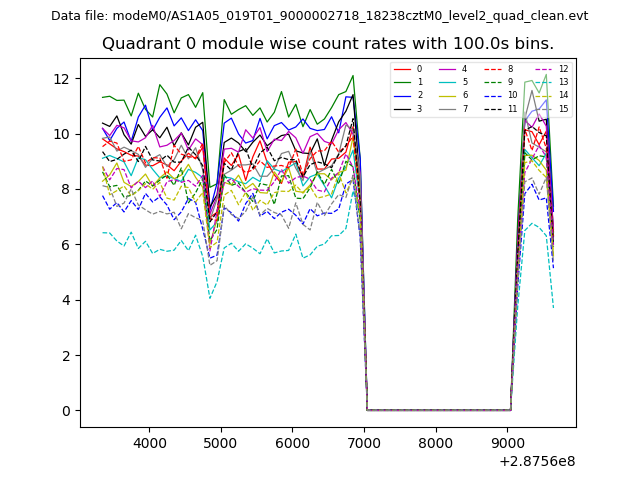 |
 |
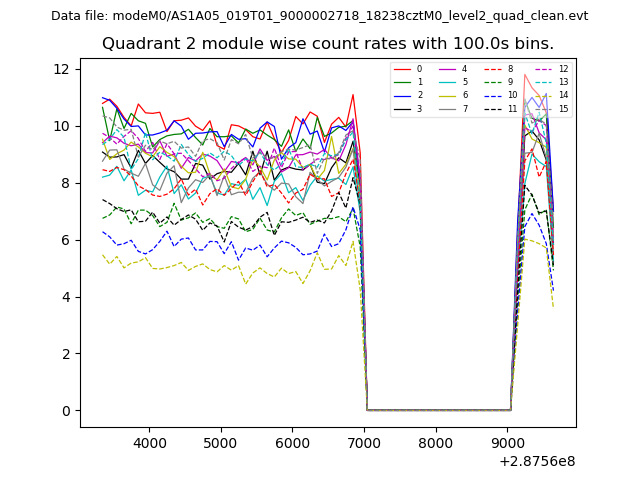
| Module-wise count rates for Quadrant B Data is divided into 100 sec bins |
 |
 |
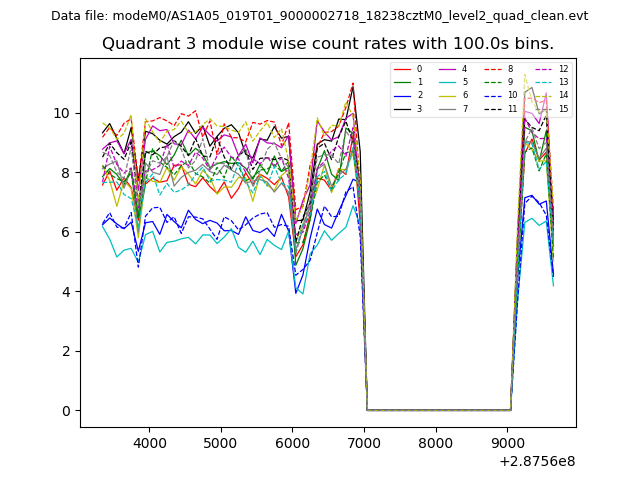
| Module-wise count rates for Quadrant C Data is divided into 100 sec bins |
 |
 |
| Module-wise count rates for Quadrant D Data is divided into 100 sec bins |
 |
 |
| Parameter | Plot |
|---|---|
| CZT HV Monitor | 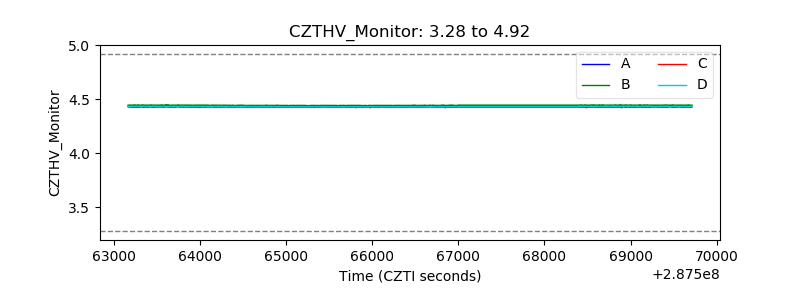 |
| D_VDD | 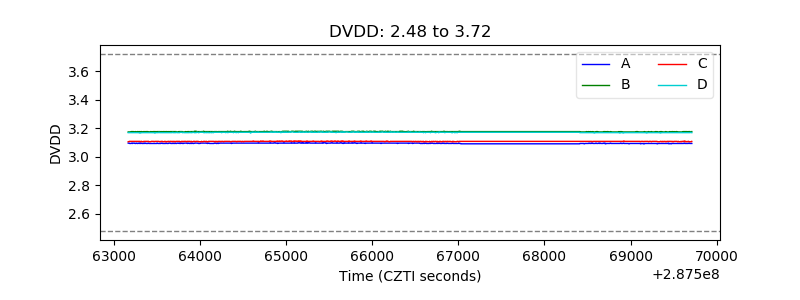 |
| Temperature 1 | 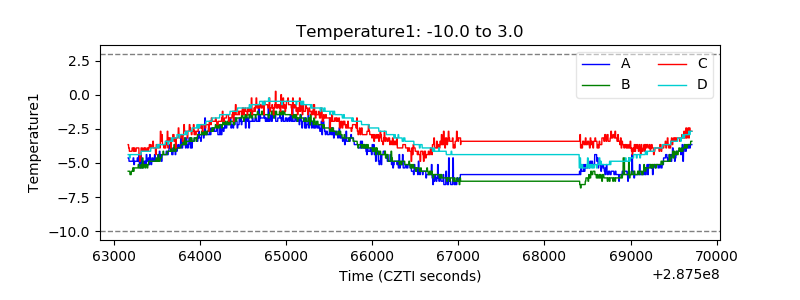 |
| Veto HV Monitor | 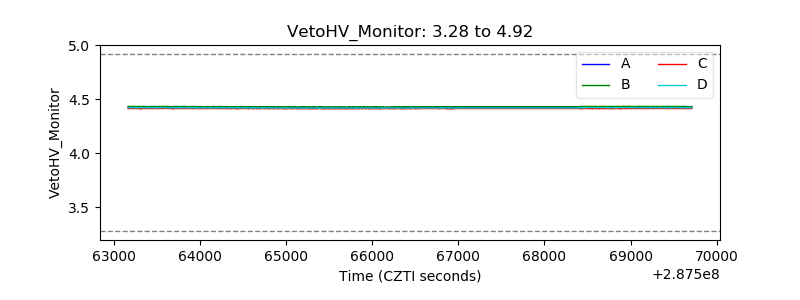 |
| Veto LLD | 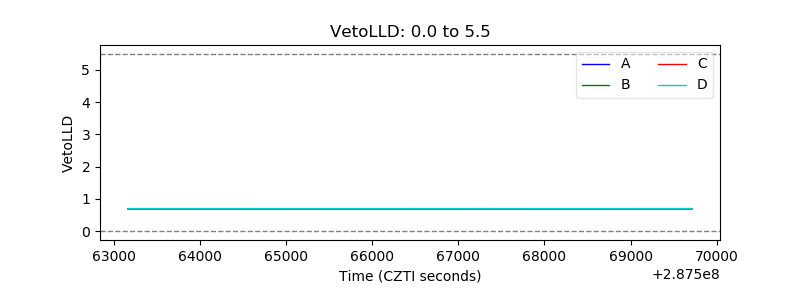 |
| Alpha Counter | 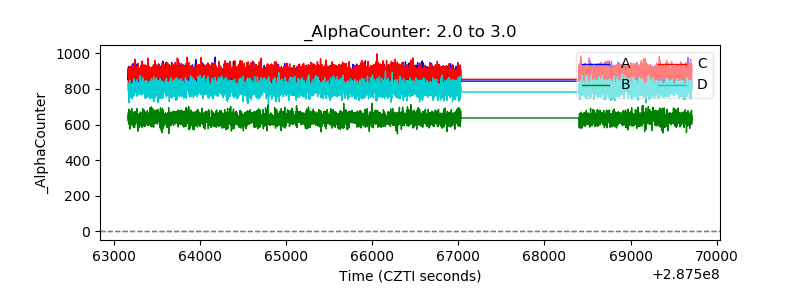 |
| _CPM_Rate | 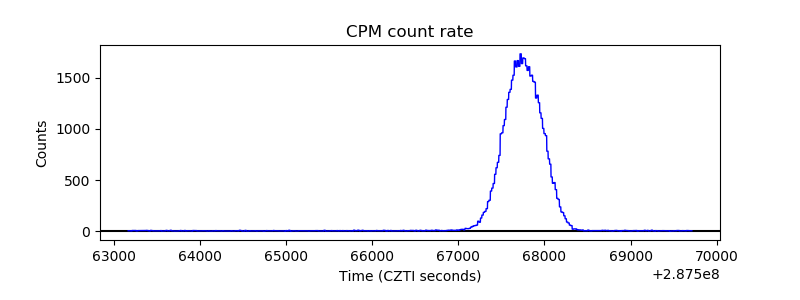 |
| CZT Counter | 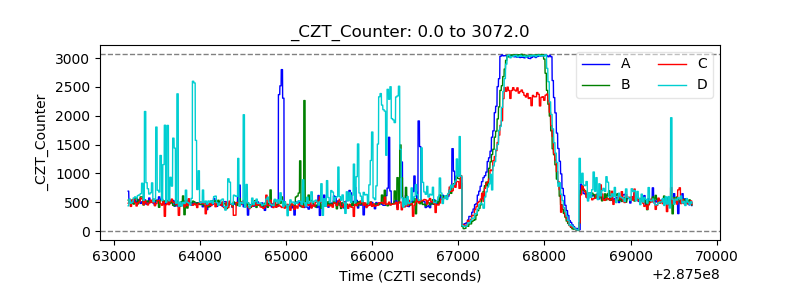 |
| +2.5 Volts monitor |  |
| +5 Volts monitor |  |
| _ROLL_ROT | 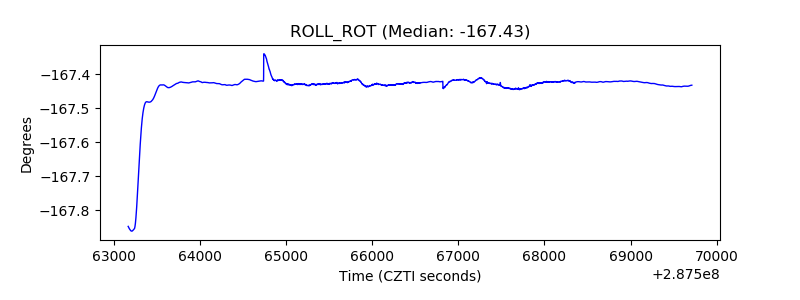 |
| _Roll_DEC | 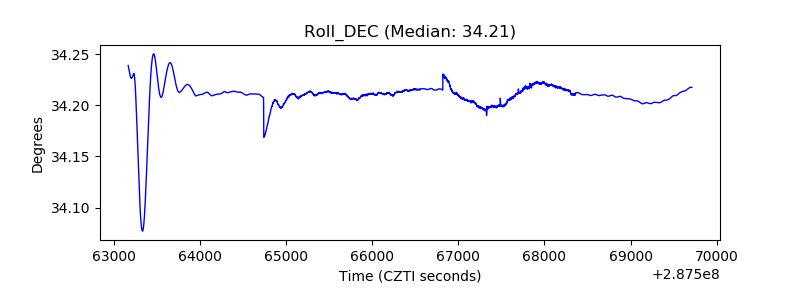 |
| _Roll_RA | 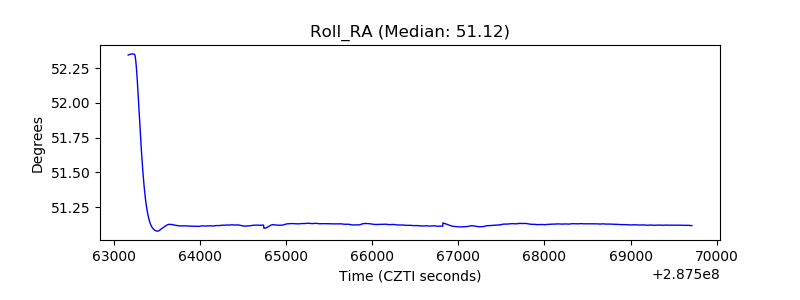 |
| Veto Counter | 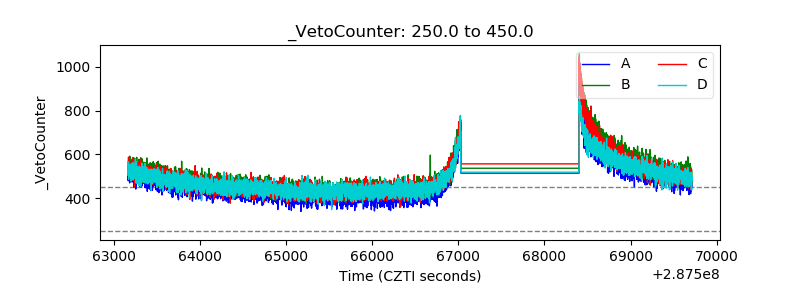 |