| Param | Original file | Final file |
|---|---|---|
| Filename | modeM0/AS1A05_019T01_9000002718_18240cztM0_level2.evt | modeM0/AS1A05_019T01_9000002718_18240cztM0_level2_quad_clean.evt |
| Size (bytes) | 432,204,480 | 97,801,920 |
| Size | 412.2 MB | 93.3 MB |
| Events in quadrant A | 3,215,037 | 649,493 |
| Events in quadrant B | 3,046,973 | 658,032 |
| Events in quadrant C | 2,916,083 | 618,386 |
| Events in quadrant D | 3,496,726 | 610,435 |
| Mode M9 | |||
|---|---|---|---|
| Quadrant | BADHDUFLAG | Total packets | Discarded packets |
| A | 0 | 9 | 0 |
| B | 0 | 9 | 0 |
| C | 0 | 9 | 0 |
| D | 0 | 9 | 0 |
| Mode M0 | |||
|---|---|---|---|
| Quadrant | BADHDUFLAG | Total packets | Discarded packets |
| A | 0 | 13401 | 1 |
| B | 0 | 12761 | 1 |
| C | 0 | 12524 | 1 |
| D | 0 | 14336 | 1 |
| Mode SS | |||
|---|---|---|---|
| Quadrant | BADHDUFLAG | Total packets | Discarded packets |
| A | 0 | 124 | 0 |
| B | 0 | 124 | 0 |
| C | 0 | 124 | 0 |
| D | 0 | 124 | 0 |
| Quadrant | Total seconds | Saturated seconds | Saturation percentage |
|---|---|---|---|
| A | 6095 | 205 | 3.363413% |
| B | 6096 | 102 | 1.673228% |
| C | 6096 | 91 | 1.492782% |
| D | 6096 | 186 | 3.051181% |
Noise dominated data is calculated using 1-second bins in cleaned event files. If a bin has >2000 counts, and if more than 50% of those come from <1% of pixels, then it is considered to be noise-dominated and hence unusable.
| Quadrant | # 1 sec bins | Bins with >0 counts | Bins with >2000 counts | High rate bins dominated by noise | Noise dominated (total time) | Noise dominated (detector-on time) | Marked lightcurve |
|---|---|---|---|---|---|---|---|
| A | 7035 | 6096 | 37 | 37 | 0.53% | 0.61% | 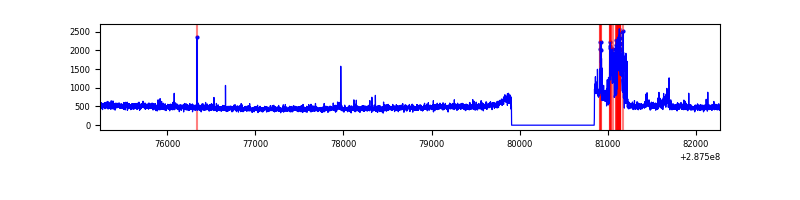 |
| B | 7036 | 6097 | 6 | 6 | 0.09% | 0.10% | 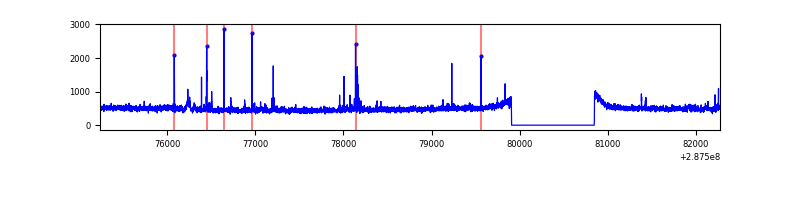 |
| C | 7036 | 6097 | 0 | 0 | 0.00% | 0.00% | 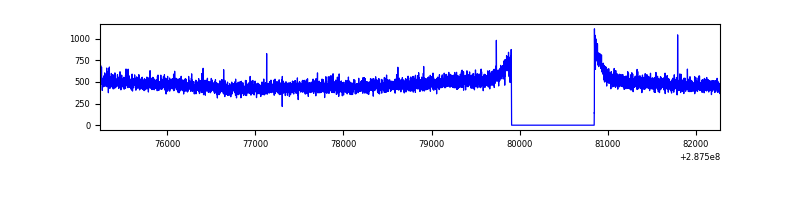 |
| D | 7036 | 6097 | 89 | 89 | 1.26% | 1.46% | 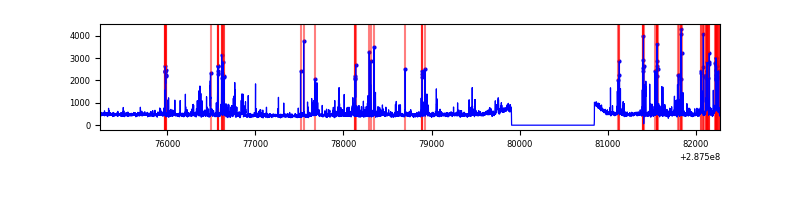 |
Top three noisy pixels from each quadrant. If the there are fewer than three noisy pixels in the level2.evt file, extra rows are filled as -1
| Pixel properties | Quadrant properties | ||||||
|---|---|---|---|---|---|---|---|
| Quadrant | DetID | PixID | Counts | Sigma | Mean | Median | Sigma |
| A | 15 | 174 | 284034 | 1852.85 | 757 | 742 | 152.9 |
| A | 4 | 2 | 9980 | 60.42 | 757 | 742 | 152.9 |
| A | 0 | 226 | 6602 | 38.33 | 757 | 742 | 152.9 |
| B | 0 | 198 | 25568 | 174.25 | 750 | 732 | 142.5 |
| B | 0 | 197 | 24734 | 168.4 | 750 | 732 | 142.5 |
| B | 7 | 220 | 22593 | 153.38 | 750 | 732 | 142.5 |
| C | 14 | 238 | 111011 | 657.57 | 715 | 720 | 167.7 |
| C | 4 | 223 | 9818 | 54.24 | 715 | 720 | 167.7 |
| C | 3 | 233 | 7939 | 43.04 | 715 | 720 | 167.7 |
| D | 1 | 52 | 550800 | 3058.68 | 731 | 709 | 179.8 |
| D | 10 | 70 | 67626 | 372.08 | 731 | 709 | 179.8 |
| D | 7 | 238 | 46614 | 255.25 | 731 | 709 | 179.8 |
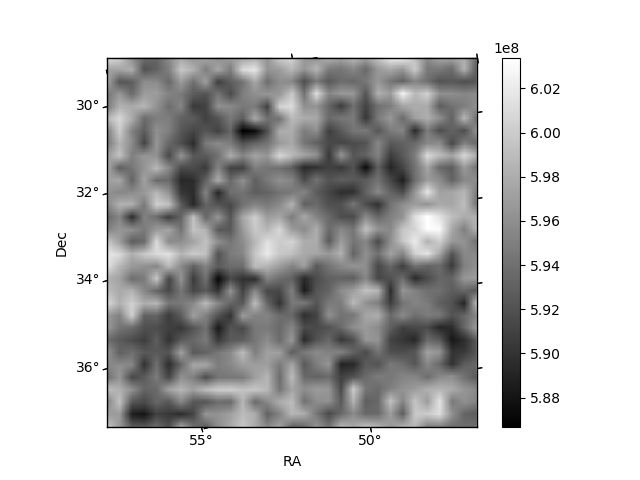
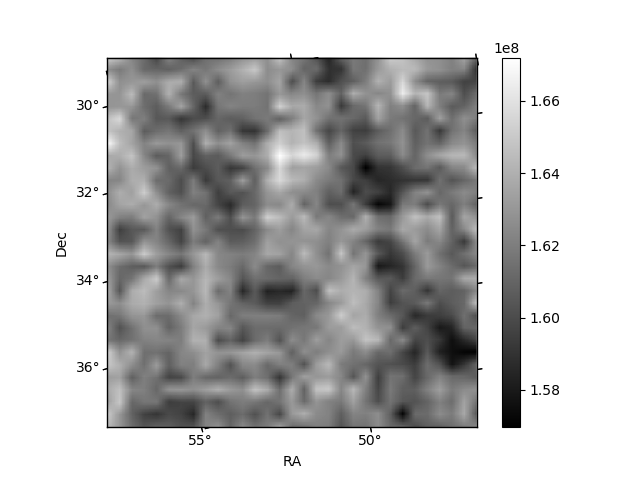
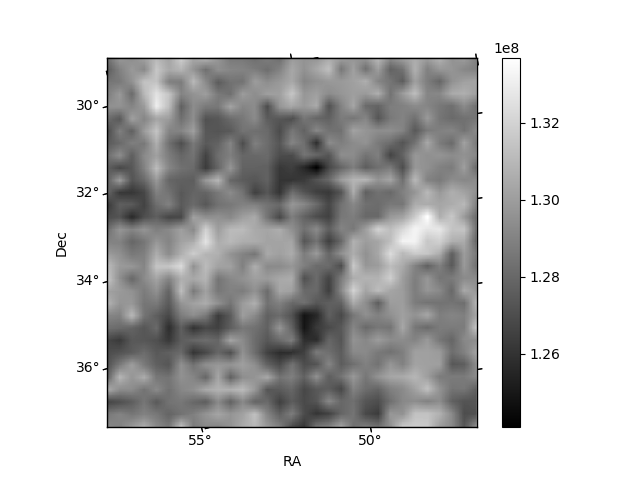
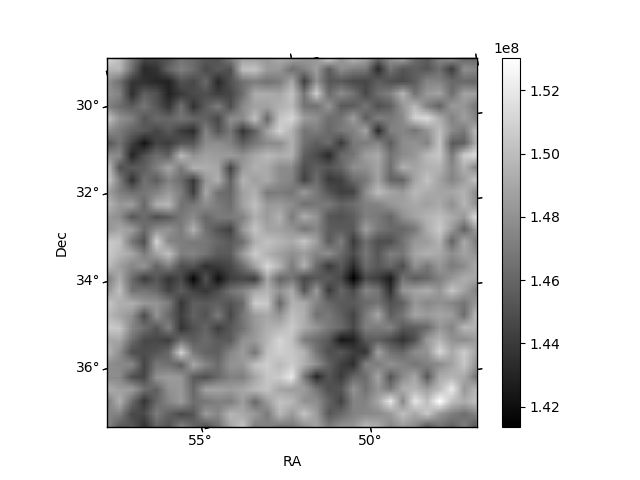
Histogram calculated using DETX and DETY for each event in the final _common_clean file
| Quadrant A | 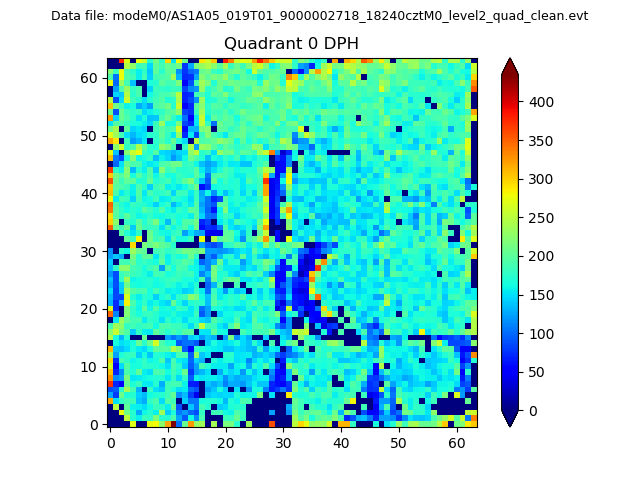 |
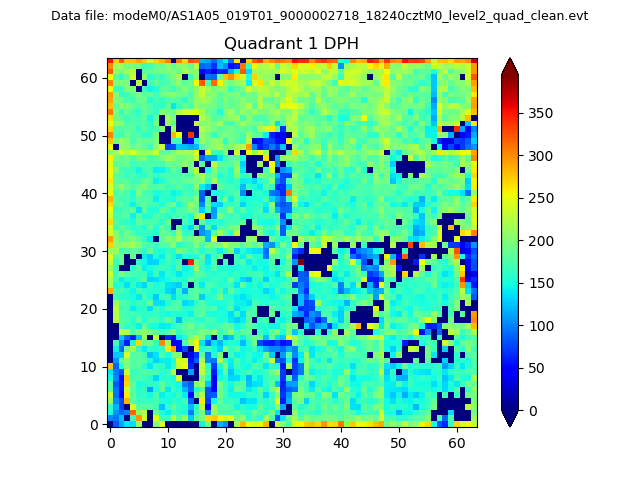 |
Quadrant B |
|---|---|---|---|
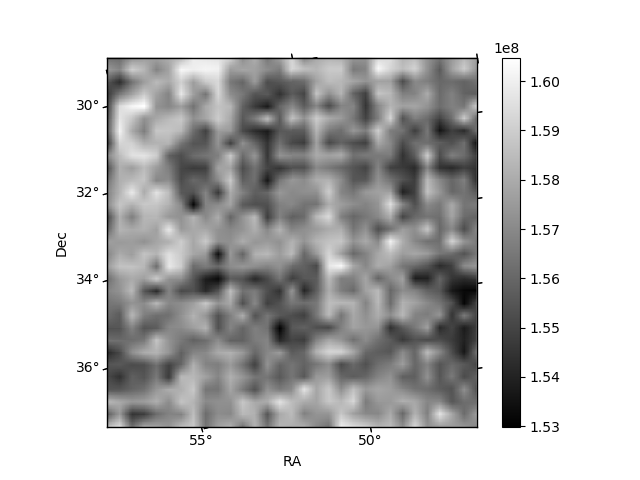
| Quadrant D | 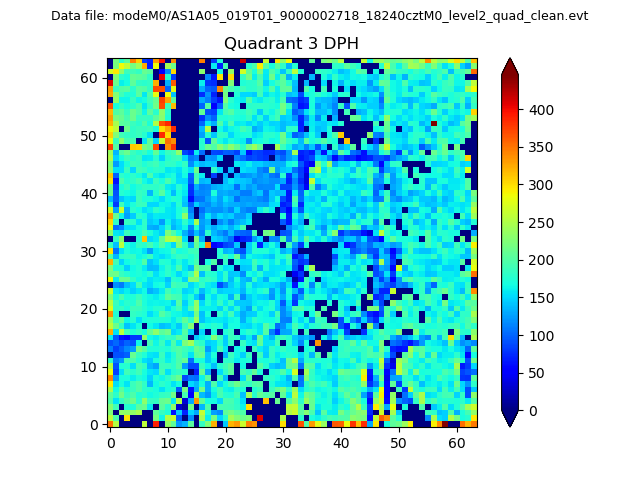 |
 |
Quadrant C |
| Plot type | Count rate plots | Images |
|---|---|---|
| Comparison with Poisson distribution Blue bars denote a histogram of data divided into 1 sec bins. Red curve is a Poisson curve with rate = median count rate of data. |
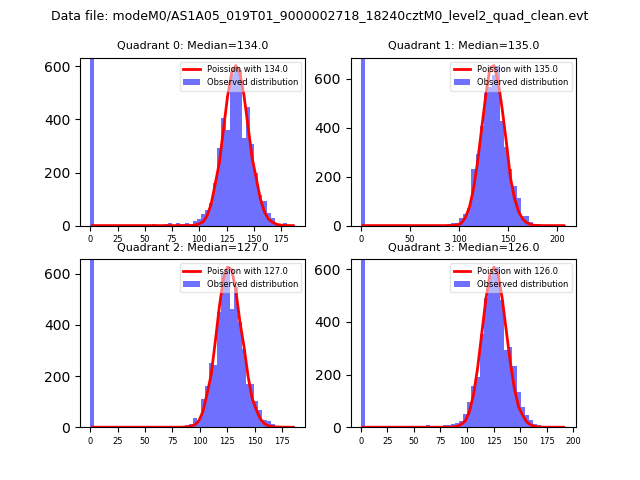 |
 |
| Quadrant-wise count rates Data is divided into 100 sec bins |
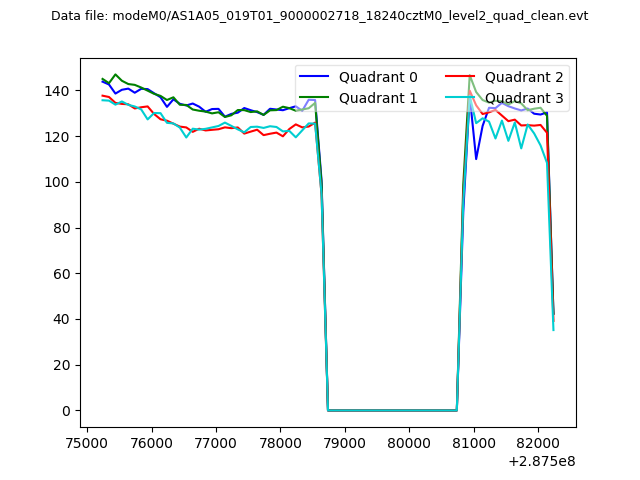 |
|
| Module-wise count rates for Quadrant A Data is divided into 100 sec bins |
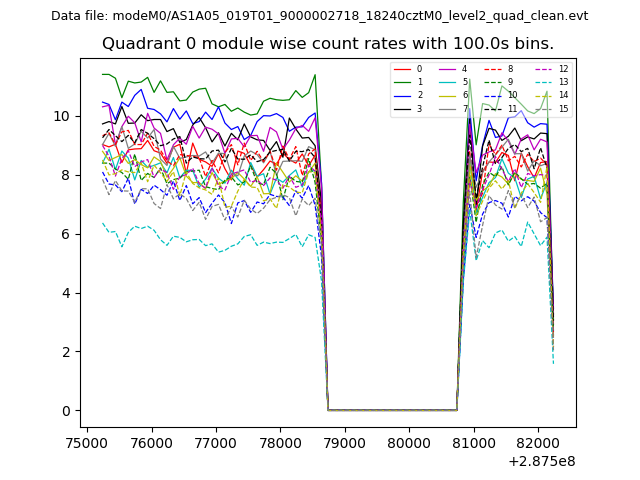 |
 |
| Module-wise count rates for Quadrant B Data is divided into 100 sec bins |
 |
 |
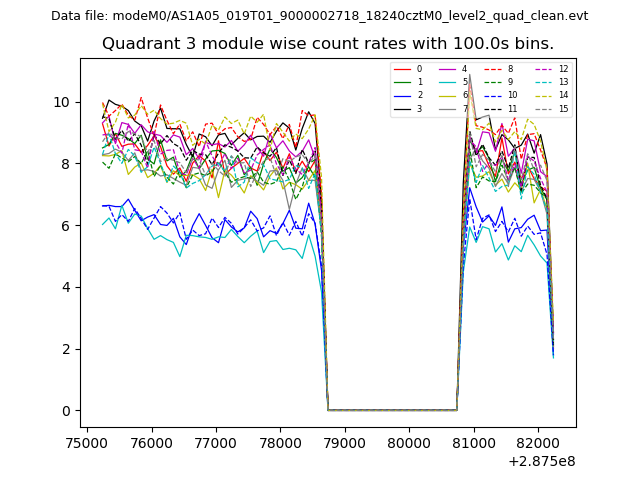
| Module-wise count rates for Quadrant C Data is divided into 100 sec bins |
 |
 |
| Module-wise count rates for Quadrant D Data is divided into 100 sec bins |
 |
 |
| Parameter | Plot |
|---|---|
| CZT HV Monitor | 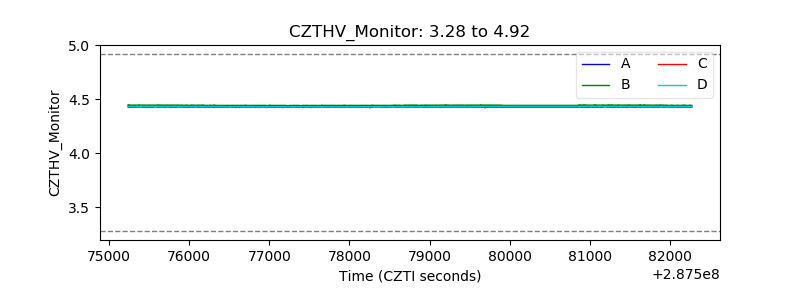 |
| D_VDD | 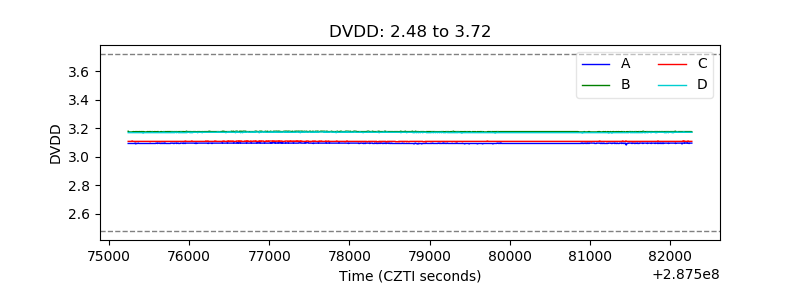 |
| Temperature 1 |  |
| Veto HV Monitor | 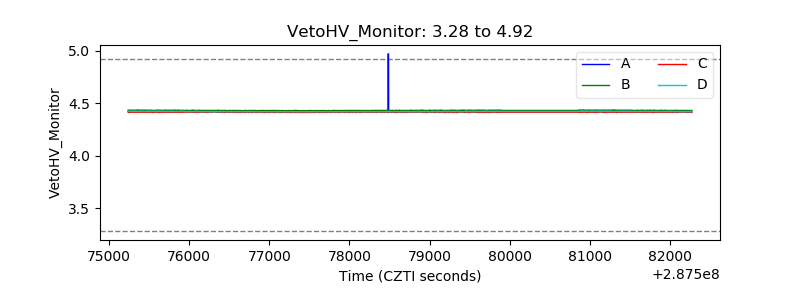 |
| Veto LLD | 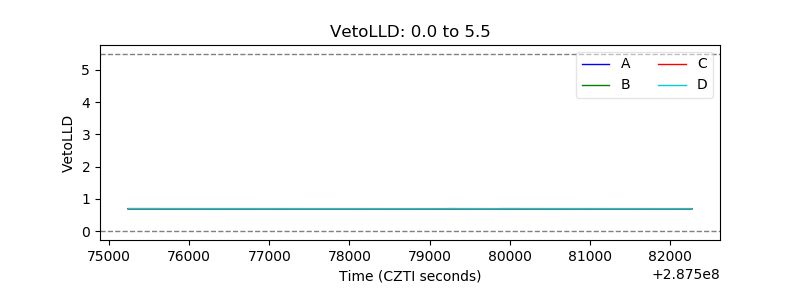 |
| Alpha Counter | 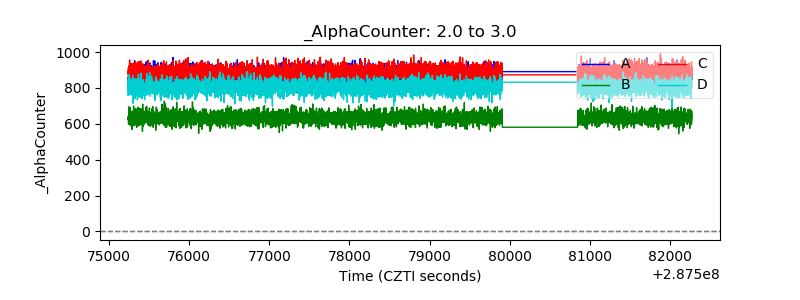 |
| _CPM_Rate | 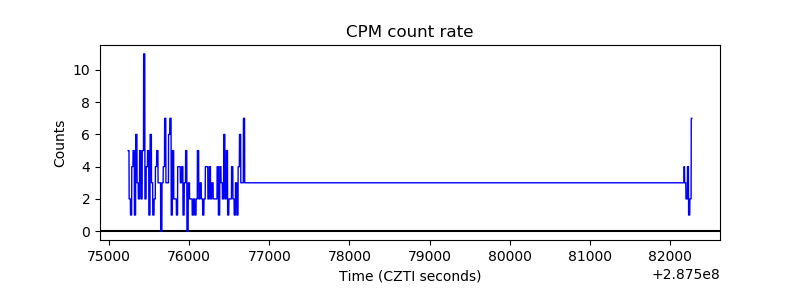 |
| CZT Counter |  |
| +2.5 Volts monitor |  |
| +5 Volts monitor | 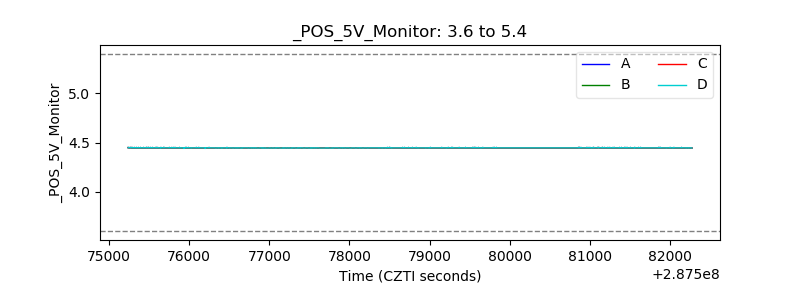 |
| _ROLL_ROT | 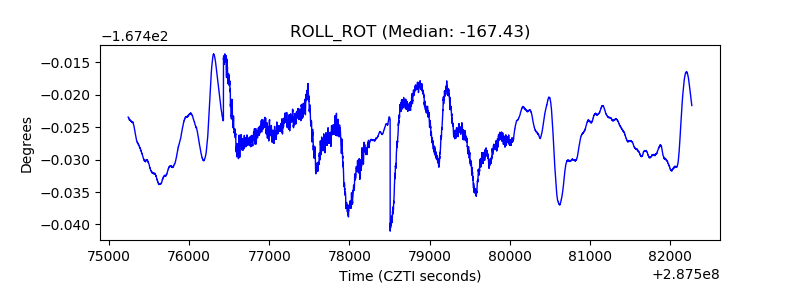 |
| _Roll_DEC | 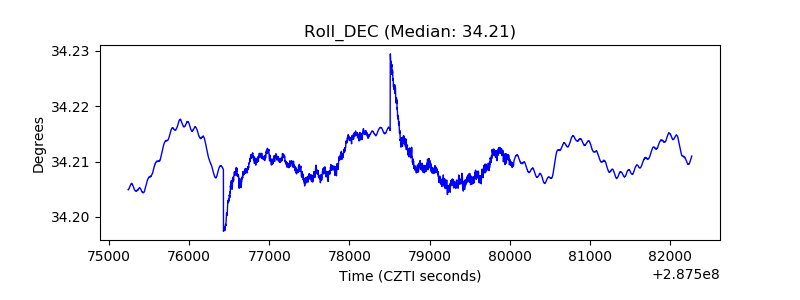 |
| _Roll_RA | 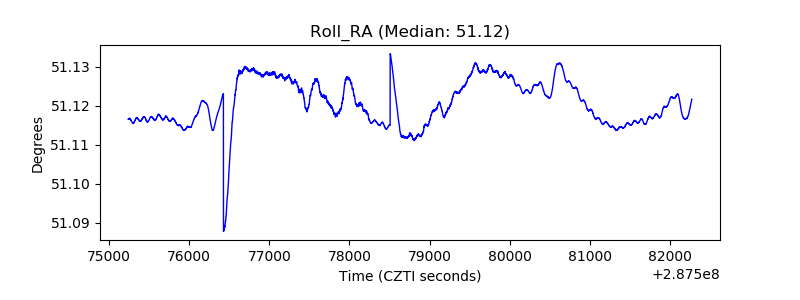 |
| Veto Counter | 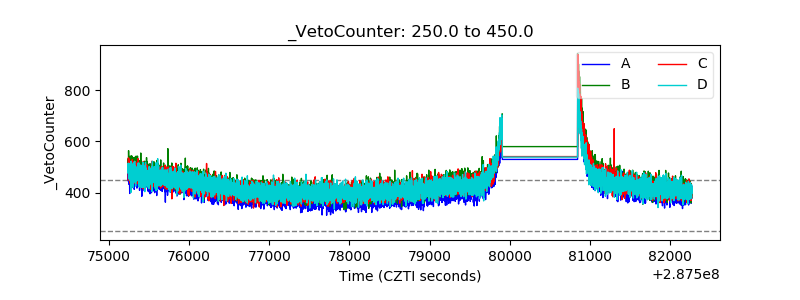 |