| Param | Original file | Final file |
|---|---|---|
| Filename | modeM0/AS1A05_019T01_9000002718_18243cztM0_level2.evt | modeM0/AS1A05_019T01_9000002718_18243cztM0_level2_quad_clean.evt |
| Size (bytes) | 486,506,880 | 95,595,840 |
| Size | 464.0 MB | 91.2 MB |
| Events in quadrant A | 3,800,182 | 610,600 |
| Events in quadrant B | 3,410,862 | 621,149 |
| Events in quadrant C | 3,272,720 | 586,980 |
| Events in quadrant D | 3,768,993 | 582,948 |
| Mode M9 | |||
|---|---|---|---|
| Quadrant | BADHDUFLAG | Total packets | Discarded packets |
| A | 0 | 3 | 0 |
| B | 0 | 3 | 0 |
| C | 0 | 3 | 0 |
| D | 0 | 3 | 0 |
| Mode M0 | |||
|---|---|---|---|
| Quadrant | BADHDUFLAG | Total packets | Discarded packets |
| A | 0 | 16051 | 1 |
| B | 0 | 14781 | 1 |
| C | 0 | 14501 | 1 |
| D | 0 | 15993 | 1 |
| Mode SS | |||
|---|---|---|---|
| Quadrant | BADHDUFLAG | Total packets | Discarded packets |
| A | 0 | 144 | 0 |
| B | 0 | 144 | 0 |
| C | 0 | 144 | 0 |
| D | 0 | 144 | 0 |
| Quadrant | Total seconds | Saturated seconds | Saturation percentage |
|---|---|---|---|
| A | 7082 | 177 | 2.499294% |
| B | 7082 | 52 | 0.734256% |
| C | 7082 | 75 | 1.059023% |
| D | 7082 | 102 | 1.440271% |
Noise dominated data is calculated using 1-second bins in cleaned event files. If a bin has >2000 counts, and if more than 50% of those come from <1% of pixels, then it is considered to be noise-dominated and hence unusable.
| Quadrant | # 1 sec bins | Bins with >0 counts | Bins with >2000 counts | High rate bins dominated by noise | Noise dominated (total time) | Noise dominated (detector-on time) | Marked lightcurve |
|---|---|---|---|---|---|---|---|
| A | 7357 | 7083 | 117 | 117 | 1.59% | 1.65% | 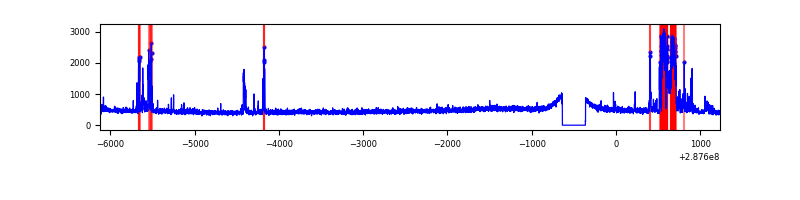 |
| B | 7357 | 7083 | 3 | 3 | 0.04% | 0.04% | 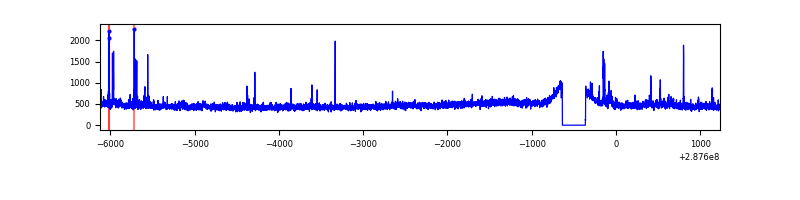 |
| C | 7357 | 7083 | 0 | 0 | 0.00% | 0.00% | 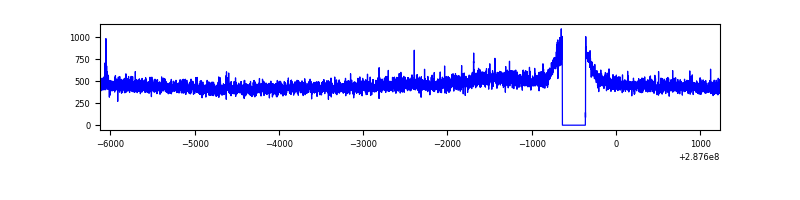 |
| D | 7357 | 7083 | 53 | 53 | 0.72% | 0.75% | 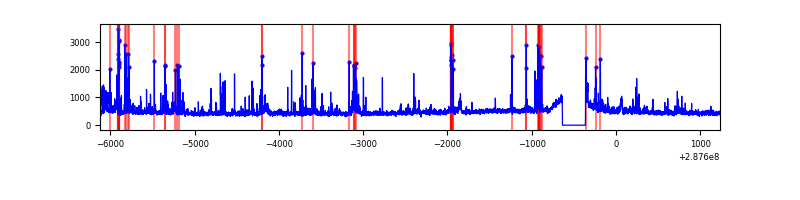 |
Top three noisy pixels from each quadrant. If the there are fewer than three noisy pixels in the level2.evt file, extra rows are filled as -1
| Pixel properties | Quadrant properties | ||||||
|---|---|---|---|---|---|---|---|
| Quadrant | DetID | PixID | Counts | Sigma | Mean | Median | Sigma |
| A | 15 | 174 | 566915 | 3315.05 | 838 | 818 | 170.8 |
| A | 3 | 1 | 7746 | 40.57 | 838 | 818 | 170.8 |
| A | 0 | 226 | 7342 | 38.2 | 838 | 818 | 170.8 |
| B | 7 | 220 | 51693 | 311.99 | 838 | 816 | 163.1 |
| B | 3 | 64 | 23962 | 141.94 | 838 | 816 | 163.1 |
| B | 4 | 171 | 21268 | 125.41 | 838 | 816 | 163.1 |
| C | 14 | 238 | 123737 | 649.8 | 804 | 808 | 189.2 |
| C | 13 | 61 | 5694 | 25.83 | 804 | 808 | 189.2 |
| C | 4 | 223 | 5672 | 25.71 | 804 | 808 | 189.2 |
| D | 1 | 52 | 276442 | 1375.09 | 821 | 797 | 200.5 |
| D | 7 | 238 | 151175 | 750.18 | 821 | 797 | 200.5 |
| D | 10 | 70 | 133390 | 661.46 | 821 | 797 | 200.5 |
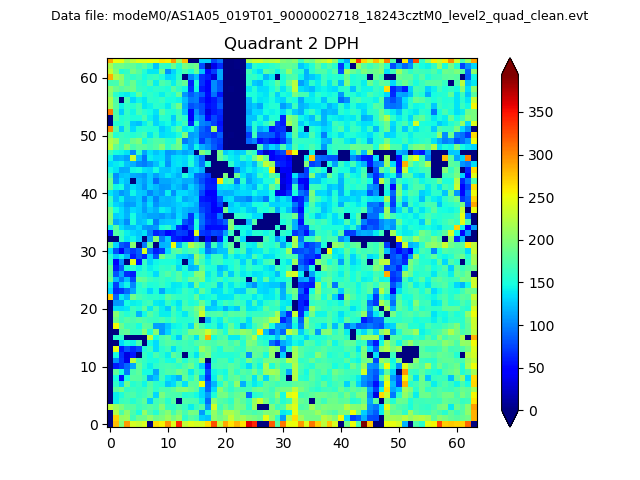
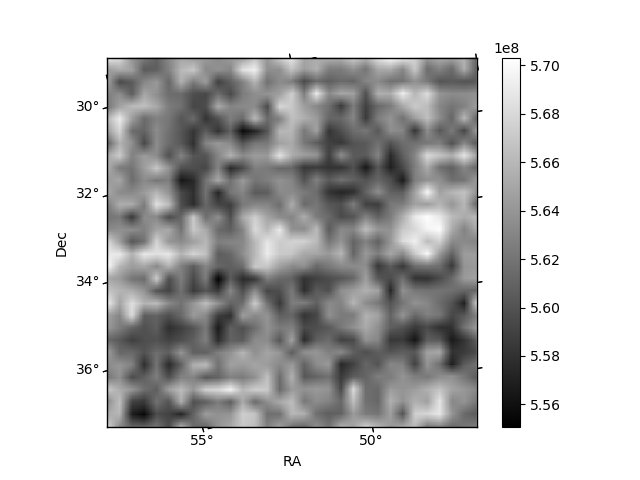
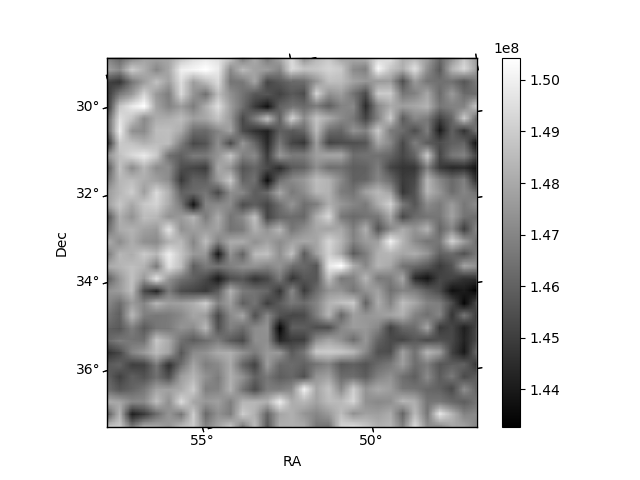
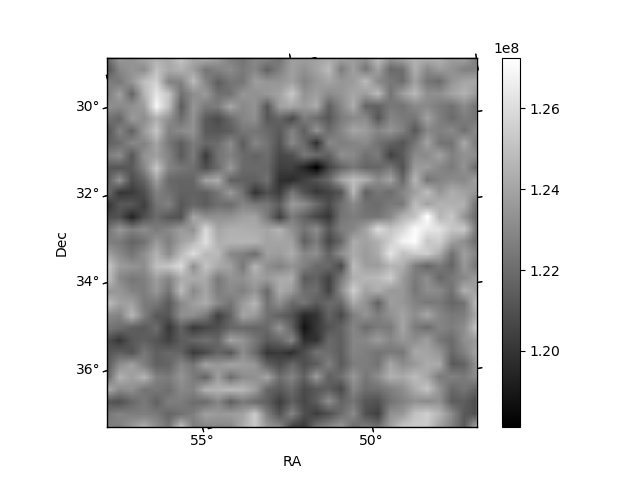
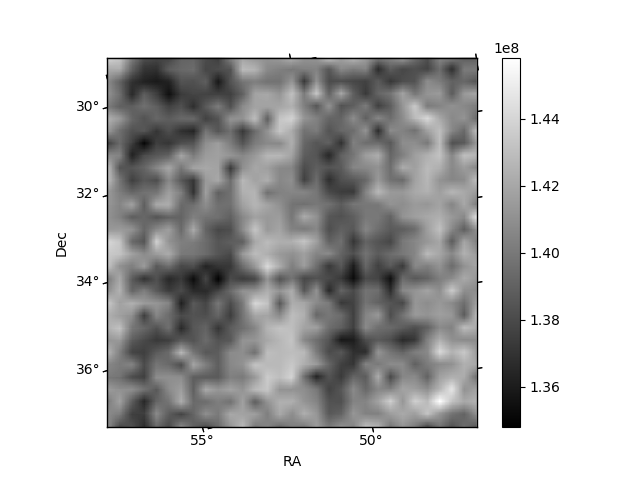
Histogram calculated using DETX and DETY for each event in the final _common_clean file
| Quadrant A | 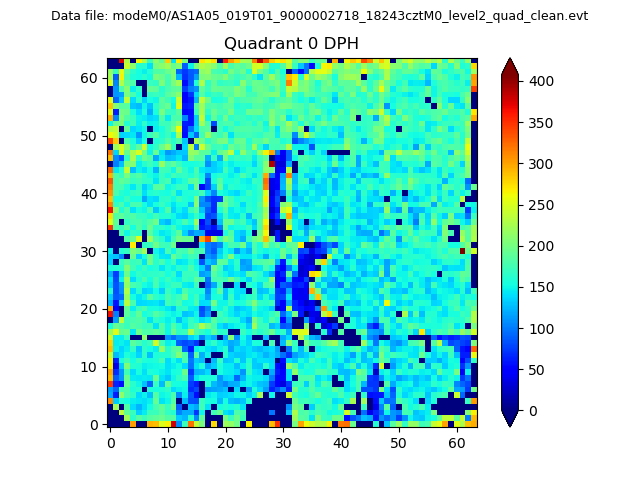 |
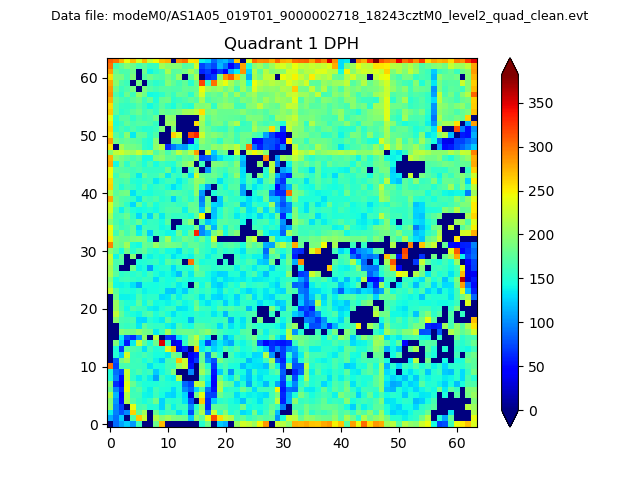 |
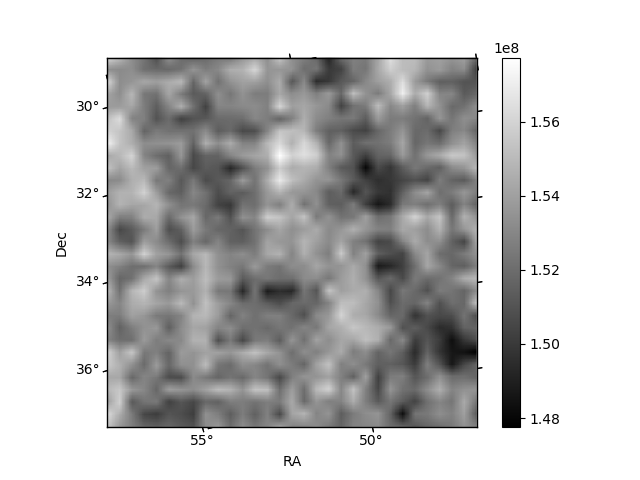
Quadrant B |
|---|---|---|---|
| Quadrant D | 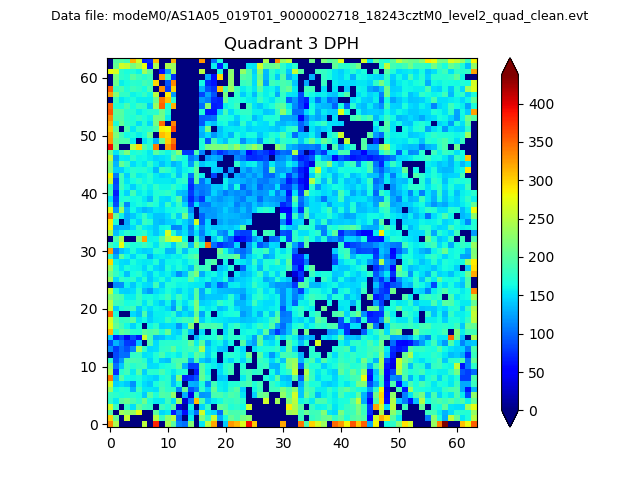 |
 |
Quadrant C |
| Plot type | Count rate plots | Images |
|---|---|---|
| Comparison with Poisson distribution Blue bars denote a histogram of data divided into 1 sec bins. Red curve is a Poisson curve with rate = median count rate of data. |
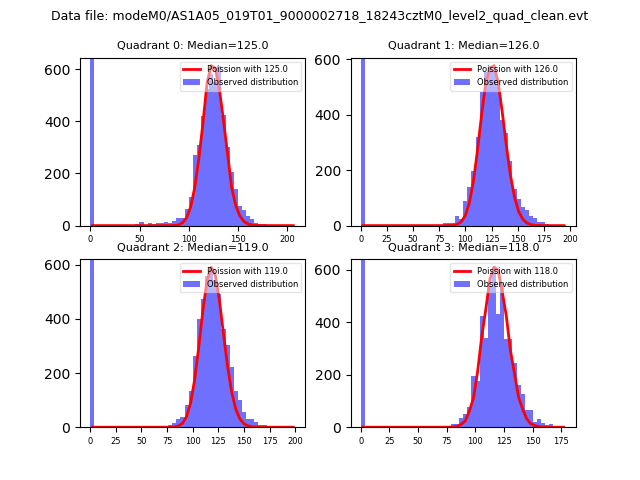 |
 |
| Quadrant-wise count rates Data is divided into 100 sec bins |
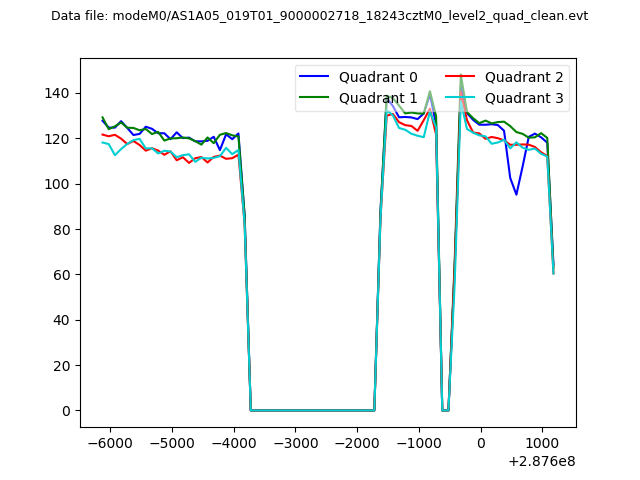 |
|
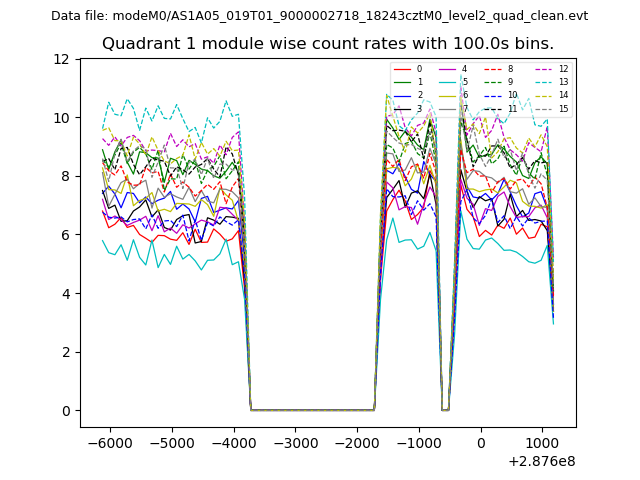
| Module-wise count rates for Quadrant A Data is divided into 100 sec bins |
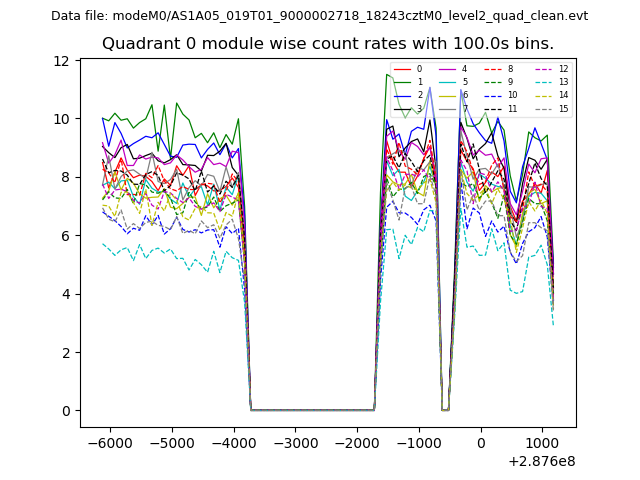 |
 |
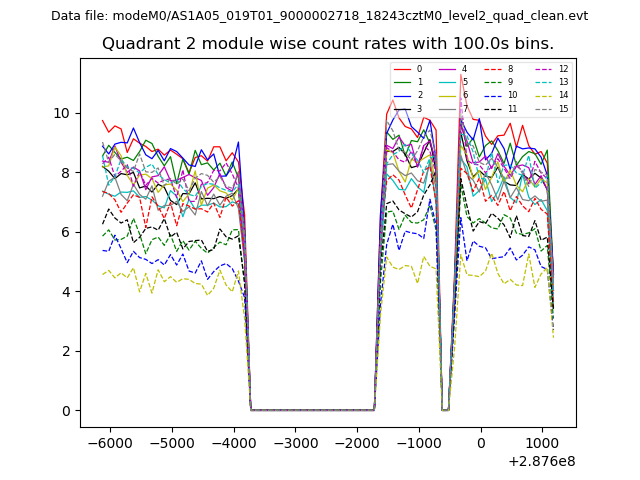
| Module-wise count rates for Quadrant B Data is divided into 100 sec bins |
 |
 |
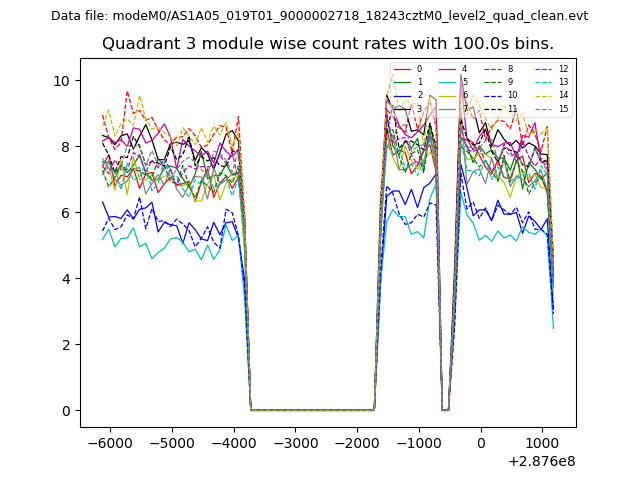
| Module-wise count rates for Quadrant C Data is divided into 100 sec bins |
 |
 |
| Module-wise count rates for Quadrant D Data is divided into 100 sec bins |
 |
 |
| Parameter | Plot |
|---|---|
| CZT HV Monitor | 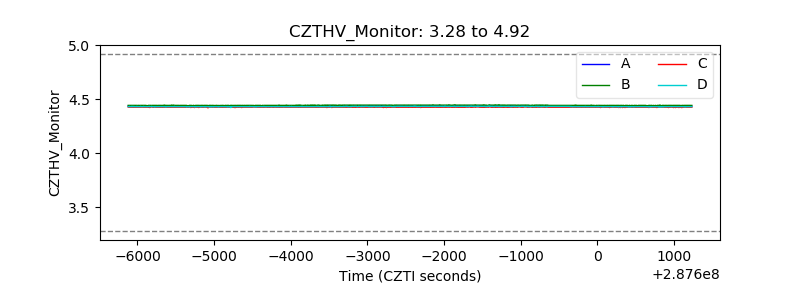 |
| D_VDD |  |
| Temperature 1 | 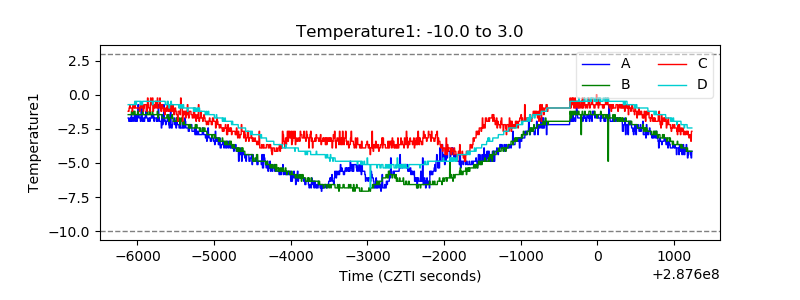 |
| Veto HV Monitor | 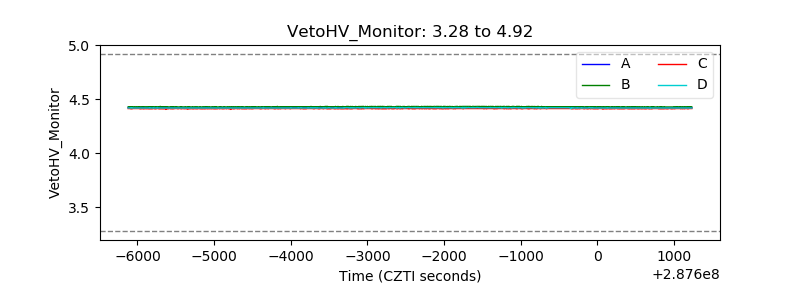 |
| Veto LLD |  |
| Alpha Counter | 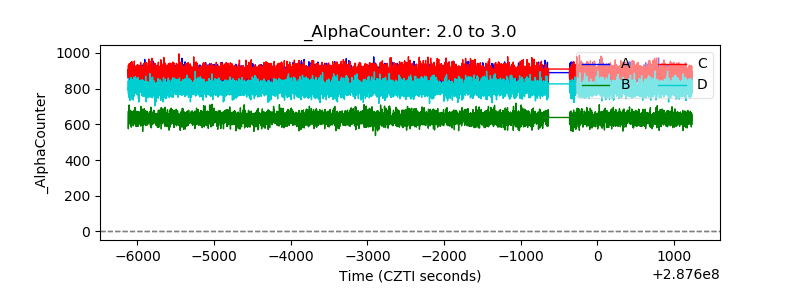 |
| _CPM_Rate | 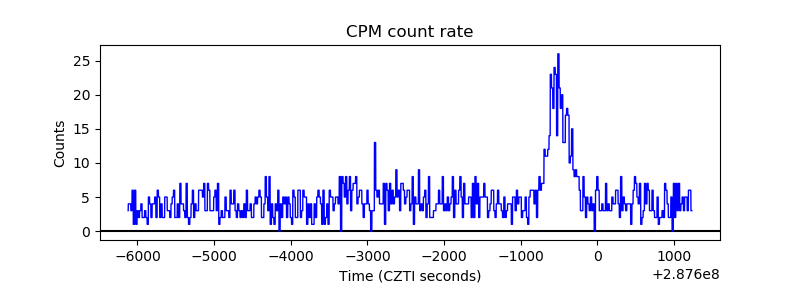 |
| CZT Counter | 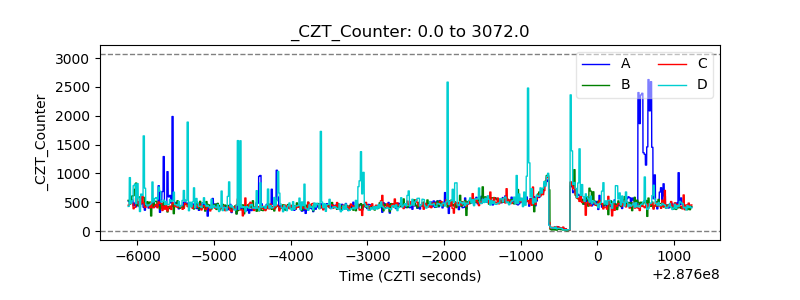 |
| +2.5 Volts monitor | 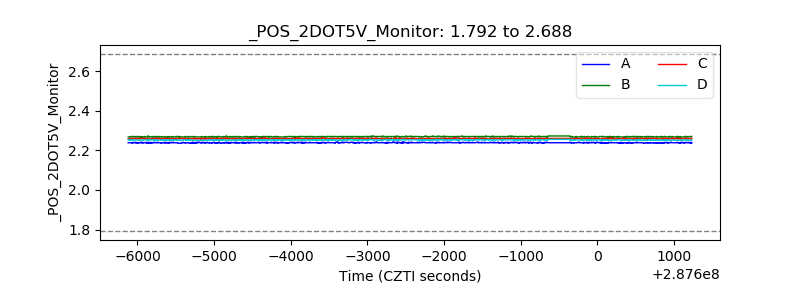 |
| +5 Volts monitor |  |
| _ROLL_ROT | 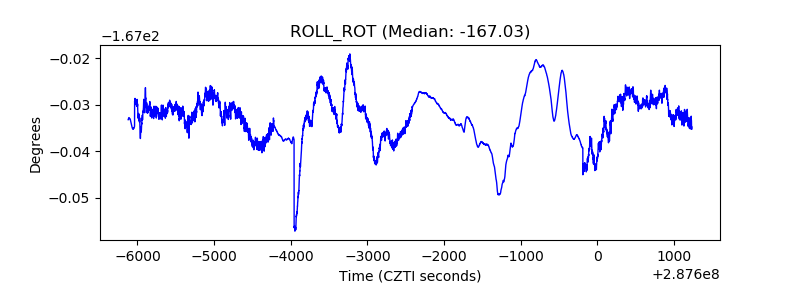 |
| _Roll_DEC | 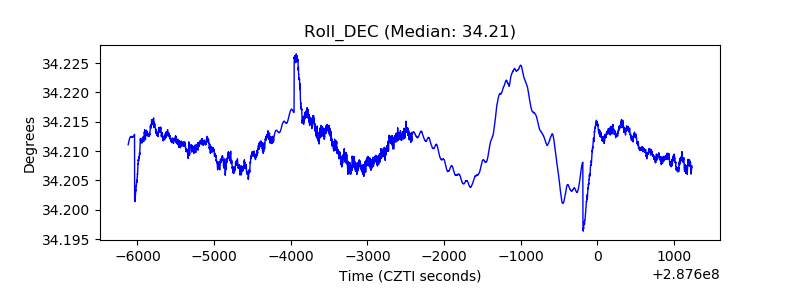 |
| _Roll_RA | 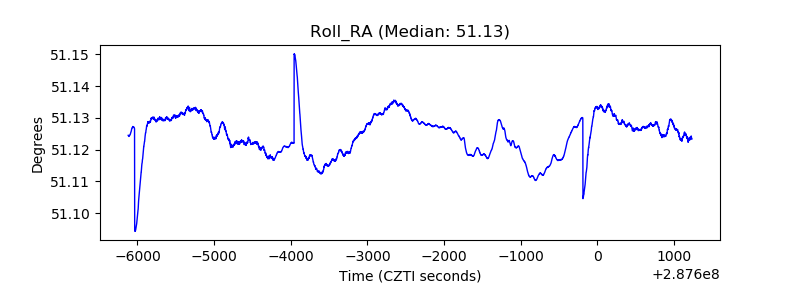 |
| Veto Counter | 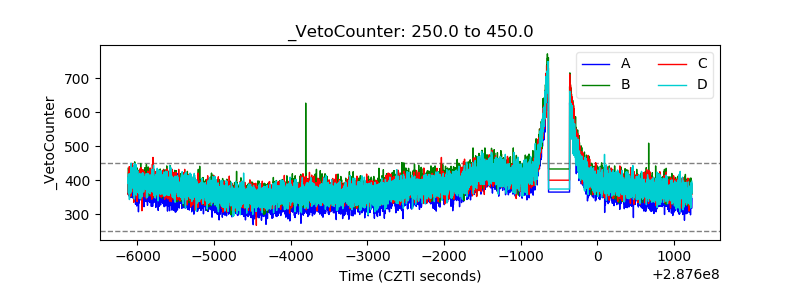 |