| Param | Original file | Final file |
|---|---|---|
| Filename | modeM0/AS1A05_019T01_9000002718_18246cztM0_level2.evt | modeM0/AS1A05_019T01_9000002718_18246cztM0_level2_quad_clean.evt |
| Size (bytes) | 1,251,691,200 | 228,764,160 |
| Size | 1.2 GB | 218.2 MB |
| Events in quadrant A | 9,286,338 | 1,444,370 |
| Events in quadrant B | 8,889,754 | 1,466,190 |
| Events in quadrant C | 8,442,896 | 1,392,323 |
| Events in quadrant D | 10,044,958 | 1,358,314 |
| Mode M9 | |||
|---|---|---|---|
| Quadrant | BADHDUFLAG | Total packets | Discarded packets |
| A | 0 | 19 | 0 |
| B | 0 | 19 | 0 |
| C | 0 | 19 | 0 |
| D | 0 | 19 | 0 |
| Mode M0 | |||
|---|---|---|---|
| Quadrant | BADHDUFLAG | Total packets | Discarded packets |
| A | 0 | 40047 | 3 |
| B | 0 | 38512 | 3 |
| C | 0 | 37251 | 4 |
| D | 0 | 42725 | 3 |
| Mode SS | |||
|---|---|---|---|
| Quadrant | BADHDUFLAG | Total packets | Discarded packets |
| A | 0 | 374 | 0 |
| B | 0 | 374 | 0 |
| C | 0 | 374 | 0 |
| D | 0 | 374 | 0 |
| Quadrant | Total seconds | Saturated seconds | Saturation percentage |
|---|---|---|---|
| A | 18388 | 217 | 1.180117% |
| B | 18389 | 119 | 0.647126% |
| C | 18388 | 98 | 0.532956% |
| D | 18388 | 436 | 2.371112% |
Noise dominated data is calculated using 1-second bins in cleaned event files. If a bin has >2000 counts, and if more than 50% of those come from <1% of pixels, then it is considered to be noise-dominated and hence unusable.
| Quadrant | # 1 sec bins | Bins with >0 counts | Bins with >2000 counts | High rate bins dominated by noise | Noise dominated (total time) | Noise dominated (detector-on time) | Marked lightcurve |
|---|---|---|---|---|---|---|---|
| A | 20313 | 18390 | 132 | 132 | 0.65% | 0.72% | 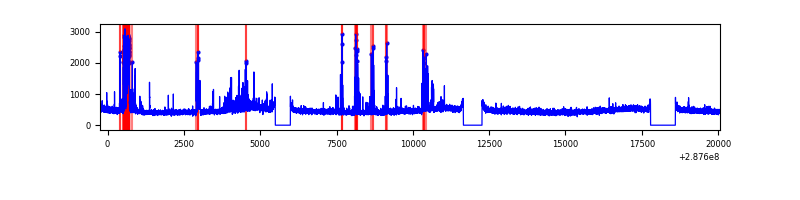 |
| B | 20314 | 18391 | 34 | 34 | 0.17% | 0.18% | 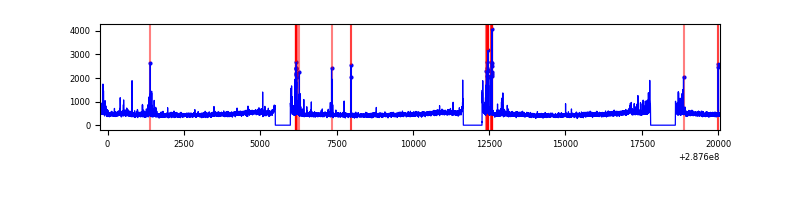 |
| C | 20313 | 18390 | 0 | 0 | 0.00% | 0.00% | 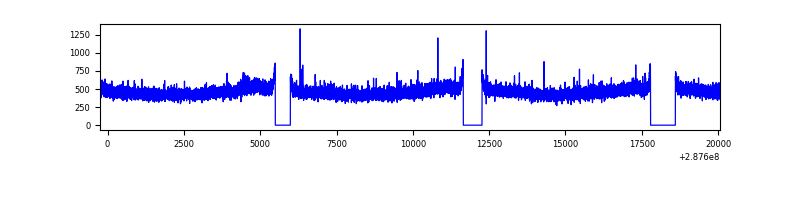 |
| D | 20313 | 18390 | 306 | 306 | 1.51% | 1.66% | 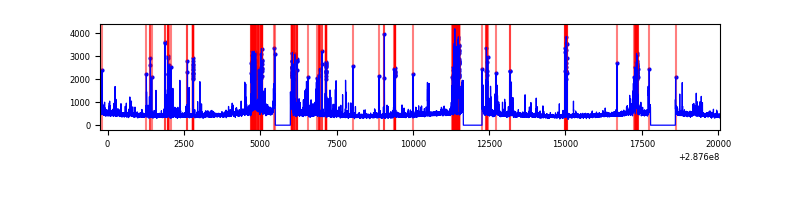 |
Top three noisy pixels from each quadrant. If the there are fewer than three noisy pixels in the level2.evt file, extra rows are filled as -1
| Pixel properties | Quadrant properties | ||||||
|---|---|---|---|---|---|---|---|
| Quadrant | DetID | PixID | Counts | Sigma | Mean | Median | Sigma |
| A | 15 | 174 | 703898 | 1591.85 | 2165 | 2116 | 440.9 |
| A | 8 | 255 | 249826 | 561.88 | 2165 | 2116 | 440.9 |
| A | 0 | 226 | 18507 | 37.18 | 2165 | 2116 | 440.9 |
| B | 5 | 172 | 127868 | 305.5 | 2162 | 2107 | 411.7 |
| B | 7 | 220 | 120126 | 286.69 | 2162 | 2107 | 411.7 |
| B | 0 | 197 | 78887 | 186.52 | 2162 | 2107 | 411.7 |
| C | 14 | 238 | 322199 | 659.05 | 2076 | 2090 | 485.7 |
| C | 4 | 223 | 17084 | 30.87 | 2076 | 2090 | 485.7 |
| C | 13 | 61 | 14854 | 26.28 | 2076 | 2090 | 485.7 |
| D | 1 | 52 | 1251449 | 2469.45 | 2090 | 2029 | 505.9 |
| D | 7 | 238 | 490594 | 965.64 | 2090 | 2029 | 505.9 |
| D | 13 | 104 | 108480 | 210.4 | 2090 | 2029 | 505.9 |
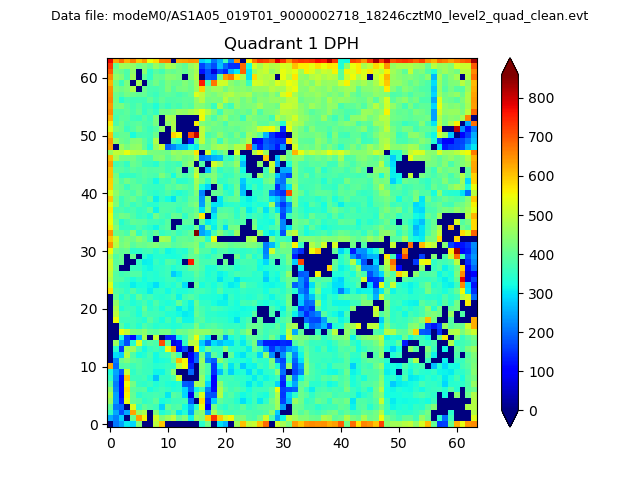
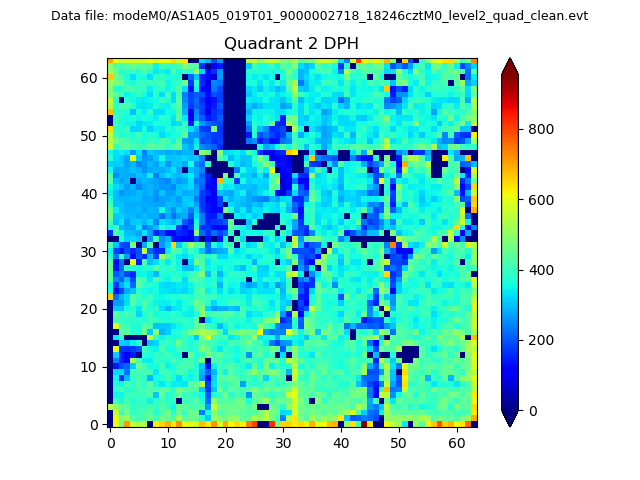
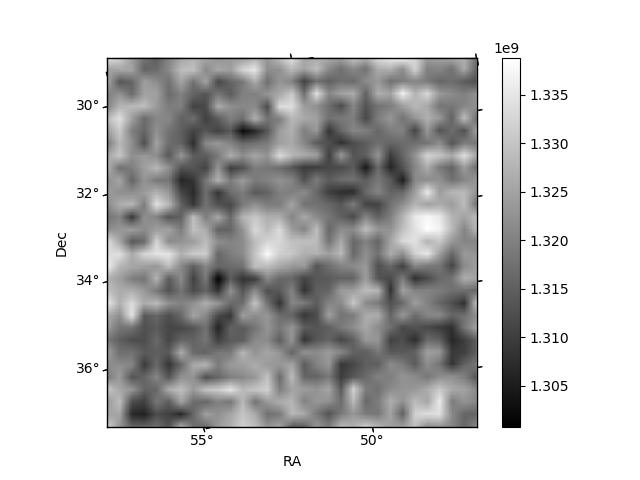
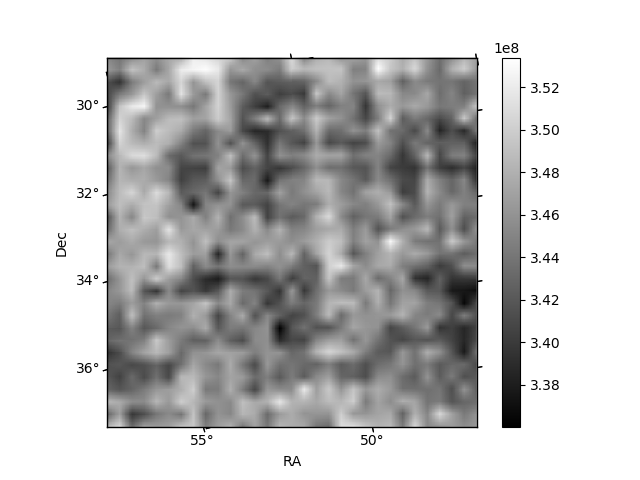
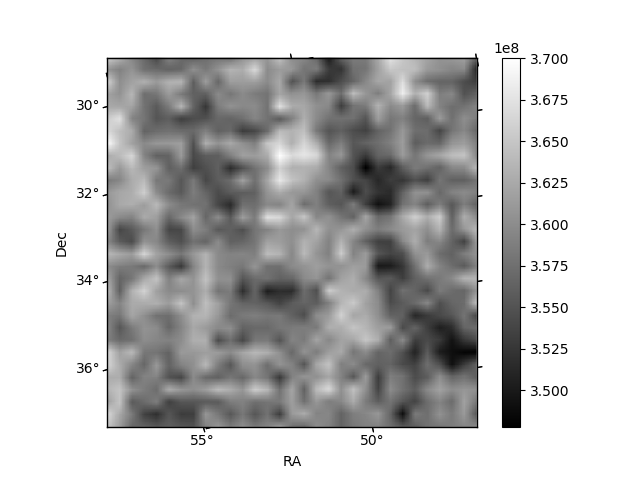
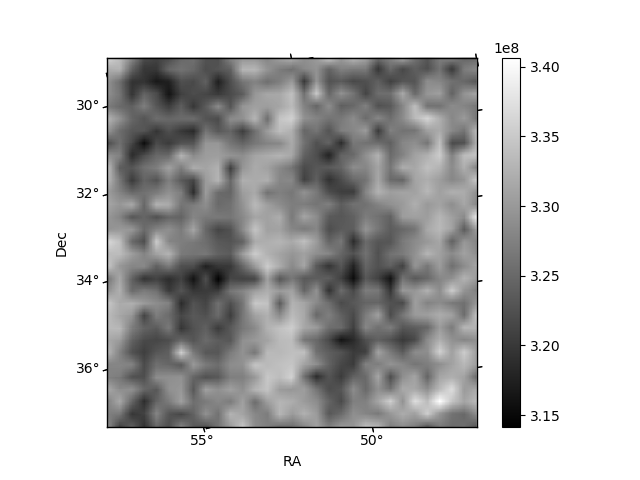
Histogram calculated using DETX and DETY for each event in the final _common_clean file
| Quadrant A |  |
 |
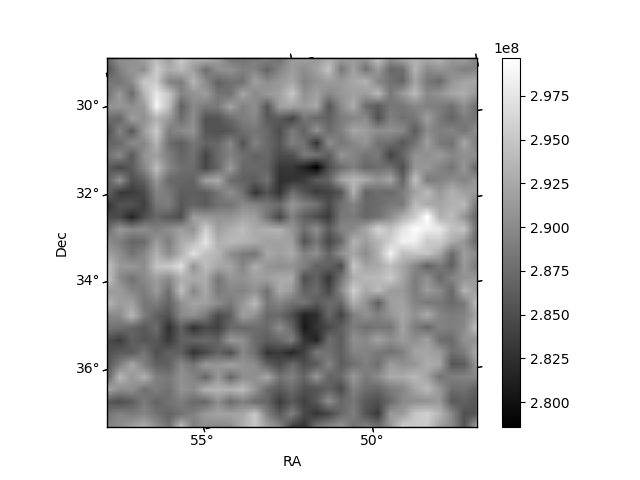
Quadrant B |
|---|---|---|---|
| Quadrant D | 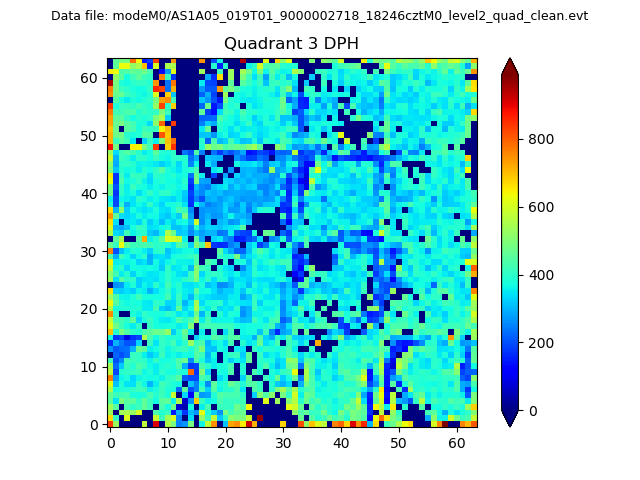 |
 |
Quadrant C |
| Plot type | Count rate plots | Images |
|---|---|---|
| Comparison with Poisson distribution Blue bars denote a histogram of data divided into 1 sec bins. Red curve is a Poisson curve with rate = median count rate of data. |
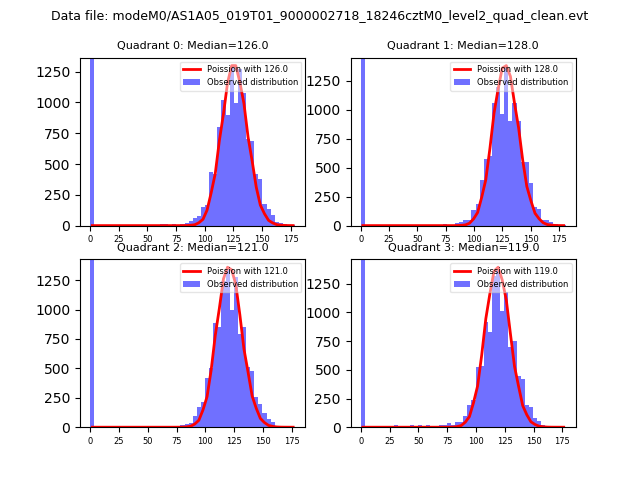 |
 |
| Quadrant-wise count rates Data is divided into 100 sec bins |
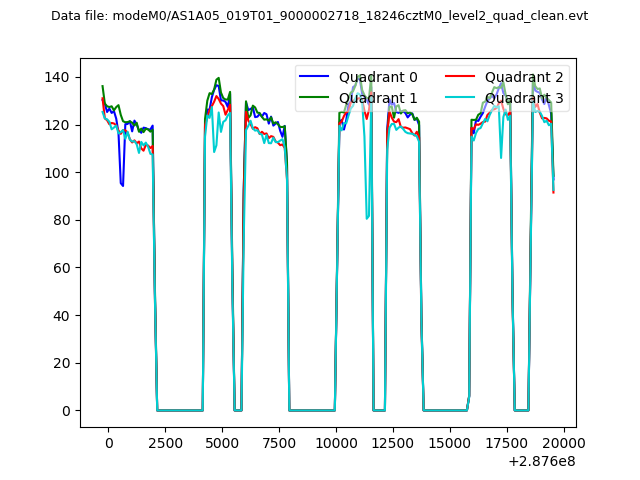 |
|
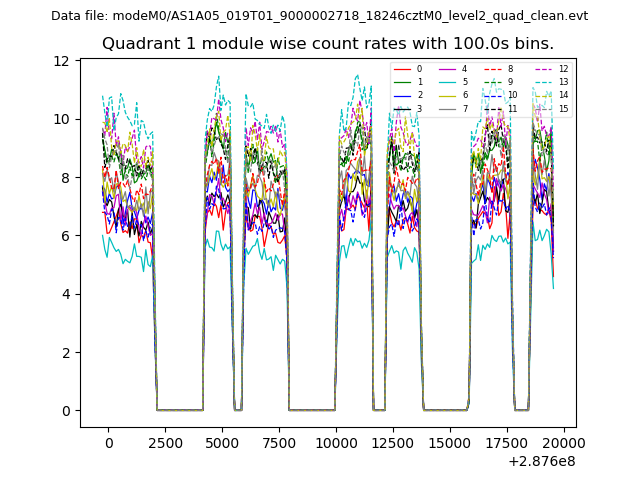
| Module-wise count rates for Quadrant A Data is divided into 100 sec bins |
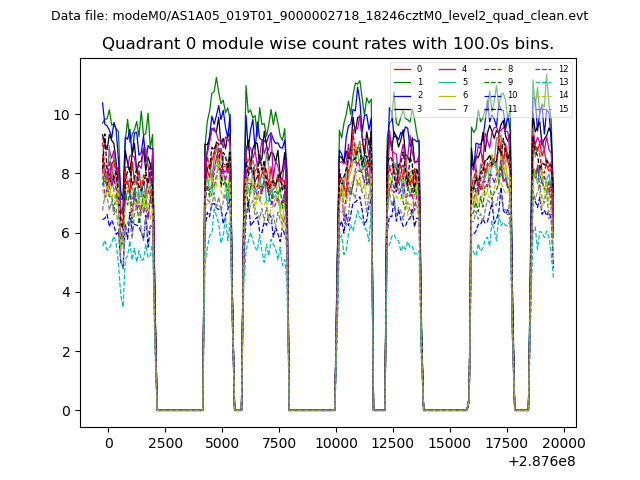 |
 |
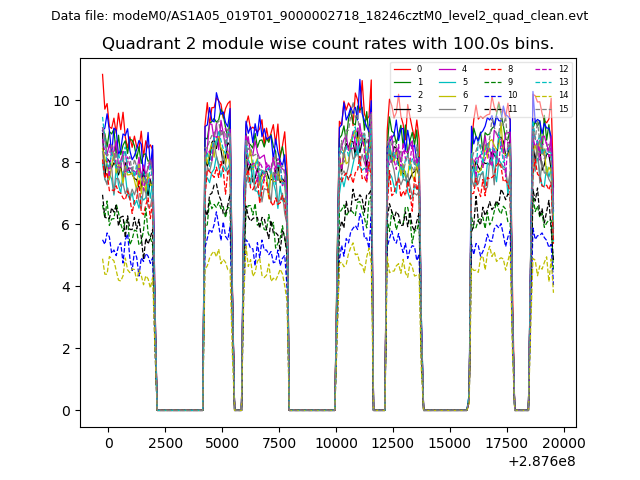
| Module-wise count rates for Quadrant B Data is divided into 100 sec bins |
 |
 |
| Module-wise count rates for Quadrant C Data is divided into 100 sec bins |
 |
 |
| Module-wise count rates for Quadrant D Data is divided into 100 sec bins |
 |
 |
| Parameter | Plot |
|---|---|
| CZT HV Monitor | 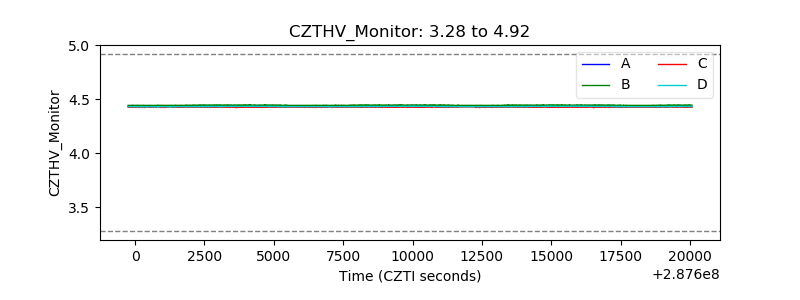 |
| D_VDD | 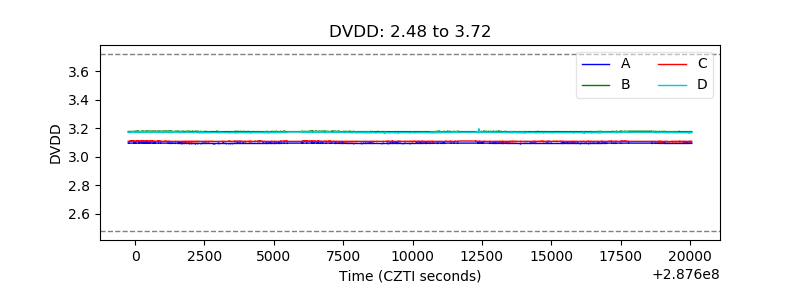 |
| Temperature 1 | 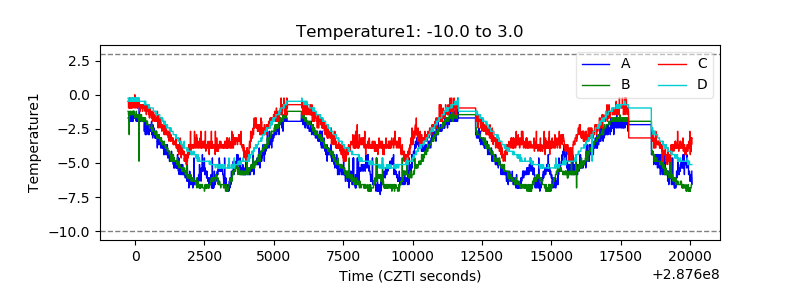 |
| Veto HV Monitor | 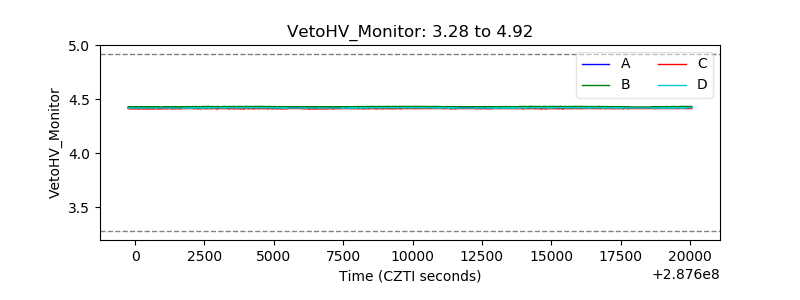 |
| Veto LLD | 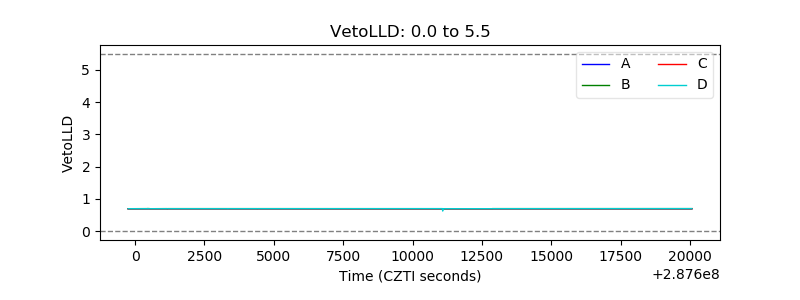 |
| Alpha Counter | 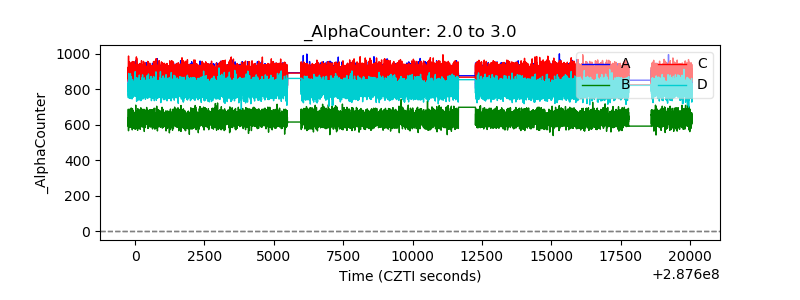 |
| _CPM_Rate | 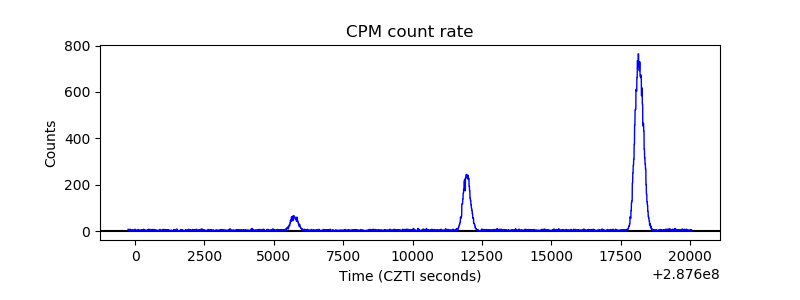 |
| CZT Counter | 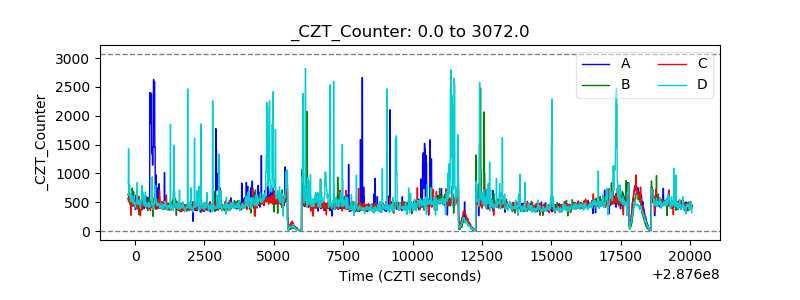 |
| +2.5 Volts monitor |  |
| +5 Volts monitor |  |
| _ROLL_ROT | 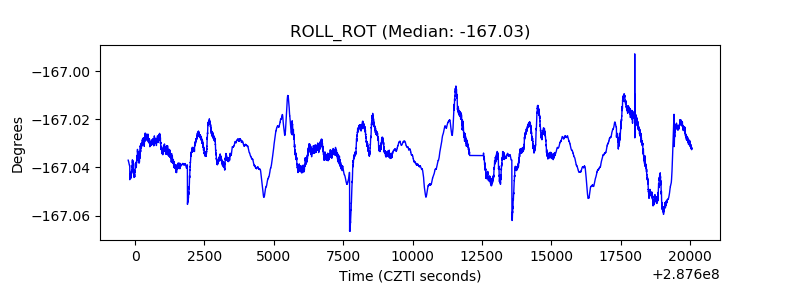 |
| _Roll_DEC | 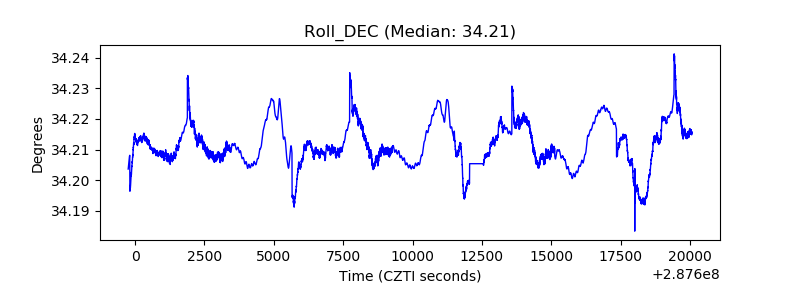 |
| _Roll_RA | 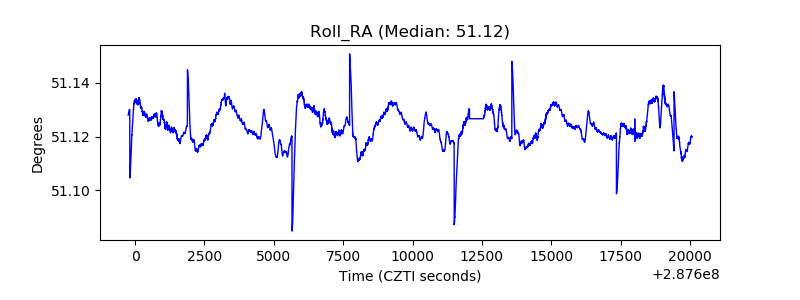 |
| Veto Counter | 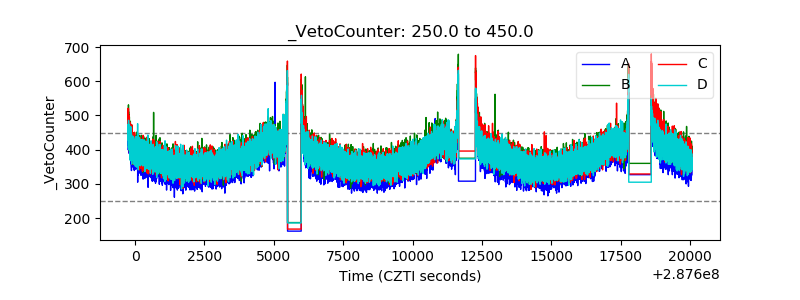 |