| Param | Original file | Final file |
|---|---|---|
| Filename | modeM0/AS1A05_019T01_9000002718_18250cztM0_level2.evt | modeM0/AS1A05_019T01_9000002718_18250cztM0_level2_quad_clean.evt |
| Size (bytes) | 453,735,360 | 65,139,840 |
| Size | 432.7 MB | 62.1 MB |
| Events in quadrant A | 3,267,970 | 390,074 |
| Events in quadrant B | 3,336,367 | 396,350 |
| Events in quadrant C | 3,353,256 | 372,685 |
| Events in quadrant D | 3,351,659 | 369,209 |
| Mode M9 | |||
|---|---|---|---|
| Quadrant | BADHDUFLAG | Total packets | Discarded packets |
| A | 0 | 17 | 0 |
| B | 0 | 18 | 0 |
| C | 0 | 18 | 0 |
| D | 0 | 18 | 0 |
| Mode M0 | |||
|---|---|---|---|
| Quadrant | BADHDUFLAG | Total packets | Discarded packets |
| A | 0 | 13620 | 2 |
| B | 0 | 13830 | 2 |
| C | 0 | 13957 | 2 |
| D | 0 | 14066 | 2 |
| Mode SS | |||
|---|---|---|---|
| Quadrant | BADHDUFLAG | Total packets | Discarded packets |
| A | 0 | 130 | 0 |
| B | 0 | 130 | 0 |
| C | 0 | 130 | 0 |
| D | 0 | 130 | 0 |
| Quadrant | Total seconds | Saturated seconds | Saturation percentage |
|---|---|---|---|
| A | 6359 | 55 | 0.864916% |
| B | 6358 | 72 | 1.132432% |
| C | 6358 | 95 | 1.494181% |
| D | 6358 | 85 | 1.336898% |
Noise dominated data is calculated using 1-second bins in cleaned event files. If a bin has >2000 counts, and if more than 50% of those come from <1% of pixels, then it is considered to be noise-dominated and hence unusable.
| Quadrant | # 1 sec bins | Bins with >0 counts | Bins with >2000 counts | High rate bins dominated by noise | Noise dominated (total time) | Noise dominated (detector-on time) | Marked lightcurve |
|---|---|---|---|---|---|---|---|
| A | 7569 | 6360 | 2 | 2 | 0.03% | 0.03% | 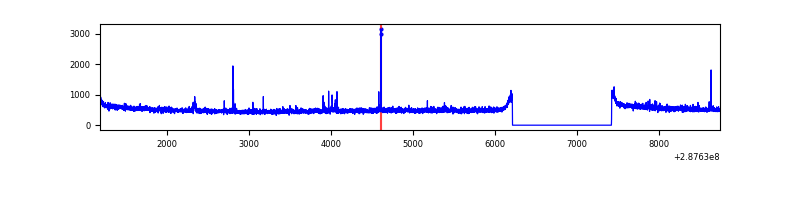 |
| B | 7568 | 6359 | 2 | 2 | 0.03% | 0.03% | 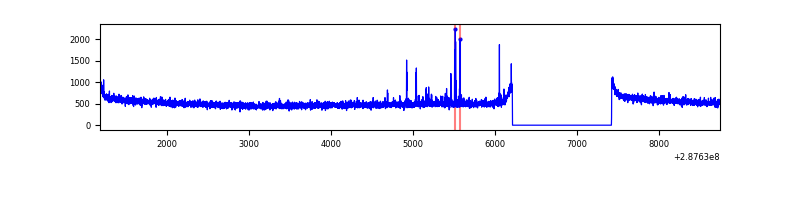 |
| C | 7568 | 6359 | 1 | 1 | 0.01% | 0.02% | 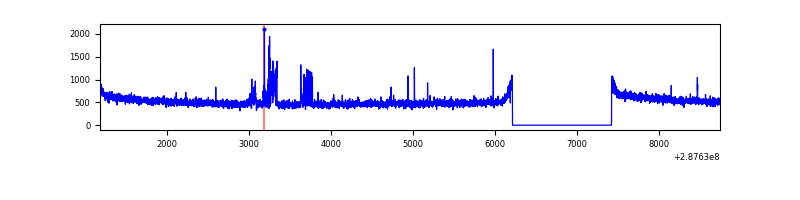 |
| D | 7568 | 6359 | 54 | 54 | 0.71% | 0.85% | 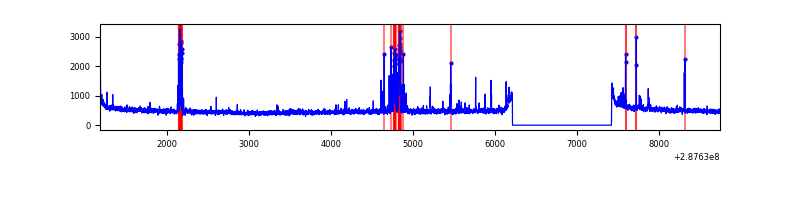 |
Top three noisy pixels from each quadrant. If the there are fewer than three noisy pixels in the level2.evt file, extra rows are filled as -1
| Pixel properties | Quadrant properties | ||||||
|---|---|---|---|---|---|---|---|
| Quadrant | DetID | PixID | Counts | Sigma | Mean | Median | Sigma |
| A | 15 | 174 | 42259 | 249.8 | 835 | 821 | 165.9 |
| A | 11 | 29 | 10109 | 55.99 | 835 | 821 | 165.9 |
| A | 4 | 2 | 8966 | 49.1 | 835 | 821 | 165.9 |
| B | 7 | 220 | 43788 | 270.86 | 838 | 816 | 158.6 |
| B | 12 | 111 | 18031 | 108.51 | 838 | 816 | 158.6 |
| B | 11 | 111 | 15874 | 94.91 | 838 | 816 | 158.6 |
| C | 14 | 238 | 125033 | 676.83 | 793 | 799 | 183.6 |
| C | 3 | 233 | 116876 | 632.39 | 793 | 799 | 183.6 |
| C | 0 | 207 | 18557 | 96.75 | 793 | 799 | 183.6 |
| D | 7 | 238 | 171426 | 875.17 | 801 | 779 | 195.0 |
| D | 1 | 52 | 83893 | 426.25 | 801 | 779 | 195.0 |
| D | 2 | 234 | 25003 | 124.23 | 801 | 779 | 195.0 |
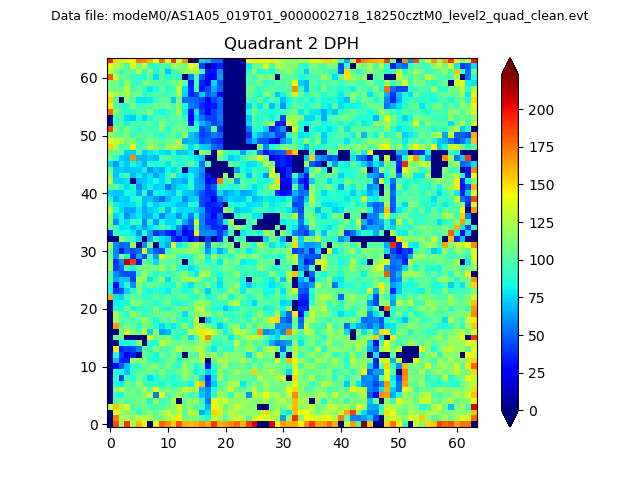
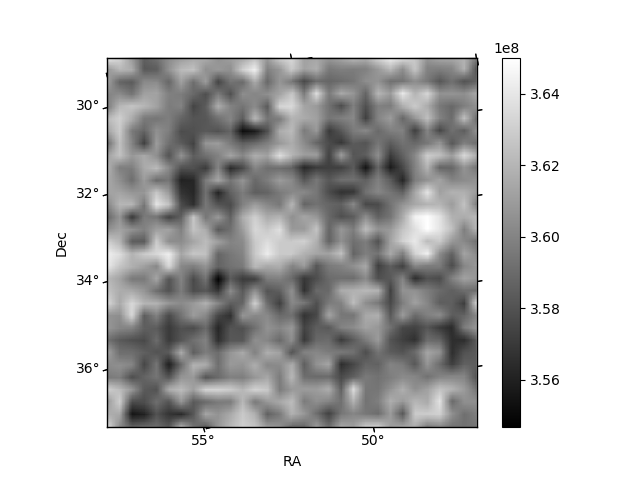
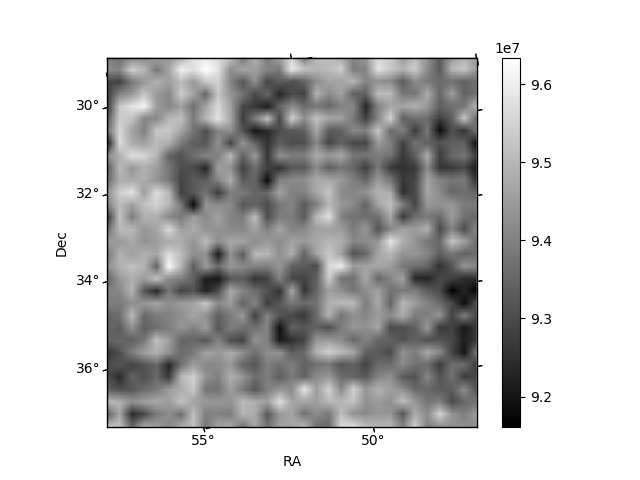
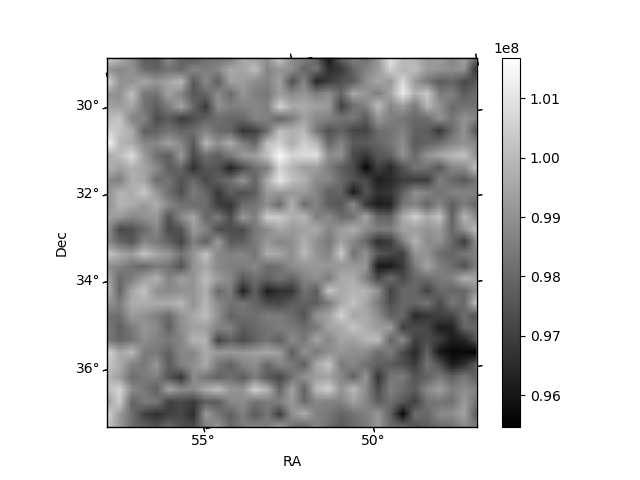
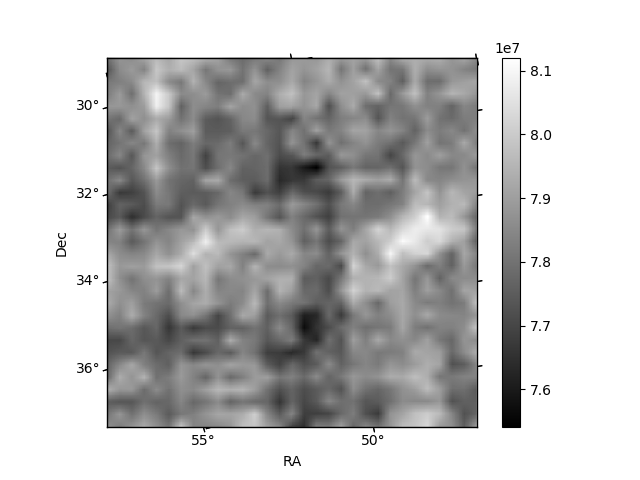
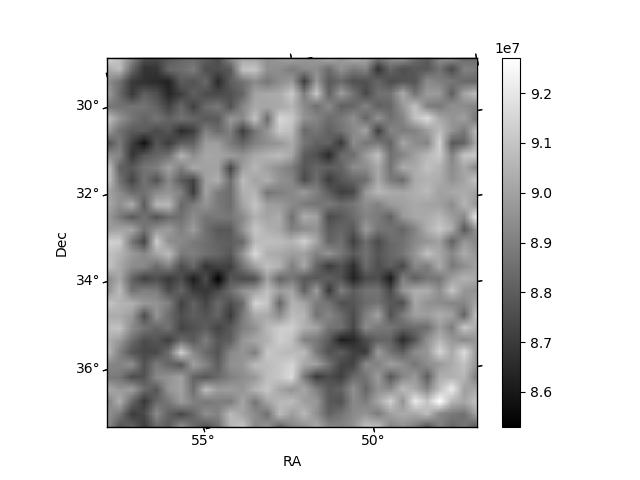
Histogram calculated using DETX and DETY for each event in the final _common_clean file
| Quadrant A | 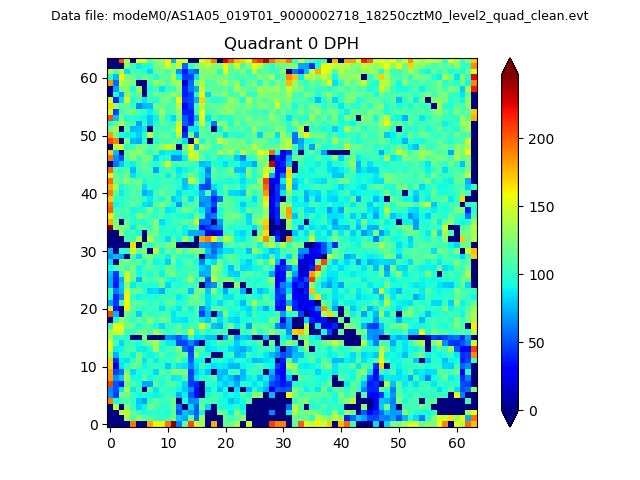 |
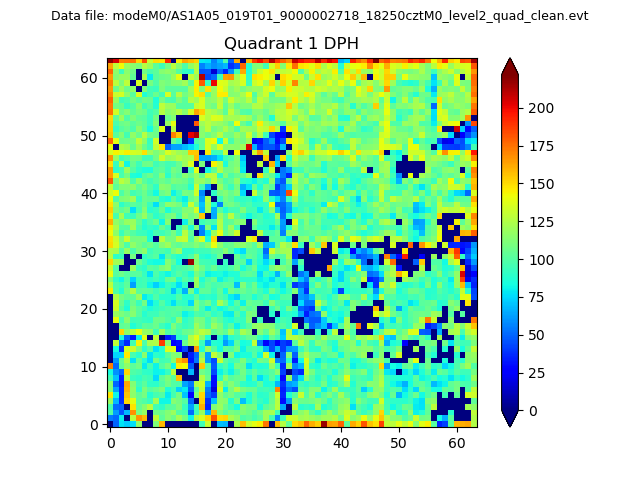 |
Quadrant B |
|---|---|---|---|
| Quadrant D | 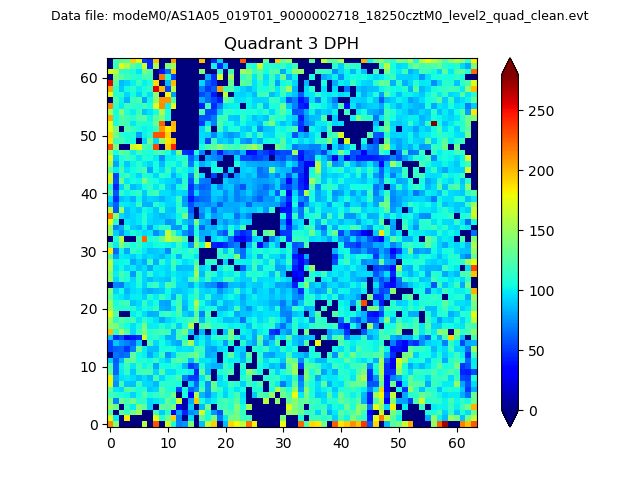 |
 |
Quadrant C |
| Plot type | Count rate plots | Images |
|---|---|---|
| Comparison with Poisson distribution Blue bars denote a histogram of data divided into 1 sec bins. Red curve is a Poisson curve with rate = median count rate of data. |
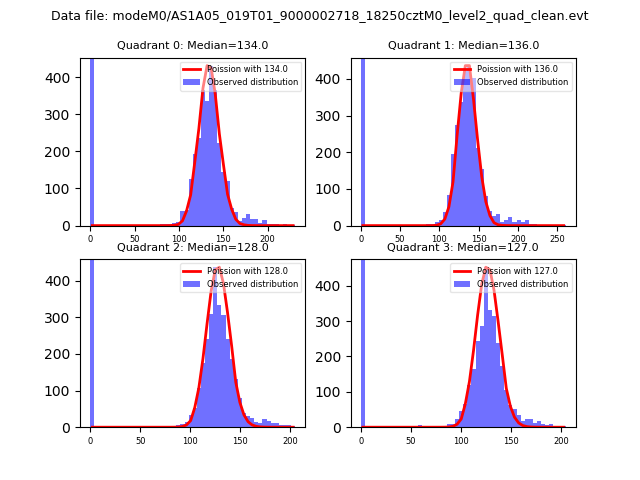 |
 |
| Quadrant-wise count rates Data is divided into 100 sec bins |
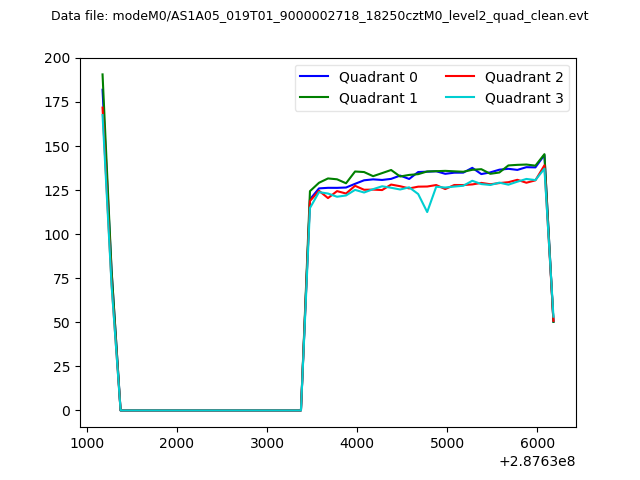 |
|
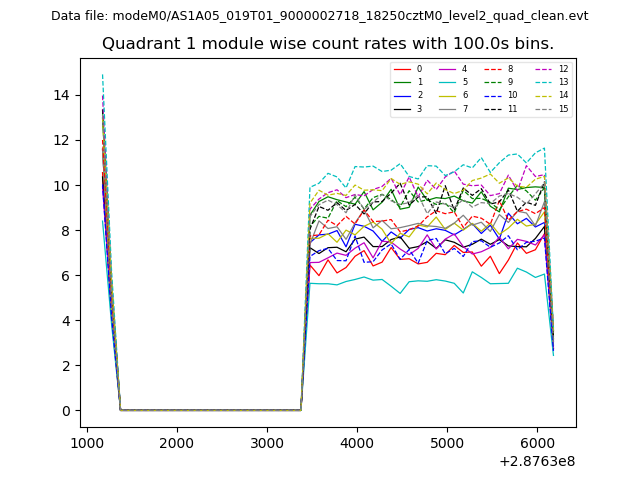
| Module-wise count rates for Quadrant A Data is divided into 100 sec bins |
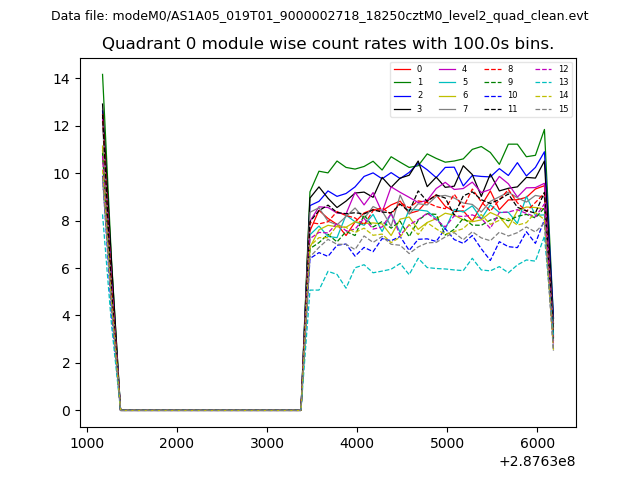 |
 |
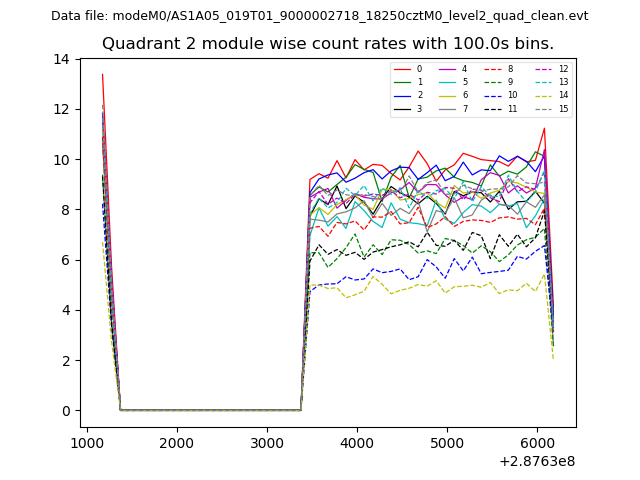
| Module-wise count rates for Quadrant B Data is divided into 100 sec bins |
 |
 |
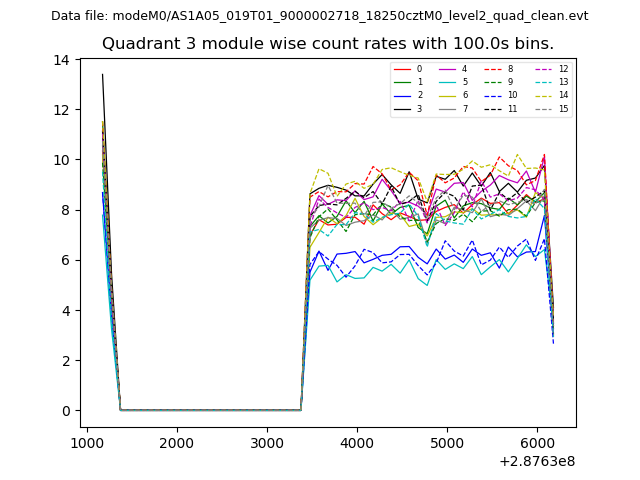
| Module-wise count rates for Quadrant C Data is divided into 100 sec bins |
 |
 |
| Module-wise count rates for Quadrant D Data is divided into 100 sec bins |
 |
 |
| Parameter | Plot |
|---|---|
| CZT HV Monitor | 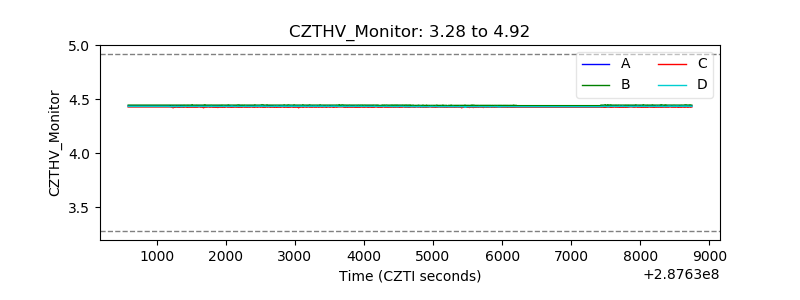 |
| D_VDD | 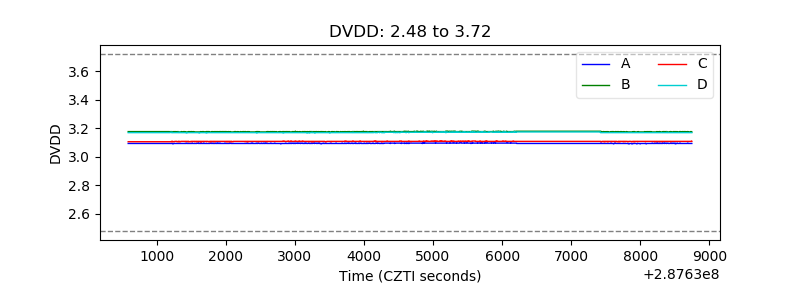 |
| Temperature 1 | 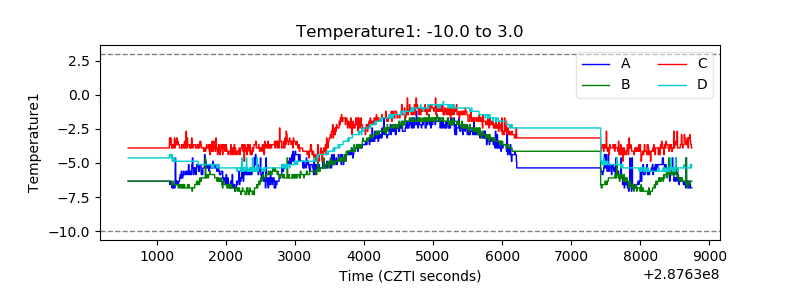 |
| Veto HV Monitor | 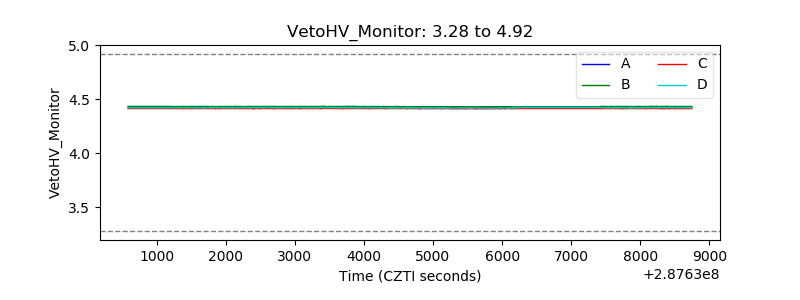 |
| Veto LLD |  |
| Alpha Counter |  |
| _CPM_Rate | 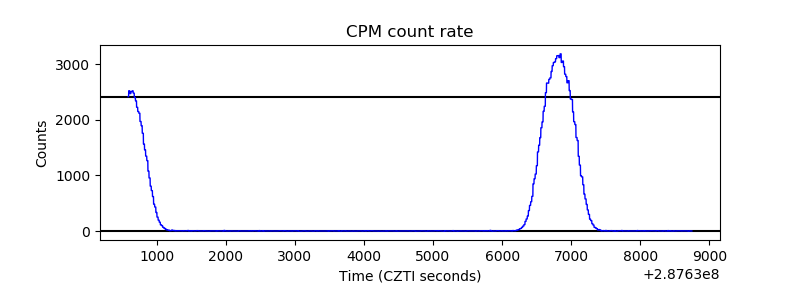 |
| CZT Counter | 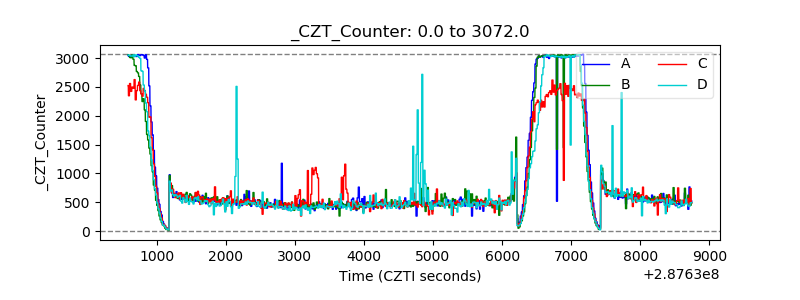 |
| +2.5 Volts monitor |  |
| +5 Volts monitor |  |
| _ROLL_ROT | 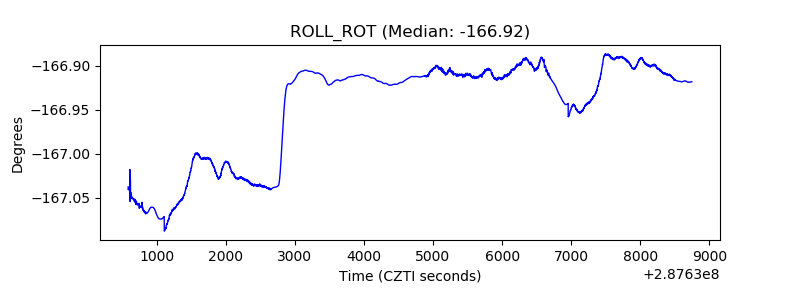 |
| _Roll_DEC | 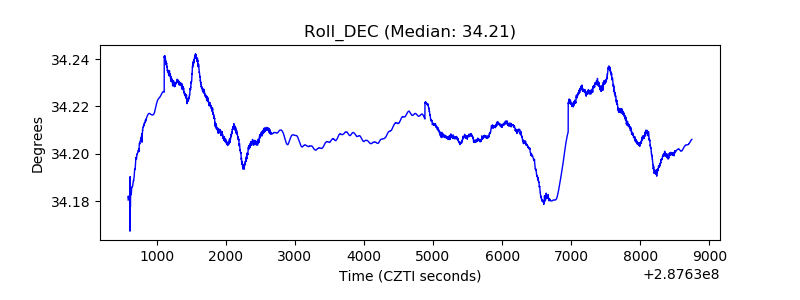 |
| _Roll_RA | 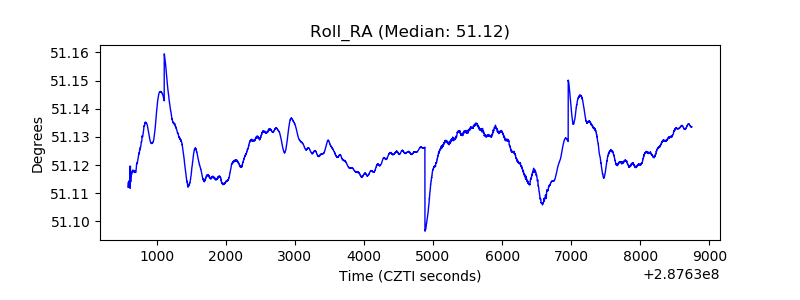 |
| Veto Counter | 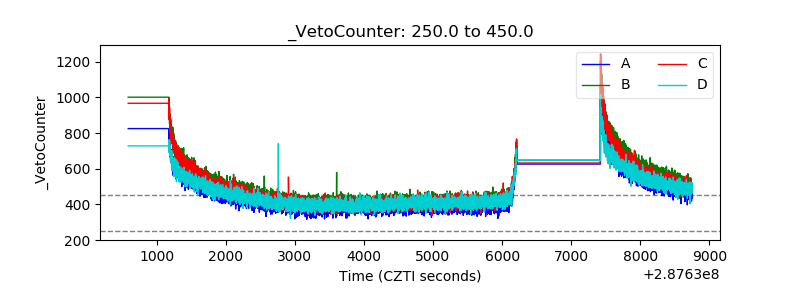 |