| Param | Original file | Final file |
|---|---|---|
| Filename | modeM0/AS1A05_019T01_9000002718_18251cztM0_level2.evt | modeM0/AS1A05_019T01_9000002718_18251cztM0_level2_quad_clean.evt |
| Size (bytes) | 467,259,840 | 69,275,520 |
| Size | 445.6 MB | 66.1 MB |
| Events in quadrant A | 3,628,557 | 426,151 |
| Events in quadrant B | 3,525,277 | 430,342 |
| Events in quadrant C | 3,294,398 | 404,587 |
| Events in quadrant D | 3,279,381 | 401,171 |
| Mode M9 | |||
|---|---|---|---|
| Quadrant | BADHDUFLAG | Total packets | Discarded packets |
| A | 0 | 14 | 0 |
| B | 0 | 15 | 0 |
| C | 0 | 15 | 0 |
| D | 0 | 15 | 0 |
| Mode M0 | |||
|---|---|---|---|
| Quadrant | BADHDUFLAG | Total packets | Discarded packets |
| A | 0 | 14717 | 2 |
| B | 0 | 14338 | 2 |
| C | 0 | 13661 | 2 |
| D | 0 | 13605 | 2 |
| Mode SS | |||
|---|---|---|---|
| Quadrant | BADHDUFLAG | Total packets | Discarded packets |
| A | 0 | 126 | 0 |
| B | 0 | 126 | 0 |
| C | 0 | 126 | 0 |
| D | 0 | 126 | 0 |
| Quadrant | Total seconds | Saturated seconds | Saturation percentage |
|---|---|---|---|
| A | 6240 | 93 | 1.490385% |
| B | 6240 | 82 | 1.314103% |
| C | 6239 | 85 | 1.362398% |
| D | 6239 | 42 | 0.673185% |
Noise dominated data is calculated using 1-second bins in cleaned event files. If a bin has >2000 counts, and if more than 50% of those come from <1% of pixels, then it is considered to be noise-dominated and hence unusable.
| Quadrant | # 1 sec bins | Bins with >0 counts | Bins with >2000 counts | High rate bins dominated by noise | Noise dominated (total time) | Noise dominated (detector-on time) | Marked lightcurve |
|---|---|---|---|---|---|---|---|
| A | 7590 | 6241 | 31 | 31 | 0.41% | 0.50% | 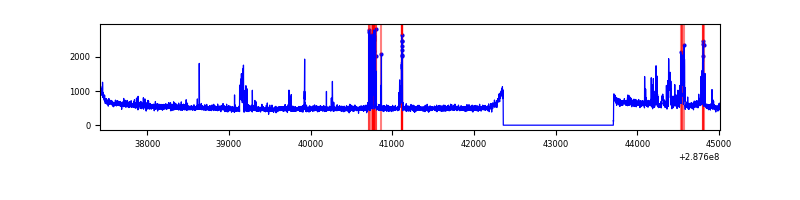 |
| B | 7590 | 6241 | 9 | 9 | 0.12% | 0.14% | 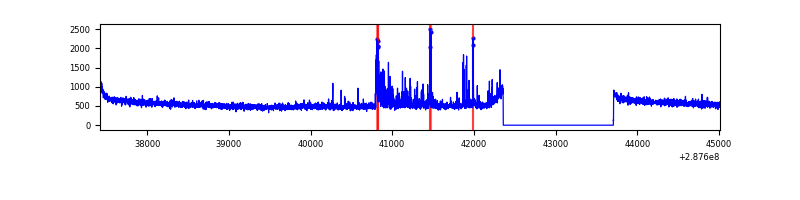 |
| C | 7589 | 6240 | 0 | 0 | 0.00% | 0.00% | 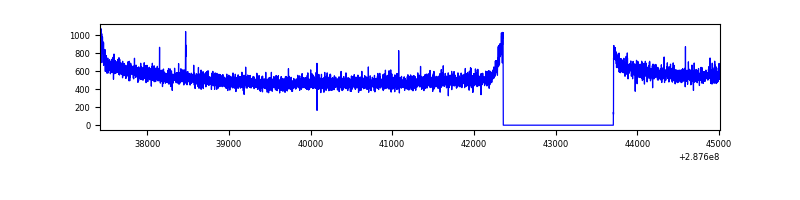 |
| D | 7589 | 6240 | 11 | 11 | 0.14% | 0.18% | 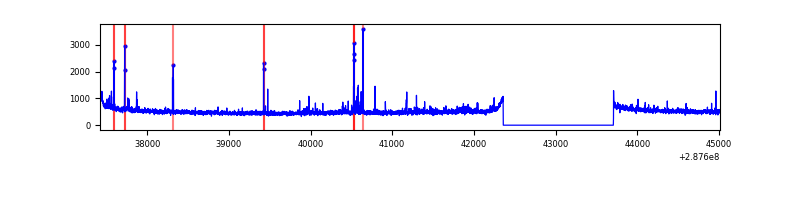 |
Top three noisy pixels from each quadrant. If the there are fewer than three noisy pixels in the level2.evt file, extra rows are filled as -1
| Pixel properties | Quadrant properties | ||||||
|---|---|---|---|---|---|---|---|
| Quadrant | DetID | PixID | Counts | Sigma | Mean | Median | Sigma |
| A | 15 | 174 | 322543 | 1882.55 | 858 | 843 | 170.9 |
| A | 4 | 2 | 9225 | 49.05 | 858 | 843 | 170.9 |
| A | 0 | 226 | 7600 | 39.54 | 858 | 843 | 170.9 |
| B | 7 | 220 | 115962 | 714.28 | 858 | 841 | 161.2 |
| B | 6 | 36 | 44111 | 268.47 | 858 | 841 | 161.2 |
| B | 12 | 111 | 18145 | 107.36 | 858 | 841 | 161.2 |
| C | 14 | 238 | 129118 | 691.08 | 806 | 813 | 185.7 |
| C | 3 | 233 | 13296 | 67.24 | 806 | 813 | 185.7 |
| C | 0 | 207 | 7656 | 36.86 | 806 | 813 | 185.7 |
| D | 1 | 52 | 43185 | 215.15 | 818 | 795 | 197.0 |
| D | 7 | 238 | 37877 | 188.21 | 818 | 795 | 197.0 |
| D | 13 | 168 | 33885 | 167.95 | 818 | 795 | 197.0 |
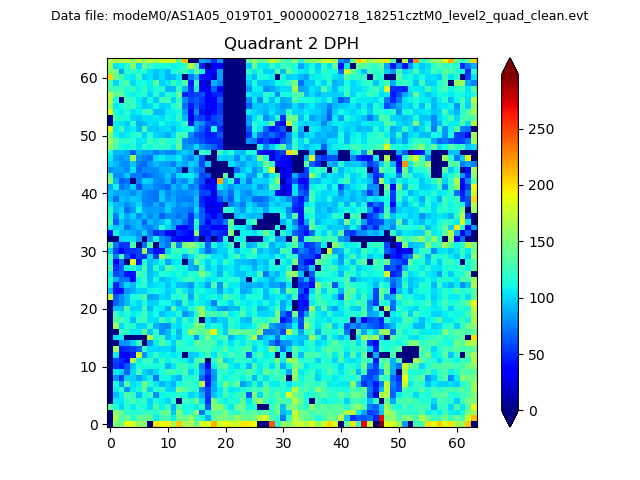
Histogram calculated using DETX and DETY for each event in the final _common_clean file
| Quadrant A | 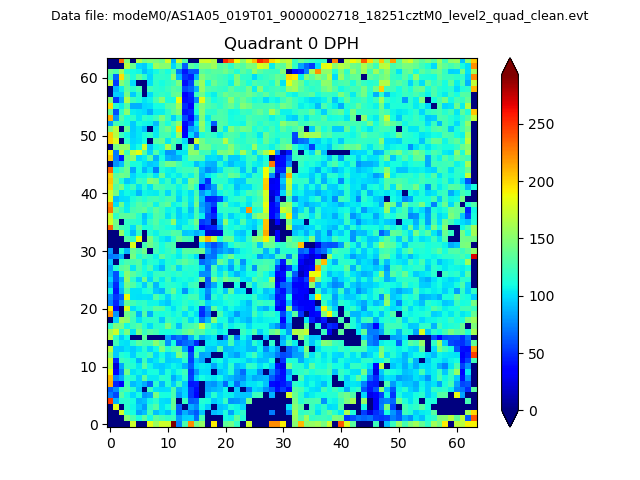 |
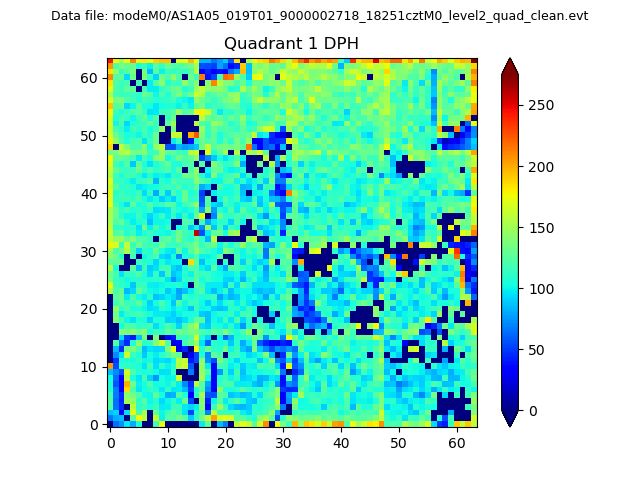 |
Quadrant B |
|---|---|---|---|
| Quadrant D | 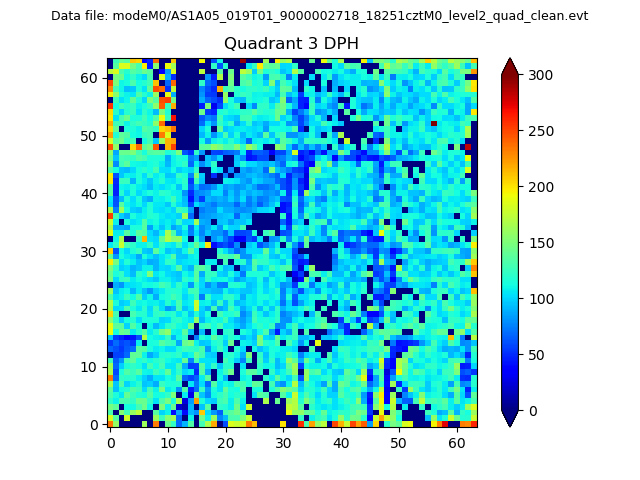 |
 |
Quadrant C |
| Plot type | Count rate plots | Images |
|---|---|---|
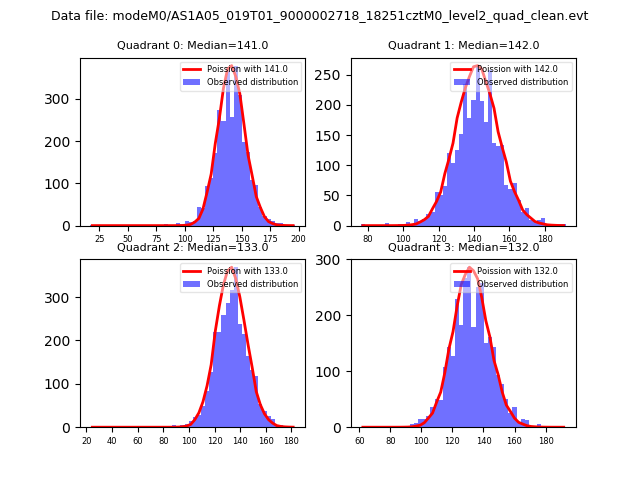
| Comparison with Poisson distribution Blue bars denote a histogram of data divided into 1 sec bins. Red curve is a Poisson curve with rate = median count rate of data. |
 |
 |
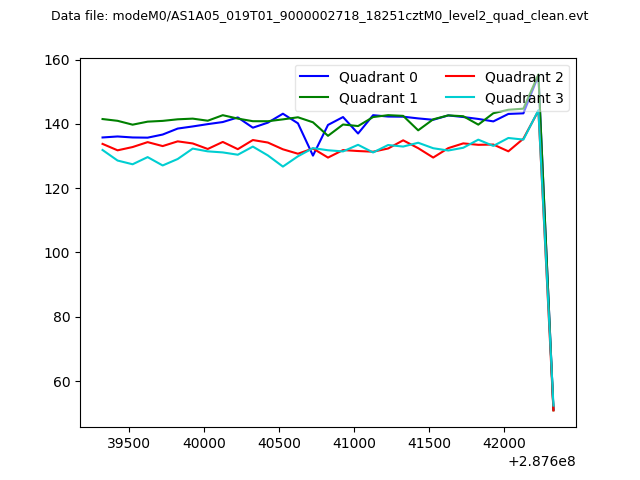
| Quadrant-wise count rates Data is divided into 100 sec bins |
 |
|
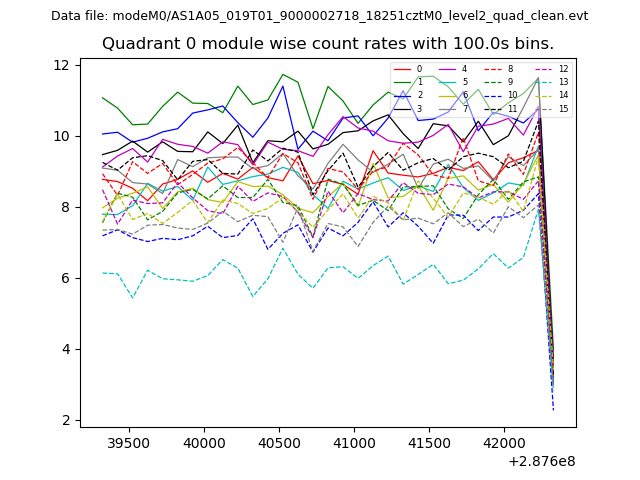
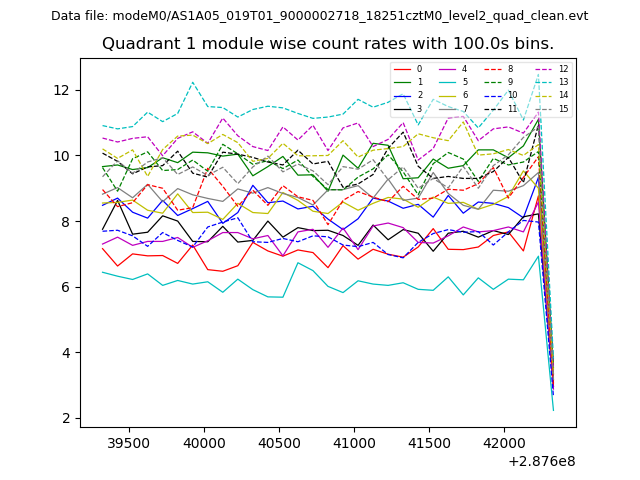
| Module-wise count rates for Quadrant A Data is divided into 100 sec bins |
 |
 |
| Module-wise count rates for Quadrant B Data is divided into 100 sec bins |
 |
 |
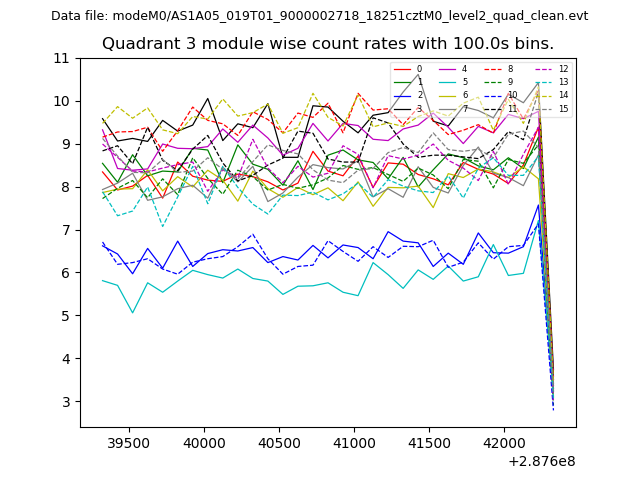
| Module-wise count rates for Quadrant C Data is divided into 100 sec bins |
 |
 |
| Module-wise count rates for Quadrant D Data is divided into 100 sec bins |
 |
 |
| Parameter | Plot |
|---|---|
| CZT HV Monitor | 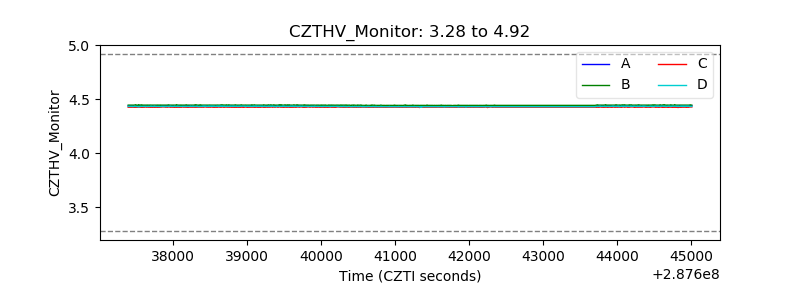 |
| D_VDD | 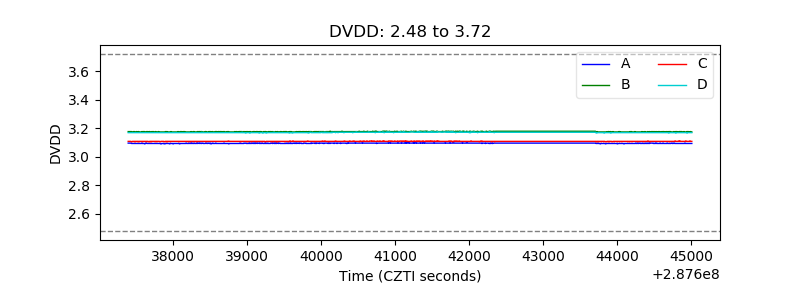 |
| Temperature 1 | 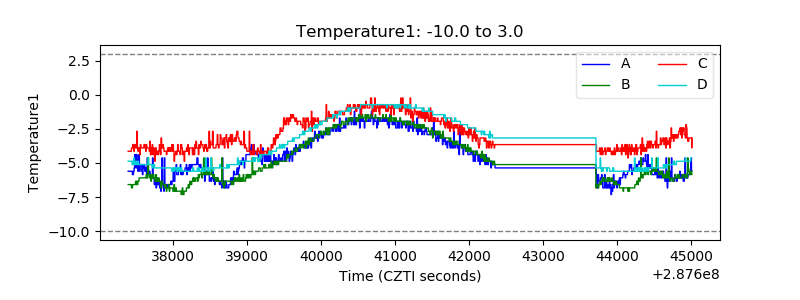 |
| Veto HV Monitor | 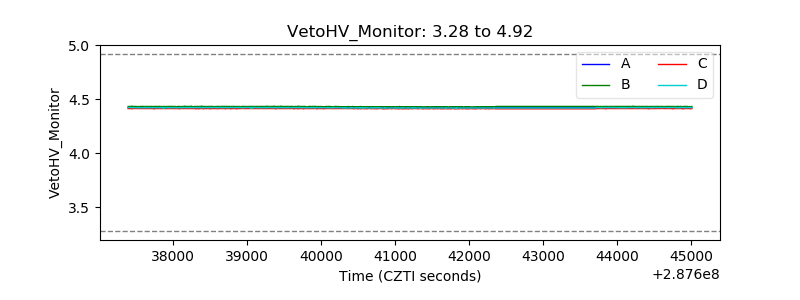 |
| Veto LLD | 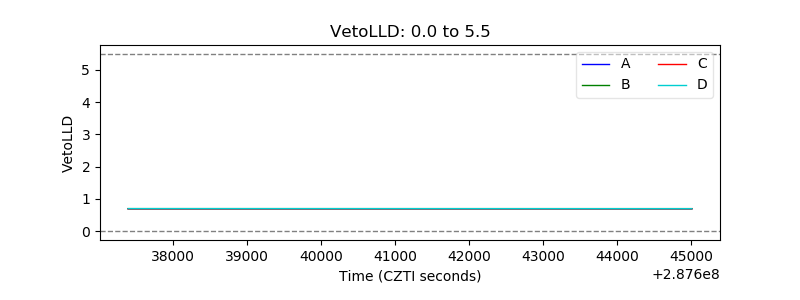 |
| Alpha Counter | 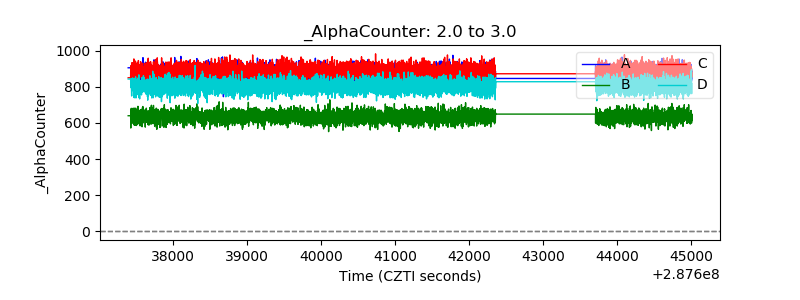 |
| _CPM_Rate | 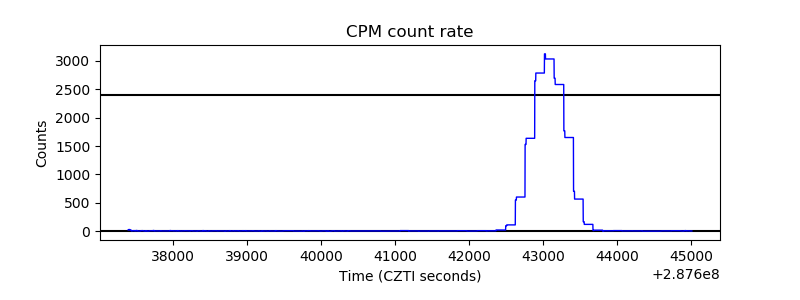 |
| CZT Counter |  |
| +2.5 Volts monitor | 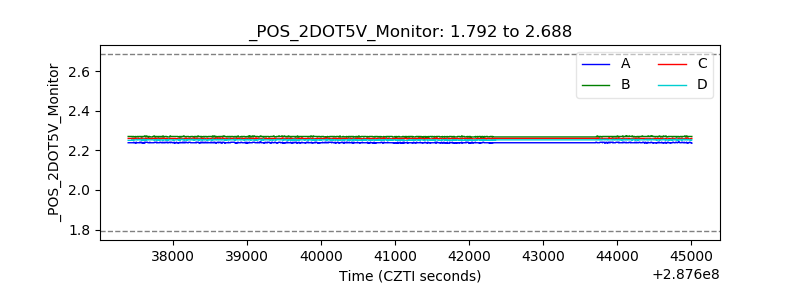 |
| +5 Volts monitor |  |
| _ROLL_ROT | 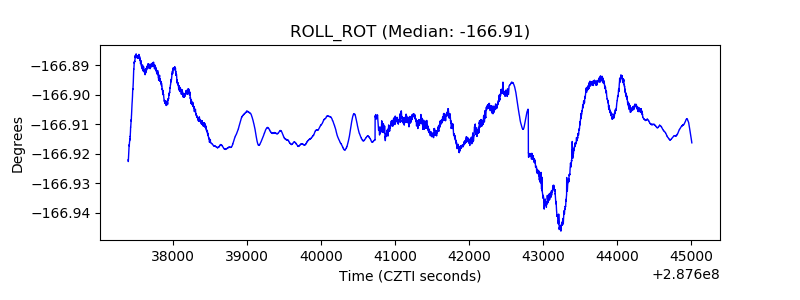 |
| _Roll_DEC | 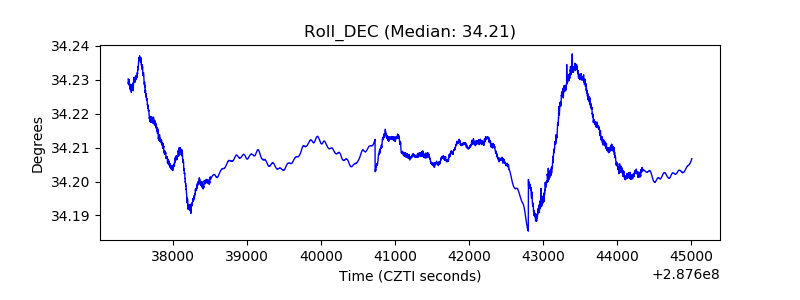 |
| _Roll_RA |  |
| Veto Counter | 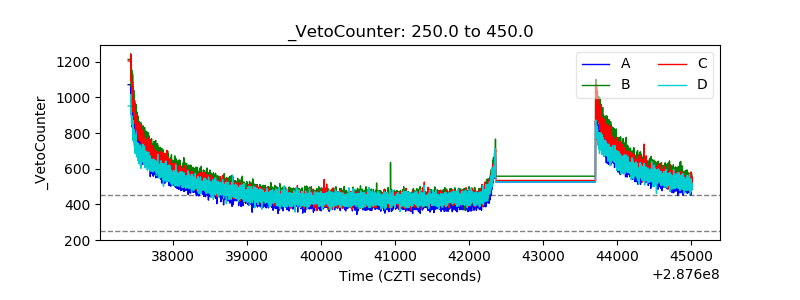 |