| Param | Original file | Final file |
|---|---|---|
| Filename | modeM0/AS1A05_019T01_9000002718_18252cztM0_level2.evt | modeM0/AS1A05_019T01_9000002718_18252cztM0_level2_quad_clean.evt |
| Size (bytes) | 461,093,760 | 81,616,320 |
| Size | 439.7 MB | 77.8 MB |
| Events in quadrant A | 3,587,381 | 525,195 |
| Events in quadrant B | 3,450,897 | 534,202 |
| Events in quadrant C | 3,274,277 | 493,656 |
| Events in quadrant D | 3,237,123 | 491,995 |
| Mode M9 | |||
|---|---|---|---|
| Quadrant | BADHDUFLAG | Total packets | Discarded packets |
| A | 0 | 21 | 0 |
| B | 0 | 22 | 0 |
| C | 0 | 22 | 0 |
| D | 0 | 22 | 0 |
| Mode M0 | |||
|---|---|---|---|
| Quadrant | BADHDUFLAG | Total packets | Discarded packets |
| A | 0 | 14638 | 2 |
| B | 0 | 13992 | 2 |
| C | 0 | 13397 | 2 |
| D | 0 | 13338 | 2 |
| Mode SS | |||
|---|---|---|---|
| Quadrant | BADHDUFLAG | Total packets | Discarded packets |
| A | 0 | 124 | 0 |
| B | 0 | 124 | 0 |
| C | 0 | 124 | 0 |
| D | 0 | 124 | 0 |
| Quadrant | Total seconds | Saturated seconds | Saturation percentage |
|---|---|---|---|
| A | 6108 | 68 | 1.113294% |
| B | 6108 | 63 | 1.031434% |
| C | 6108 | 73 | 1.195154% |
| D | 6108 | 27 | 0.442043% |
Noise dominated data is calculated using 1-second bins in cleaned event files. If a bin has >2000 counts, and if more than 50% of those come from <1% of pixels, then it is considered to be noise-dominated and hence unusable.
| Quadrant | # 1 sec bins | Bins with >0 counts | Bins with >2000 counts | High rate bins dominated by noise | Noise dominated (total time) | Noise dominated (detector-on time) | Marked lightcurve |
|---|---|---|---|---|---|---|---|
| A | 7513 | 6109 | 8 | 8 | 0.11% | 0.13% | 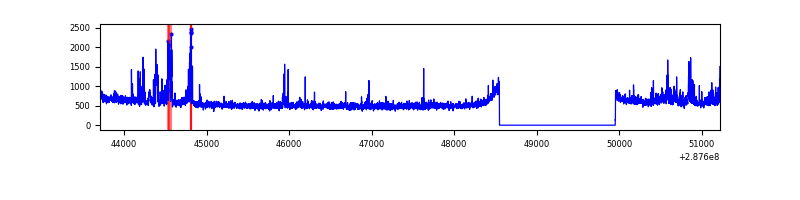 |
| B | 7513 | 6109 | 6 | 6 | 0.08% | 0.10% | 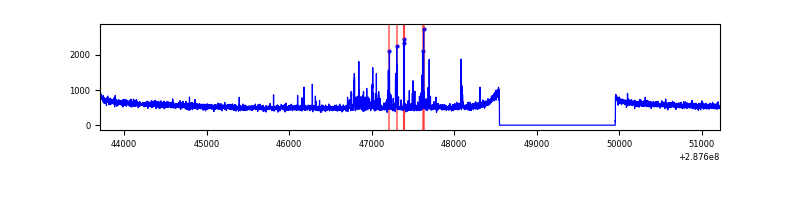 |
| C | 7513 | 6109 | 0 | 0 | 0.00% | 0.00% | 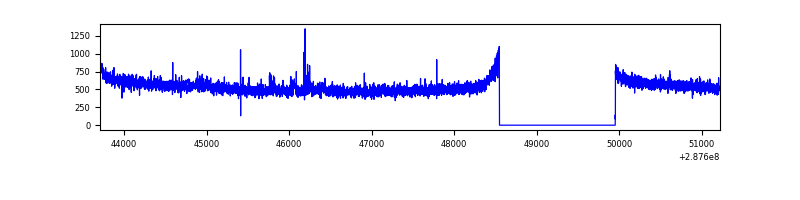 |
| D | 7513 | 6109 | 5 | 5 | 0.07% | 0.08% | 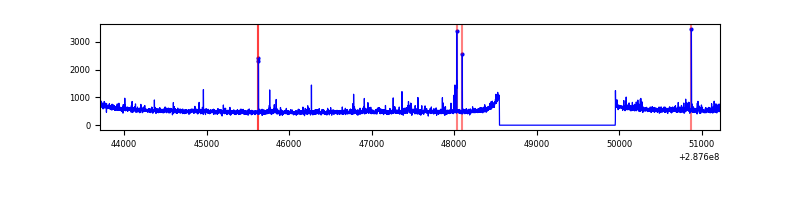 |
Top three noisy pixels from each quadrant. If the there are fewer than three noisy pixels in the level2.evt file, extra rows are filled as -1
| Pixel properties | Quadrant properties | ||||||
|---|---|---|---|---|---|---|---|
| Quadrant | DetID | PixID | Counts | Sigma | Mean | Median | Sigma |
| A | 15 | 174 | 289544 | 1697.3 | 853 | 836 | 170.1 |
| A | 4 | 2 | 20025 | 112.81 | 853 | 836 | 170.1 |
| A | 0 | 226 | 7611 | 39.83 | 853 | 836 | 170.1 |
| B | 7 | 220 | 108563 | 680.91 | 850 | 834 | 158.2 |
| B | 12 | 111 | 17804 | 107.26 | 850 | 834 | 158.2 |
| B | 11 | 111 | 15354 | 91.78 | 850 | 834 | 158.2 |
| C | 14 | 238 | 128645 | 695.56 | 796 | 803 | 183.8 |
| C | 3 | 233 | 42607 | 227.45 | 796 | 803 | 183.8 |
| C | 13 | 61 | 5741 | 26.87 | 796 | 803 | 183.8 |
| D | 7 | 238 | 61225 | 312.01 | 811 | 789 | 193.7 |
| D | 1 | 52 | 50807 | 258.23 | 811 | 789 | 193.7 |
| D | 13 | 168 | 28543 | 143.29 | 811 | 789 | 193.7 |
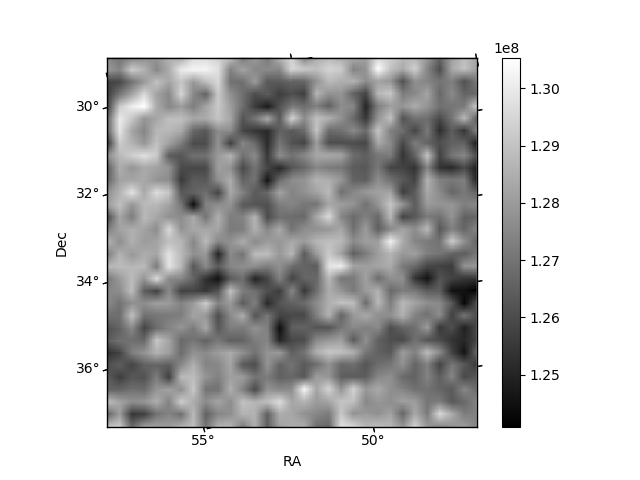
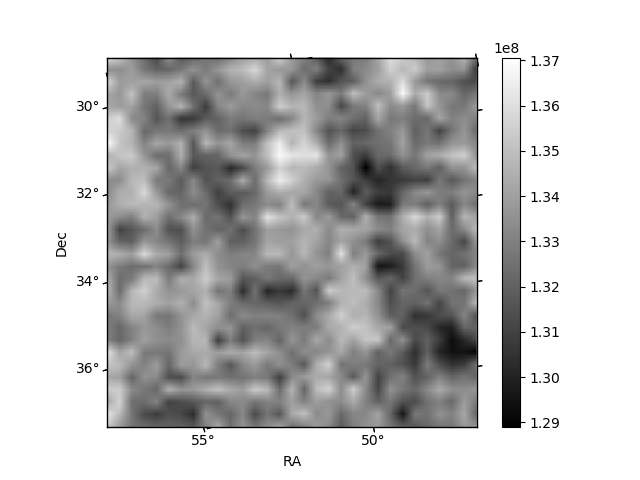
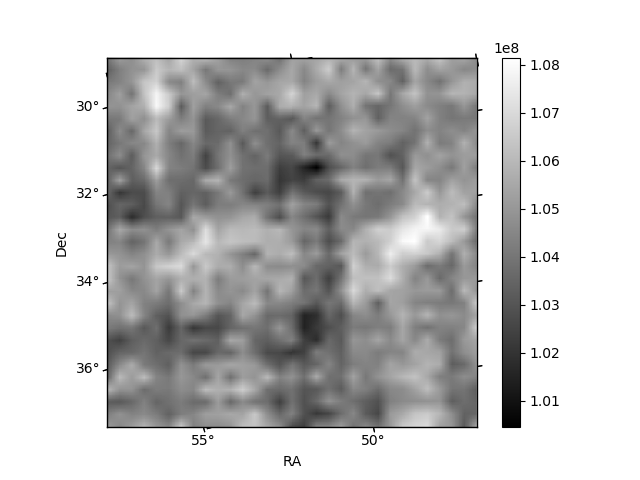
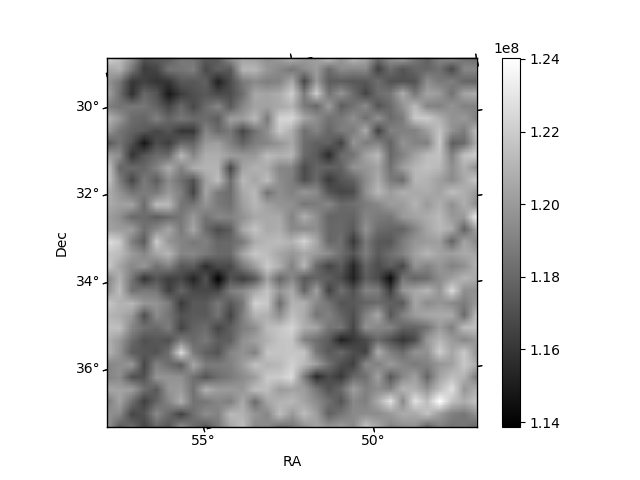
Histogram calculated using DETX and DETY for each event in the final _common_clean file
| Quadrant A |  |
 |
Quadrant B |
|---|---|---|---|
| Quadrant D |  |
 |
Quadrant C |
| Plot type | Count rate plots | Images |
|---|---|---|
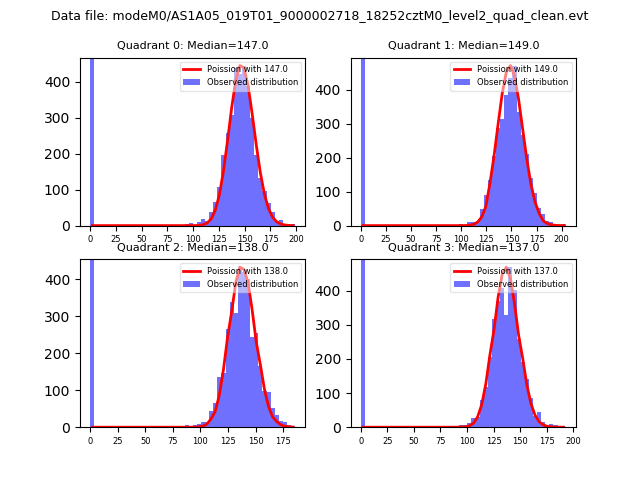
| Comparison with Poisson distribution Blue bars denote a histogram of data divided into 1 sec bins. Red curve is a Poisson curve with rate = median count rate of data. |
 |
 |
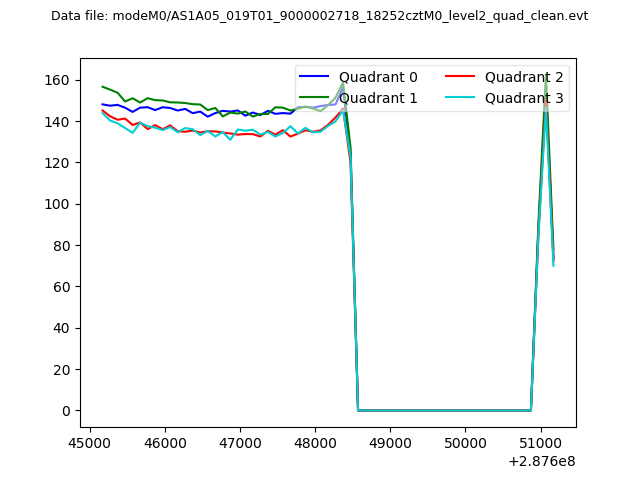
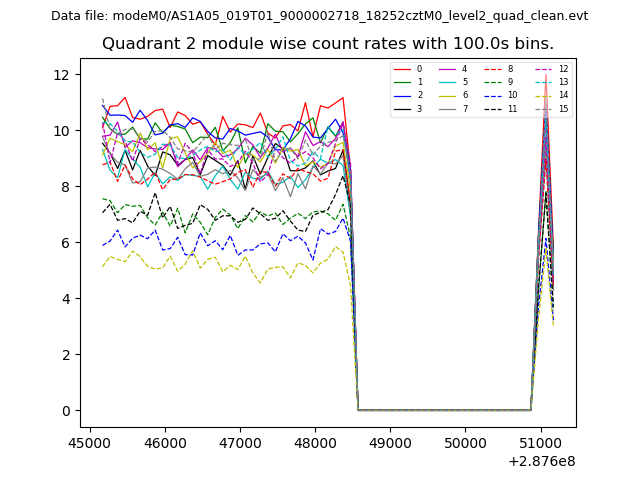
| Quadrant-wise count rates Data is divided into 100 sec bins |
 |
|
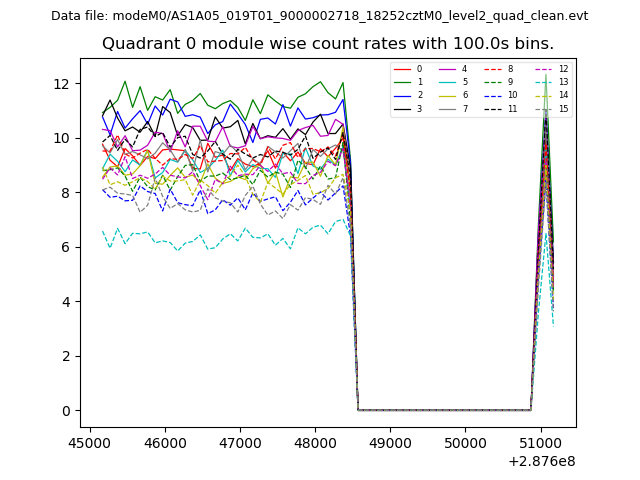
| Module-wise count rates for Quadrant A Data is divided into 100 sec bins |
 |
 |
| Module-wise count rates for Quadrant B Data is divided into 100 sec bins |
 |
 |
| Module-wise count rates for Quadrant C Data is divided into 100 sec bins |
 |
 |
| Module-wise count rates for Quadrant D Data is divided into 100 sec bins |
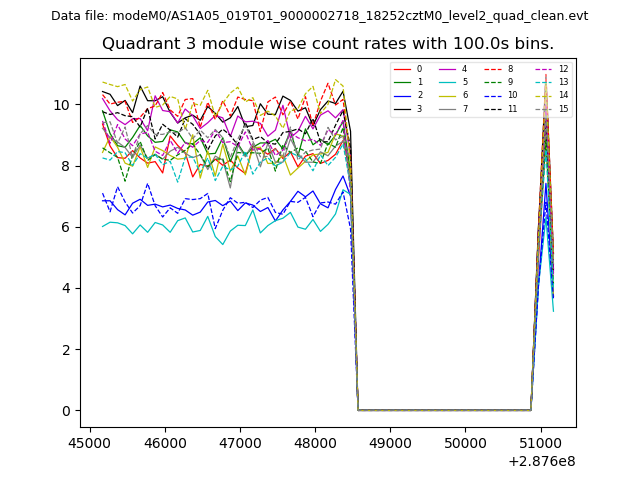 |
 |
| Parameter | Plot |
|---|---|
| CZT HV Monitor | 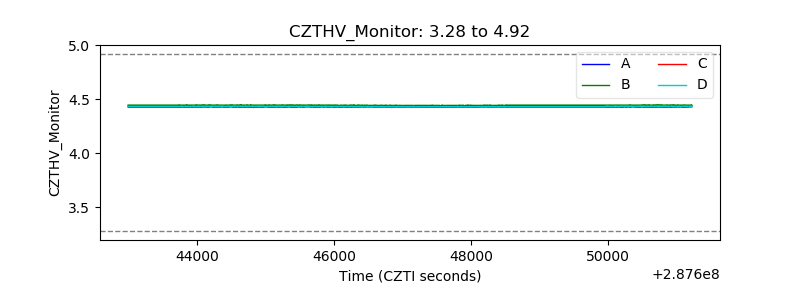 |
| D_VDD | 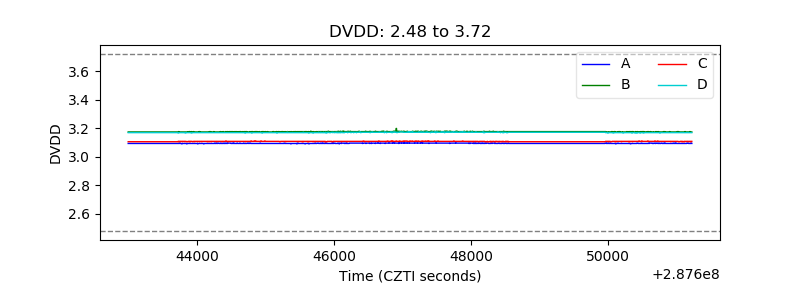 |
| Temperature 1 | 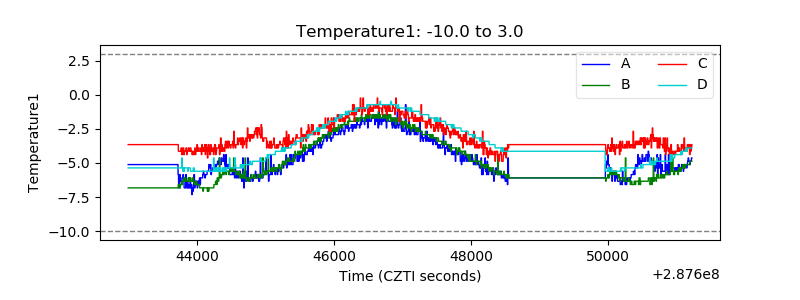 |
| Veto HV Monitor | 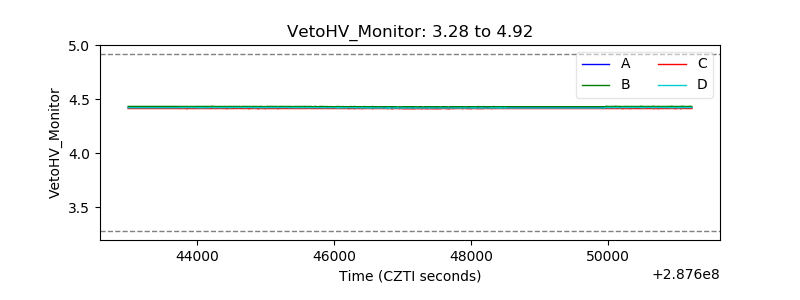 |
| Veto LLD | 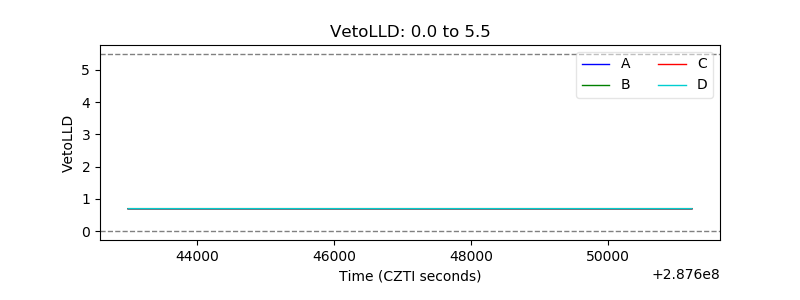 |
| Alpha Counter | 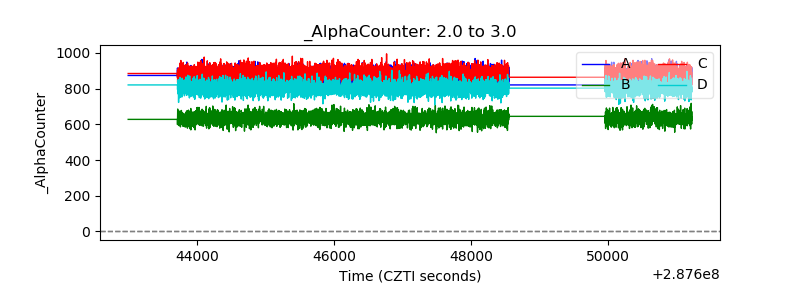 |
| _CPM_Rate | 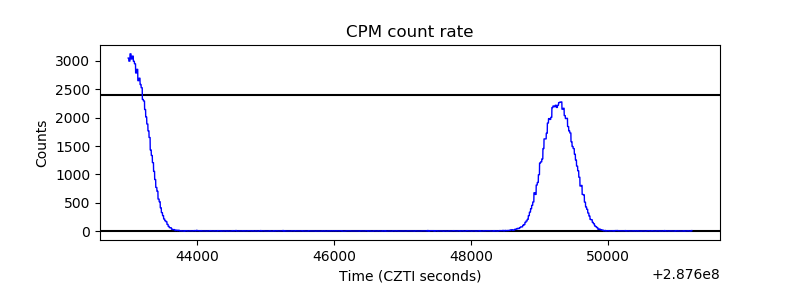 |
| CZT Counter | 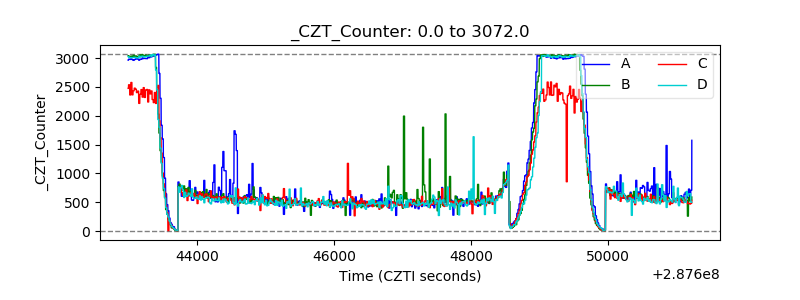 |
| +2.5 Volts monitor | 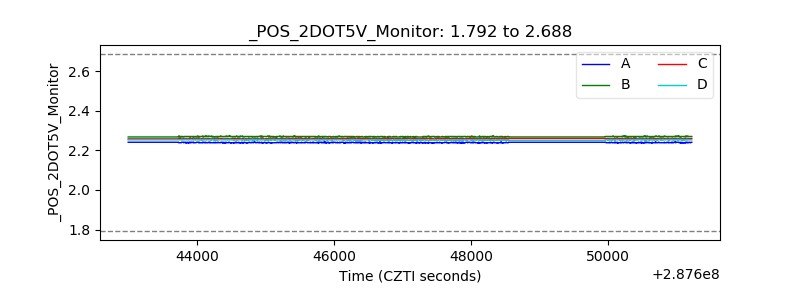 |
| +5 Volts monitor |  |
| _ROLL_ROT | 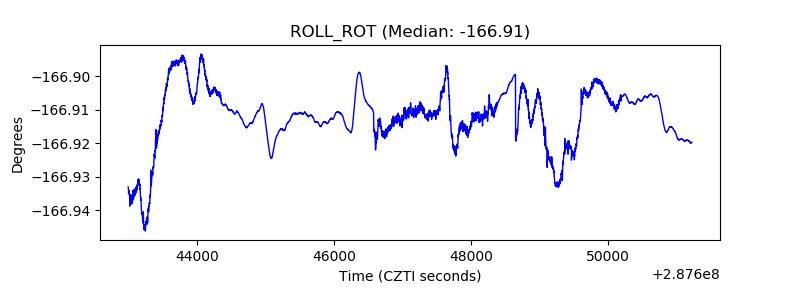 |
| _Roll_DEC | 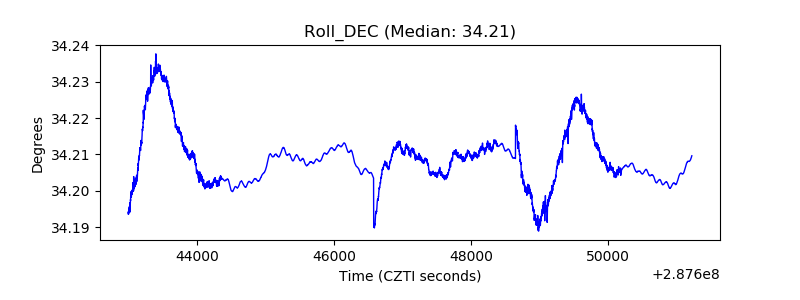 |
| _Roll_RA | 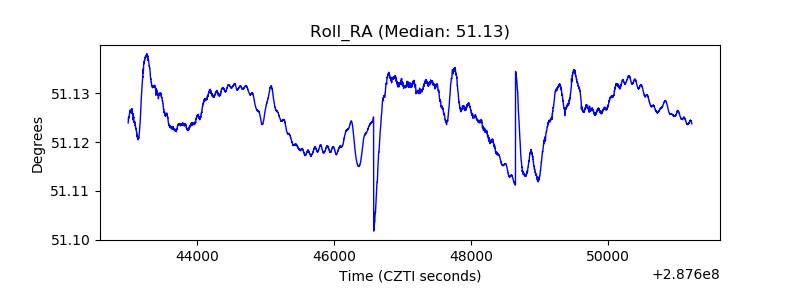 |
| Veto Counter | 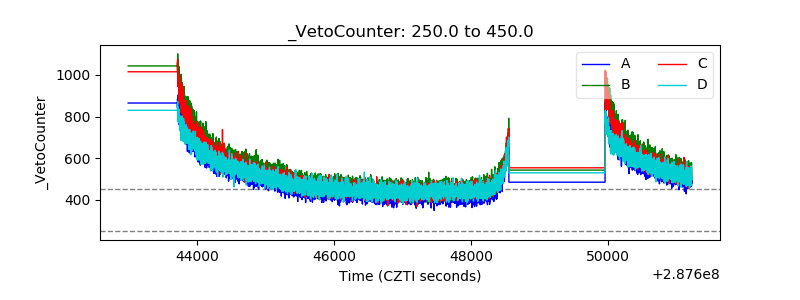 |