| Param | Original file | Final file |
|---|---|---|
| Filename | modeM0/AS1A05_019T01_9000002718_18254cztM0_level2.evt | modeM0/AS1A05_019T01_9000002718_18254cztM0_level2_quad_clean.evt |
| Size (bytes) | 475,102,080 | 100,454,400 |
| Size | 453.1 MB | 95.8 MB |
| Events in quadrant A | 3,407,348 | 667,031 |
| Events in quadrant B | 3,373,698 | 675,304 |
| Events in quadrant C | 3,238,886 | 628,354 |
| Events in quadrant D | 3,926,736 | 618,085 |
| Mode M9 | |||
|---|---|---|---|
| Quadrant | BADHDUFLAG | Total packets | Discarded packets |
| A | 0 | 17 | 0 |
| B | 0 | 18 | 0 |
| C | 0 | 18 | 0 |
| D | 0 | 18 | 0 |
| Mode M0 | |||
|---|---|---|---|
| Quadrant | BADHDUFLAG | Total packets | Discarded packets |
| A | 0 | 14001 | 2 |
| B | 0 | 13892 | 2 |
| C | 0 | 13634 | 3 |
| D | 0 | 15744 | 2 |
| Mode SS | |||
|---|---|---|---|
| Quadrant | BADHDUFLAG | Total packets | Discarded packets |
| A | 0 | 134 | 0 |
| B | 0 | 134 | 0 |
| C | 0 | 134 | 0 |
| D | 0 | 134 | 0 |
| Quadrant | Total seconds | Saturated seconds | Saturation percentage |
|---|---|---|---|
| A | 6496 | 141 | 2.170567% |
| B | 6496 | 149 | 2.293719% |
| C | 6495 | 142 | 2.186297% |
| D | 6495 | 138 | 2.124711% |
Noise dominated data is calculated using 1-second bins in cleaned event files. If a bin has >2000 counts, and if more than 50% of those come from <1% of pixels, then it is considered to be noise-dominated and hence unusable.
| Quadrant | # 1 sec bins | Bins with >0 counts | Bins with >2000 counts | High rate bins dominated by noise | Noise dominated (total time) | Noise dominated (detector-on time) | Marked lightcurve |
|---|---|---|---|---|---|---|---|
| A | 7606 | 6497 | 15 | 15 | 0.20% | 0.23% | 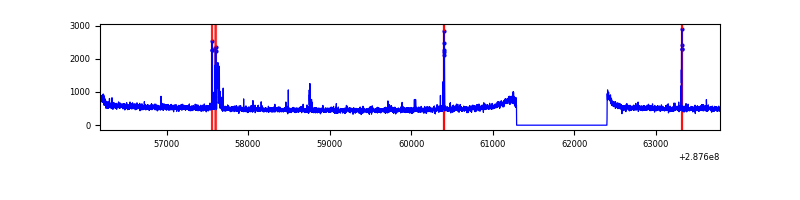 |
| B | 7606 | 6497 | 1 | 1 | 0.01% | 0.02% | 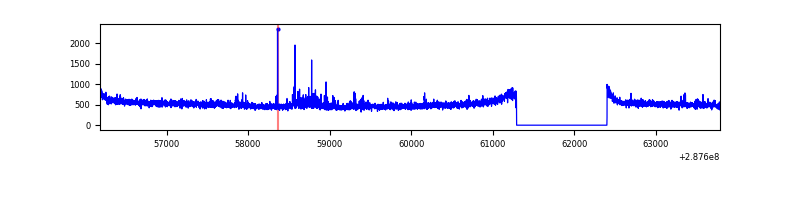 |
| C | 7605 | 6496 | 0 | 0 | 0.00% | 0.00% | 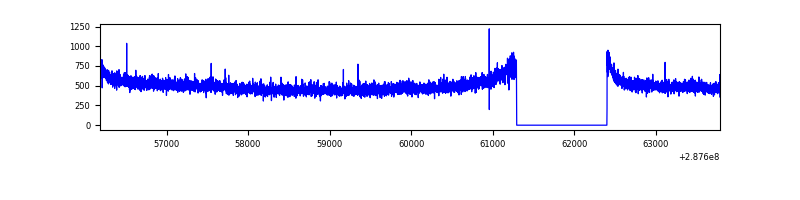 |
| D | 7605 | 6496 | 74 | 74 | 0.97% | 1.14% | 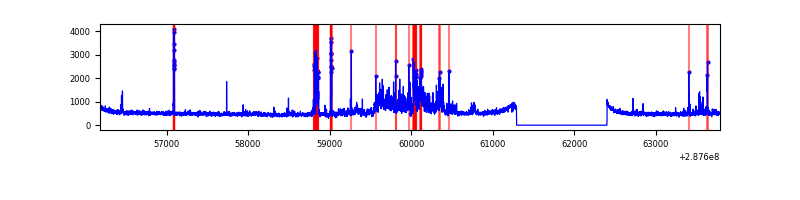 |
Top three noisy pixels from each quadrant. If the there are fewer than three noisy pixels in the level2.evt file, extra rows are filled as -1
| Pixel properties | Quadrant properties | ||||||
|---|---|---|---|---|---|---|---|
| Quadrant | DetID | PixID | Counts | Sigma | Mean | Median | Sigma |
| A | 15 | 174 | 118778 | 687.95 | 855 | 838 | 171.4 |
| A | 0 | 226 | 7689 | 39.96 | 855 | 838 | 171.4 |
| A | 12 | 194 | 6355 | 32.18 | 855 | 838 | 171.4 |
| B | 7 | 220 | 53279 | 327.11 | 845 | 826 | 160.4 |
| B | 12 | 111 | 18711 | 111.53 | 845 | 826 | 160.4 |
| B | 11 | 111 | 16371 | 96.94 | 845 | 826 | 160.4 |
| C | 14 | 238 | 126324 | 674.2 | 798 | 800 | 186.2 |
| C | 13 | 61 | 5528 | 25.39 | 798 | 800 | 186.2 |
| C | 3 | 233 | 3230 | 13.05 | 798 | 800 | 186.2 |
| D | 7 | 238 | 653363 | 3292.6 | 819 | 794 | 198.2 |
| D | 1 | 52 | 92285 | 461.63 | 819 | 794 | 198.2 |
| D | 7 | 96 | 32992 | 162.46 | 819 | 794 | 198.2 |
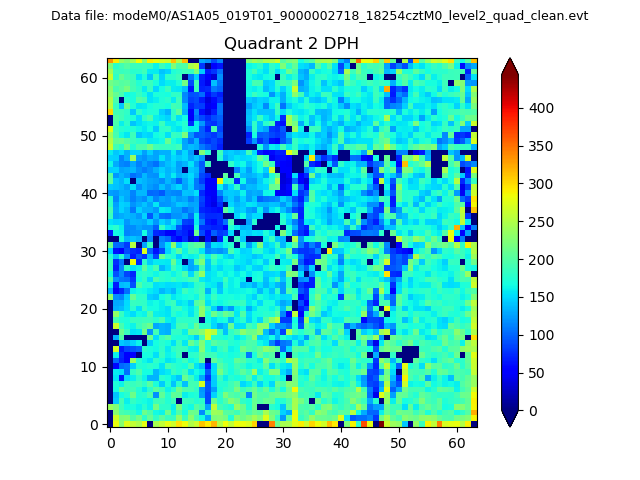
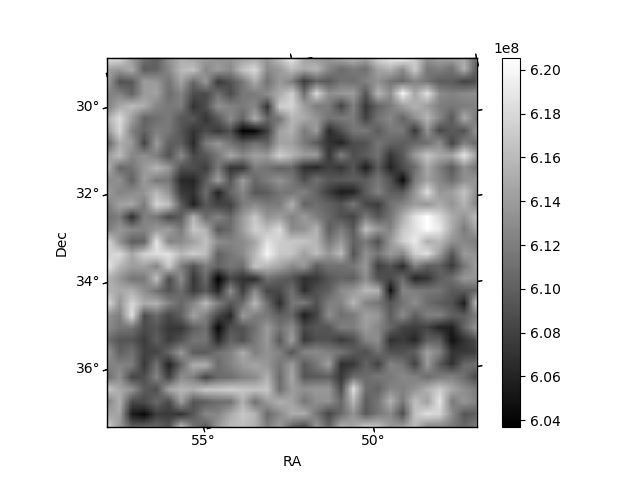
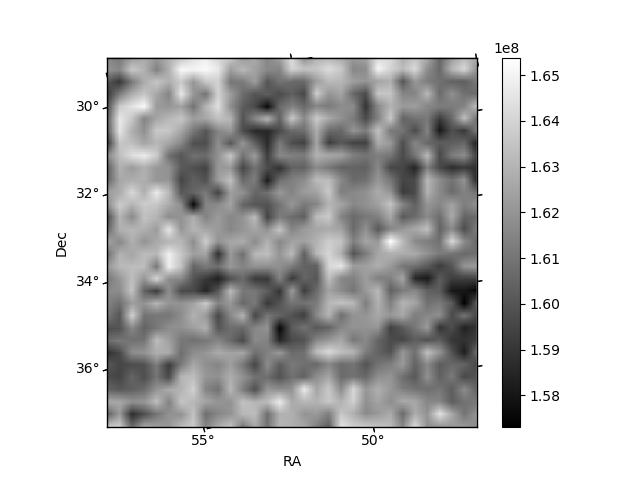
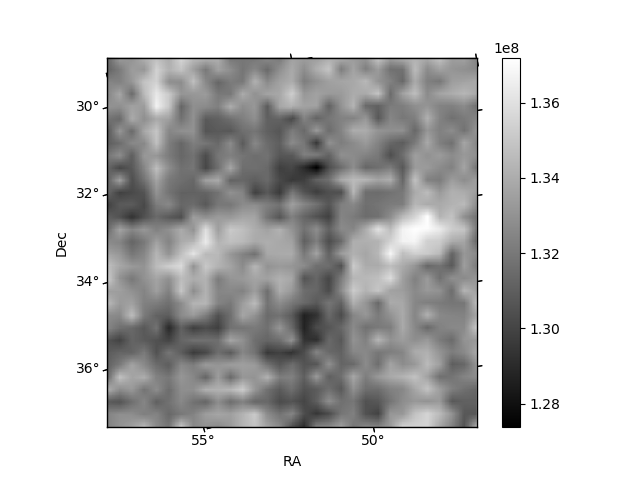
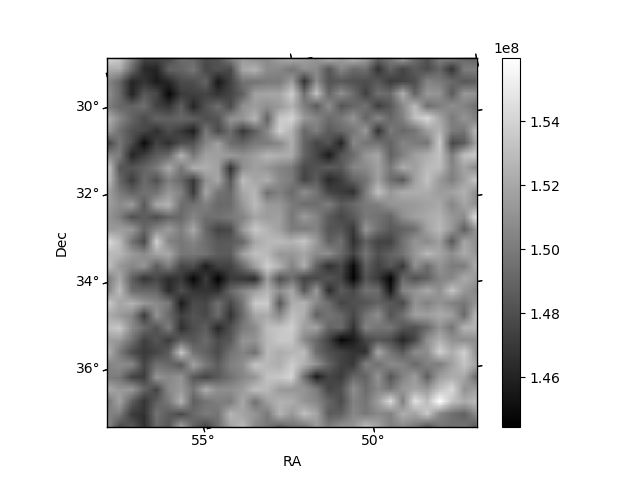
Histogram calculated using DETX and DETY for each event in the final _common_clean file
| Quadrant A | 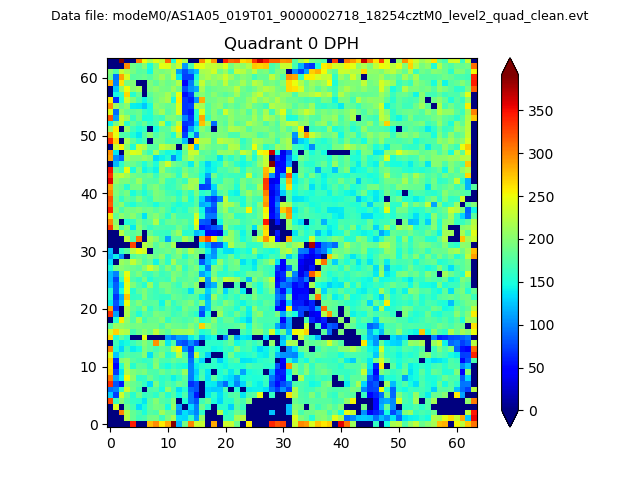 |
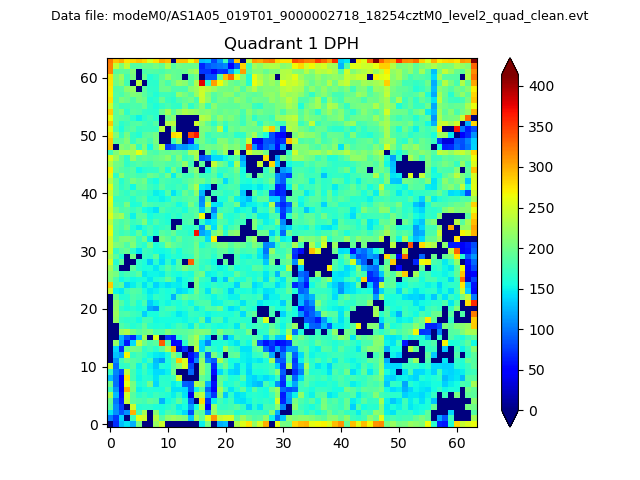 |
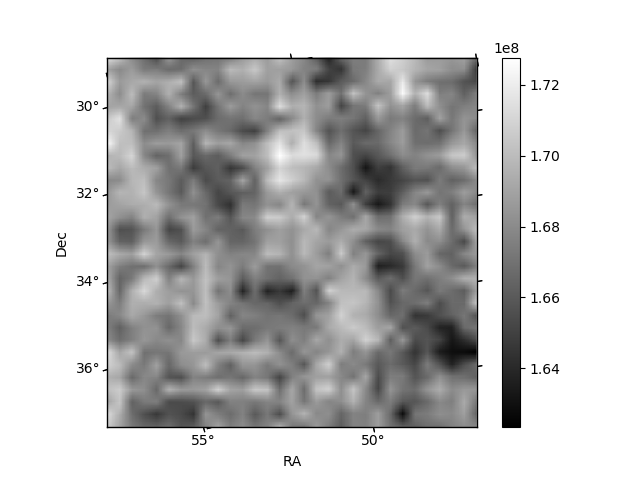
Quadrant B |
|---|---|---|---|
| Quadrant D | 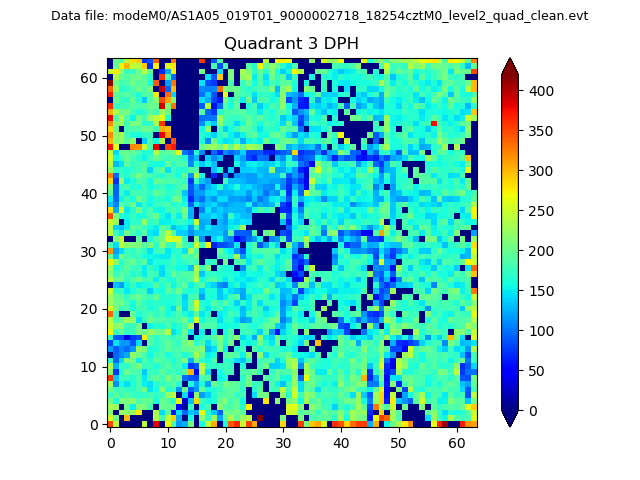 |
 |
Quadrant C |
| Plot type | Count rate plots | Images |
|---|---|---|
| Comparison with Poisson distribution Blue bars denote a histogram of data divided into 1 sec bins. Red curve is a Poisson curve with rate = median count rate of data. |
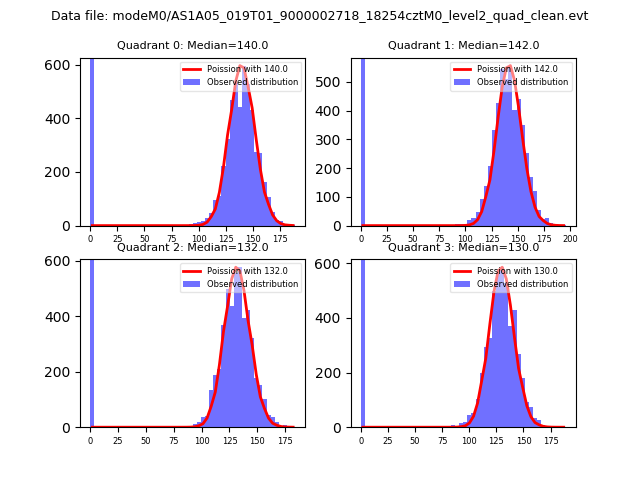 |
 |
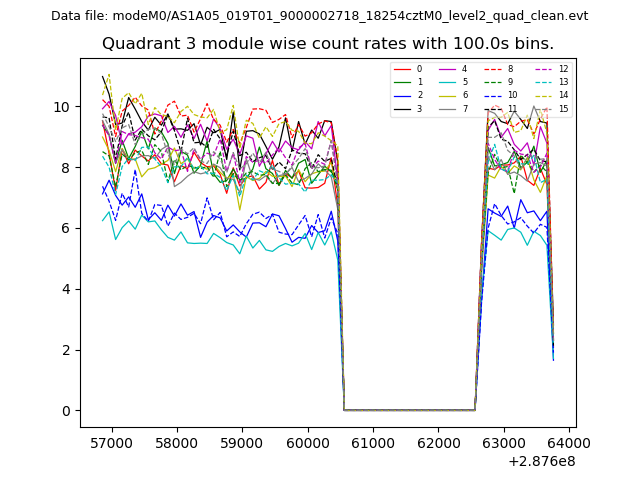
| Quadrant-wise count rates Data is divided into 100 sec bins |
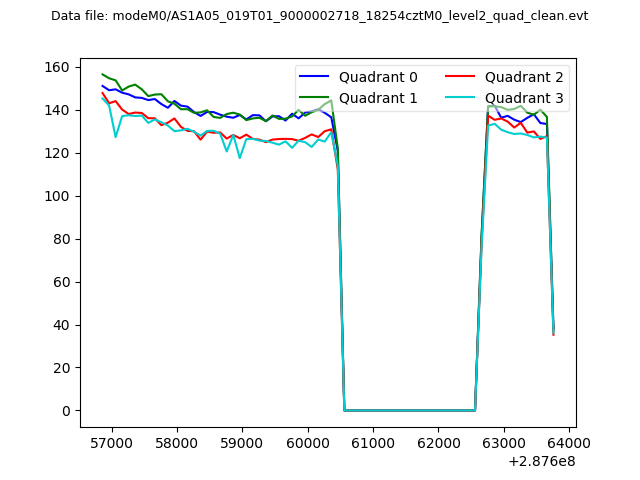 |
|
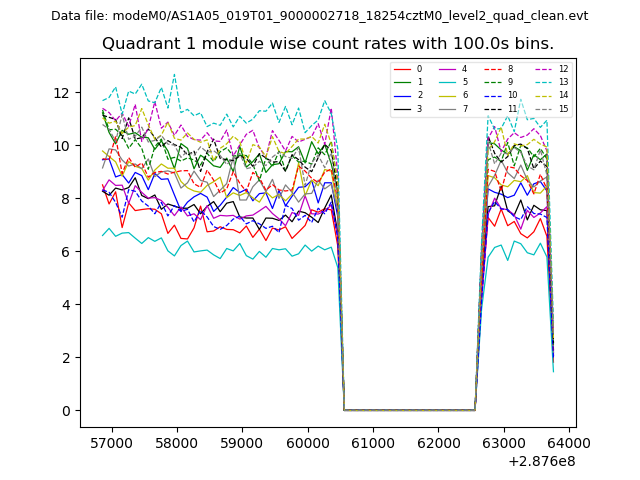
| Module-wise count rates for Quadrant A Data is divided into 100 sec bins |
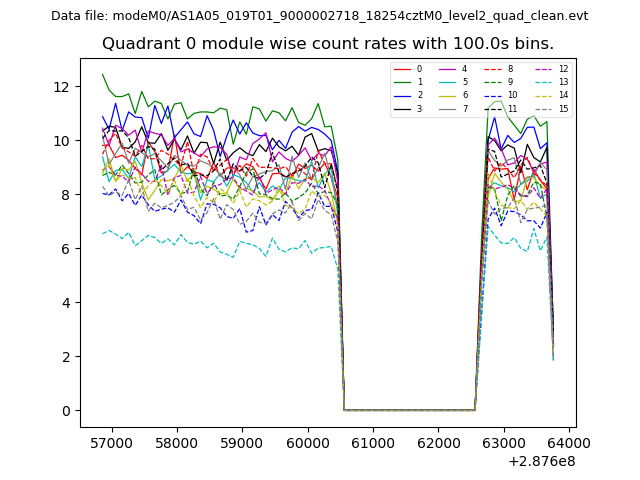 |
 |
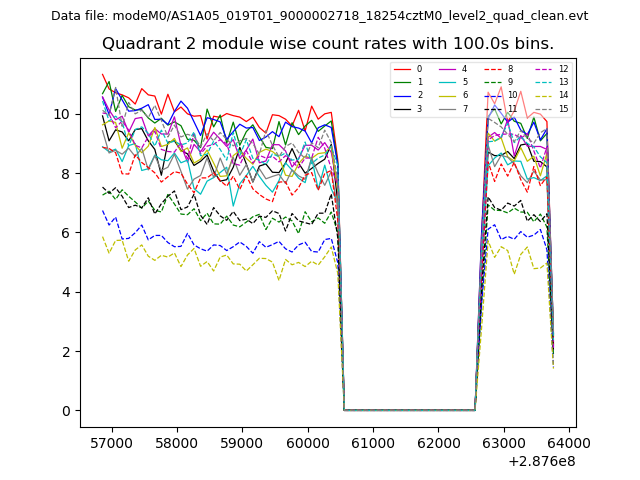
| Module-wise count rates for Quadrant B Data is divided into 100 sec bins |
 |
 |
| Module-wise count rates for Quadrant C Data is divided into 100 sec bins |
 |
 |
| Module-wise count rates for Quadrant D Data is divided into 100 sec bins |
 |
 |
| Parameter | Plot |
|---|---|
| CZT HV Monitor | 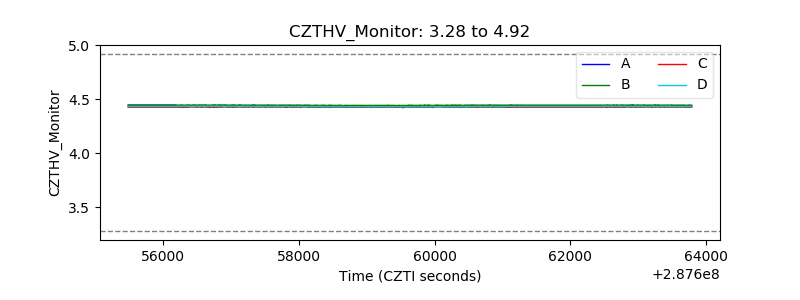 |
| D_VDD | 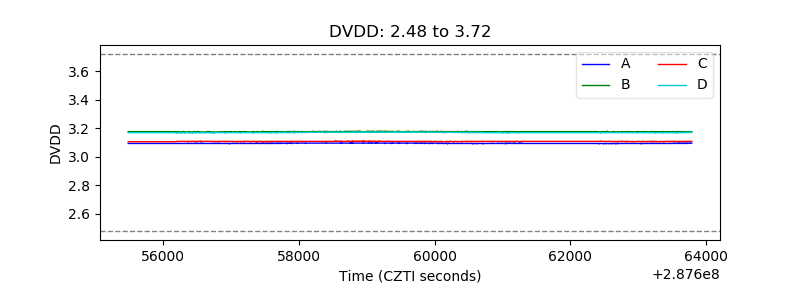 |
| Temperature 1 | 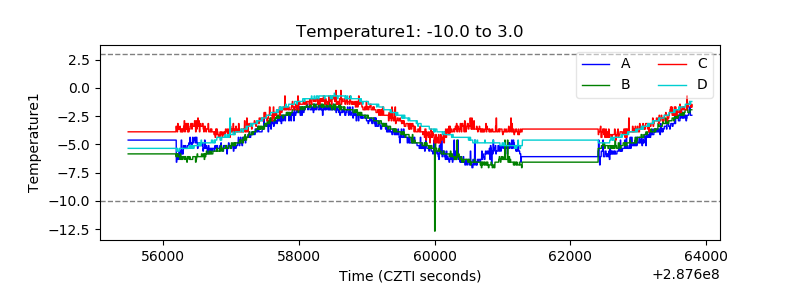 |
| Veto HV Monitor | 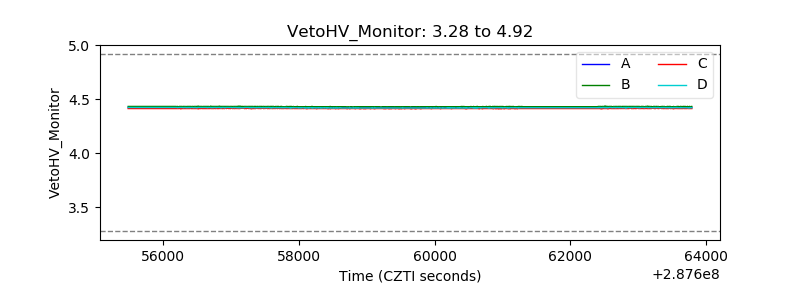 |
| Veto LLD | 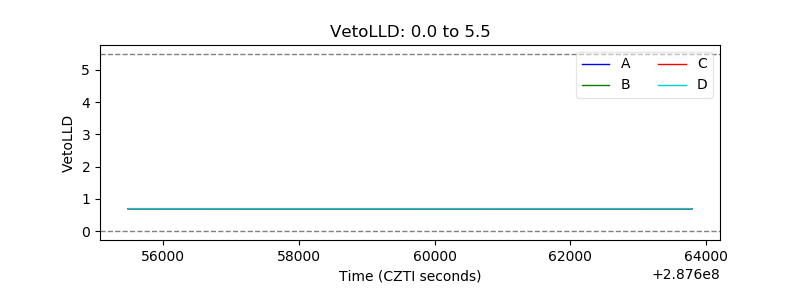 |
| Alpha Counter | 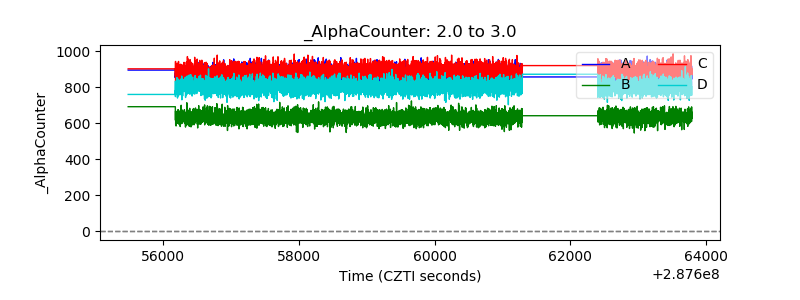 |
| _CPM_Rate | 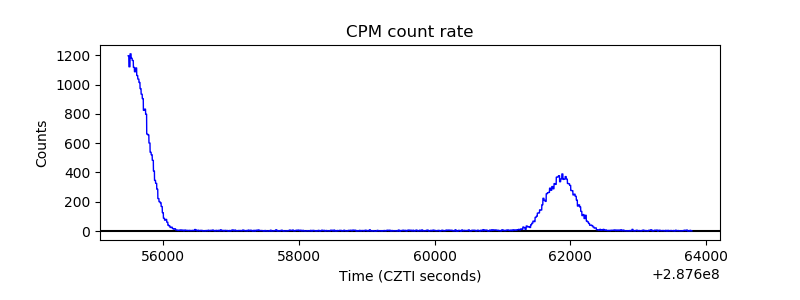 |
| CZT Counter | 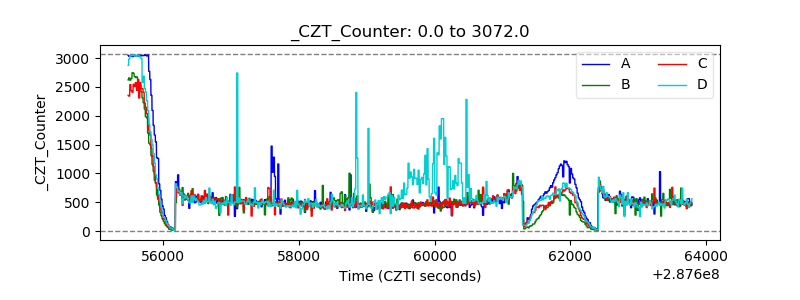 |
| +2.5 Volts monitor | 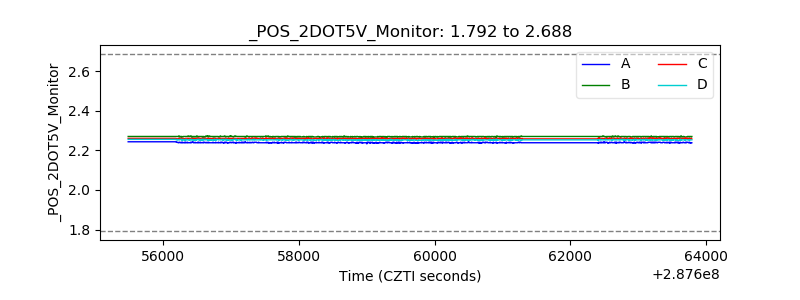 |
| +5 Volts monitor | 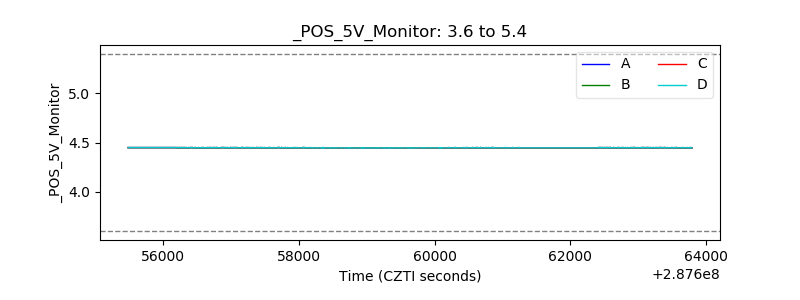 |
| _ROLL_ROT | 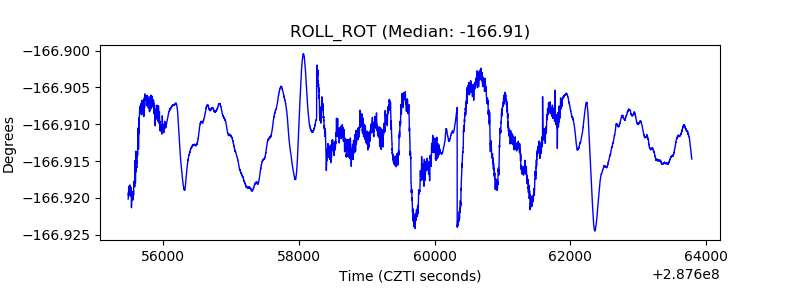 |
| _Roll_DEC | 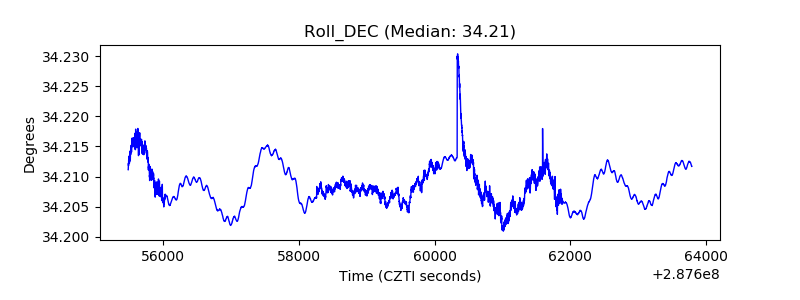 |
| _Roll_RA | 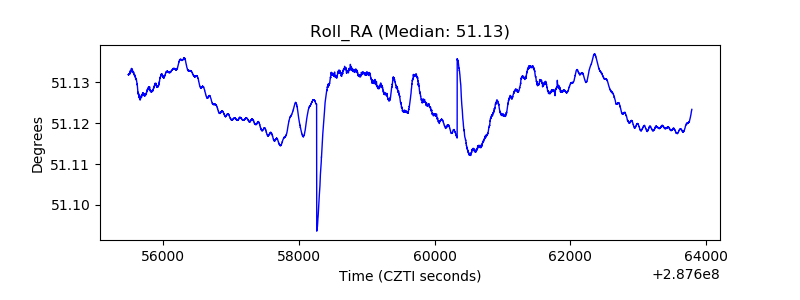 |
| Veto Counter | 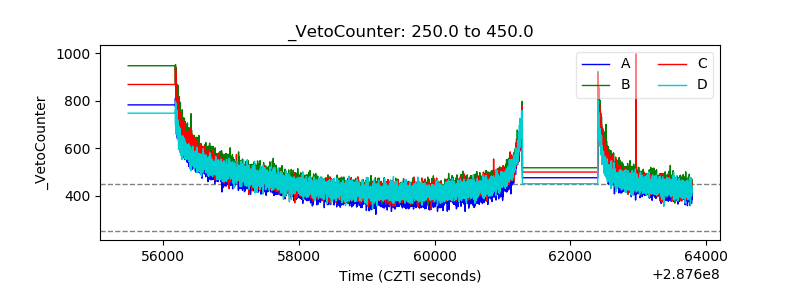 |