| Param | Original file | Final file |
|---|---|---|
| Filename | modeM0/AS1A05_019T01_9000002718_18257cztM0_level2.evt | modeM0/AS1A05_019T01_9000002718_18257cztM0_level2_quad_clean.evt |
| Size (bytes) | 505,416,960 | 98,061,120 |
| Size | 482.0 MB | 93.5 MB |
| Events in quadrant A | 3,564,873 | 633,643 |
| Events in quadrant B | 3,625,045 | 637,305 |
| Events in quadrant C | 3,432,751 | 602,847 |
| Events in quadrant D | 4,198,596 | 598,031 |
| Mode M9 | |||
|---|---|---|---|
| Quadrant | BADHDUFLAG | Total packets | Discarded packets |
| A | 0 | 2 | 0 |
| B | 0 | 2 | 0 |
| C | 0 | 2 | 0 |
| D | 0 | 2 | 0 |
| Mode M0 | |||
|---|---|---|---|
| Quadrant | BADHDUFLAG | Total packets | Discarded packets |
| A | 0 | 15379 | 2 |
| B | 0 | 15513 | 1 |
| C | 0 | 14958 | 1 |
| D | 0 | 17228 | 1 |
| Mode SS | |||
|---|---|---|---|
| Quadrant | BADHDUFLAG | Total packets | Discarded packets |
| A | 0 | 144 | 0 |
| B | 0 | 144 | 0 |
| C | 0 | 144 | 0 |
| D | 0 | 144 | 0 |
| Quadrant | Total seconds | Saturated seconds | Saturation percentage |
|---|---|---|---|
| A | 7148 | 168 | 2.350308% |
| B | 7149 | 152 | 2.126171% |
| C | 7149 | 156 | 2.182123% |
| D | 7149 | 177 | 2.475871% |
Noise dominated data is calculated using 1-second bins in cleaned event files. If a bin has >2000 counts, and if more than 50% of those come from <1% of pixels, then it is considered to be noise-dominated and hence unusable.
| Quadrant | # 1 sec bins | Bins with >0 counts | Bins with >2000 counts | High rate bins dominated by noise | Noise dominated (total time) | Noise dominated (detector-on time) | Marked lightcurve |
|---|---|---|---|---|---|---|---|
| A | 7283 | 7149 | 16 | 16 | 0.22% | 0.22% | 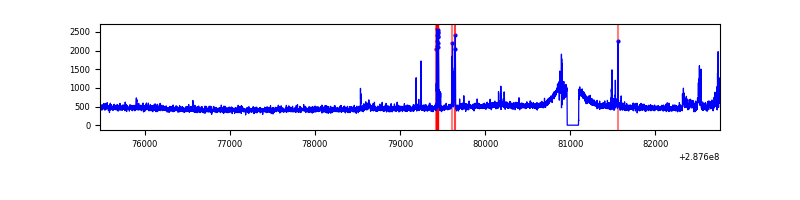 |
| B | 7284 | 7150 | 6 | 6 | 0.08% | 0.08% | 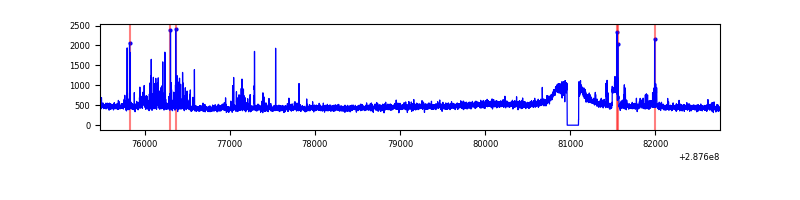 |
| C | 7284 | 7150 | 1 | 1 | 0.01% | 0.01% | 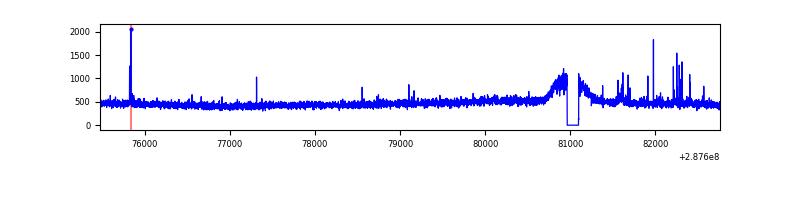 |
| D | 7284 | 7150 | 30 | 30 | 0.41% | 0.42% | 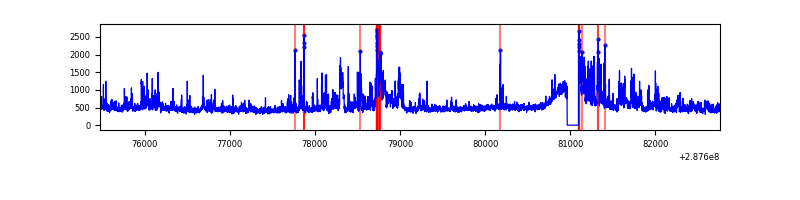 |
Top three noisy pixels from each quadrant. If the there are fewer than three noisy pixels in the level2.evt file, extra rows are filled as -1
| Pixel properties | Quadrant properties | ||||||
|---|---|---|---|---|---|---|---|
| Quadrant | DetID | PixID | Counts | Sigma | Mean | Median | Sigma |
| A | 15 | 174 | 185124 | 1036.09 | 871 | 852 | 177.9 |
| A | 10 | 228 | 18719 | 100.46 | 871 | 852 | 177.9 |
| A | 4 | 2 | 12192 | 63.76 | 871 | 852 | 177.9 |
| B | 7 | 220 | 153270 | 896.26 | 869 | 846 | 170.1 |
| B | 4 | 171 | 48561 | 280.57 | 869 | 846 | 170.1 |
| B | 12 | 111 | 19560 | 110.04 | 869 | 846 | 170.1 |
| C | 14 | 238 | 126650 | 638.74 | 832 | 835 | 197.0 |
| C | 0 | 207 | 45201 | 225.24 | 832 | 835 | 197.0 |
| C | 3 | 233 | 12051 | 56.94 | 832 | 835 | 197.0 |
| D | 7 | 238 | 701786 | 3386.8 | 850 | 824 | 207.0 |
| D | 1 | 52 | 176592 | 849.25 | 850 | 824 | 207.0 |
| D | 14 | 34 | 43835 | 207.81 | 850 | 824 | 207.0 |
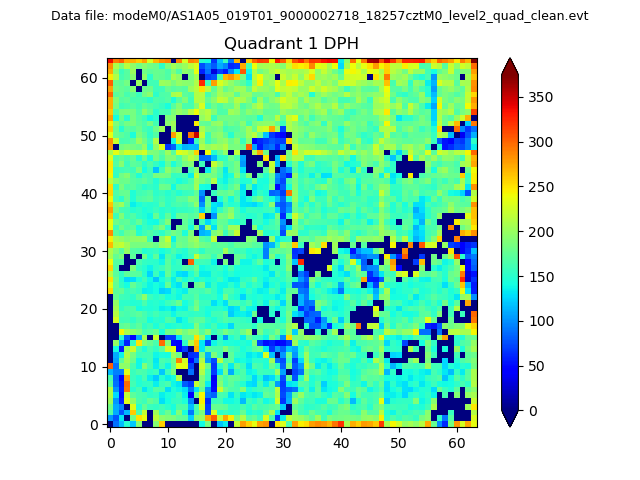
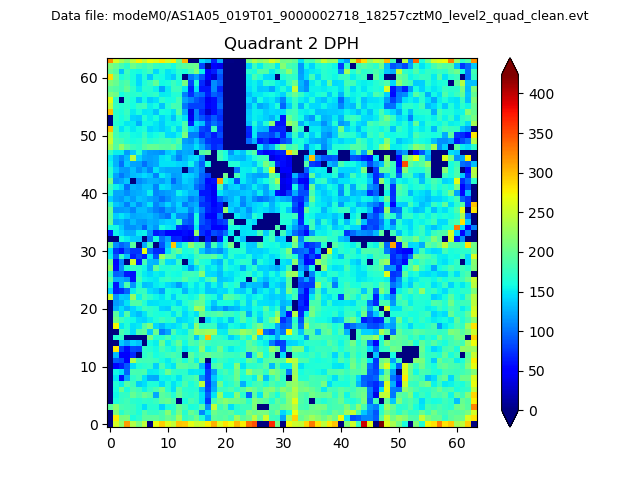
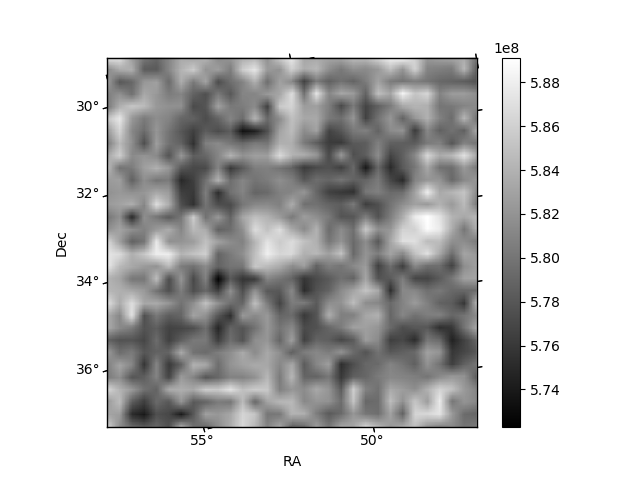
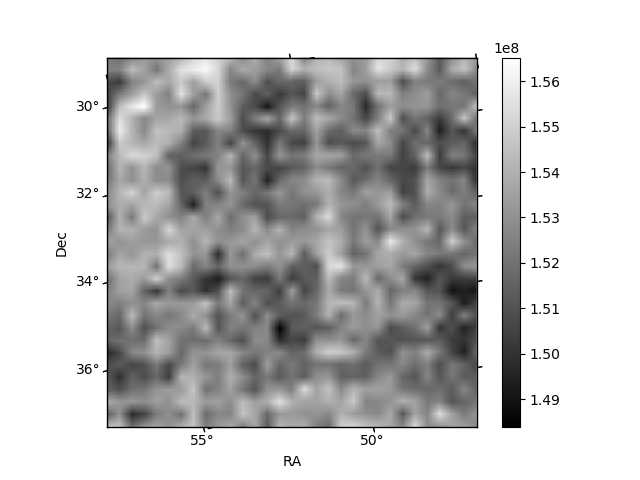
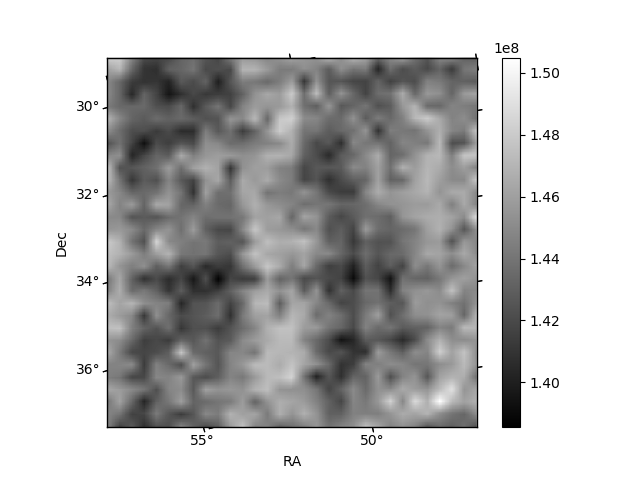
Histogram calculated using DETX and DETY for each event in the final _common_clean file
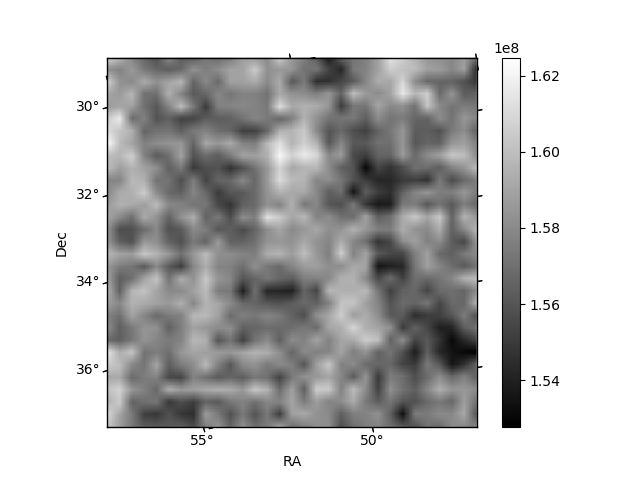
| Quadrant A |  |
 |
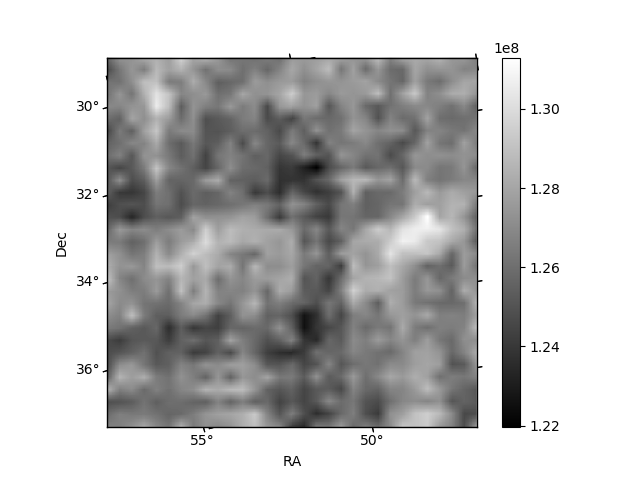
Quadrant B |
|---|---|---|---|
| Quadrant D | 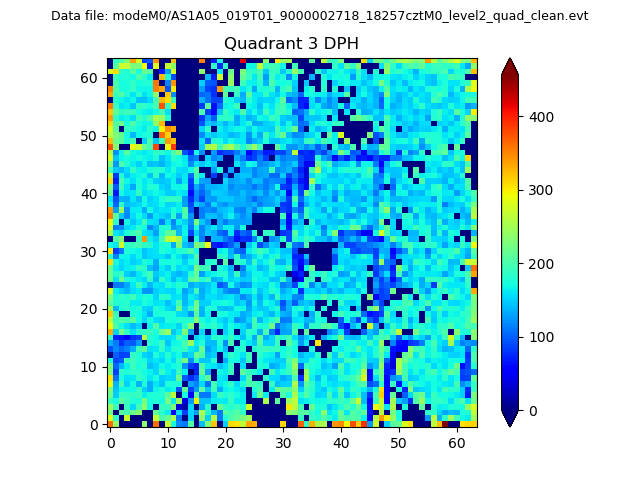 |
 |
Quadrant C |
| Plot type | Count rate plots | Images |
|---|---|---|
| Comparison with Poisson distribution Blue bars denote a histogram of data divided into 1 sec bins. Red curve is a Poisson curve with rate = median count rate of data. |
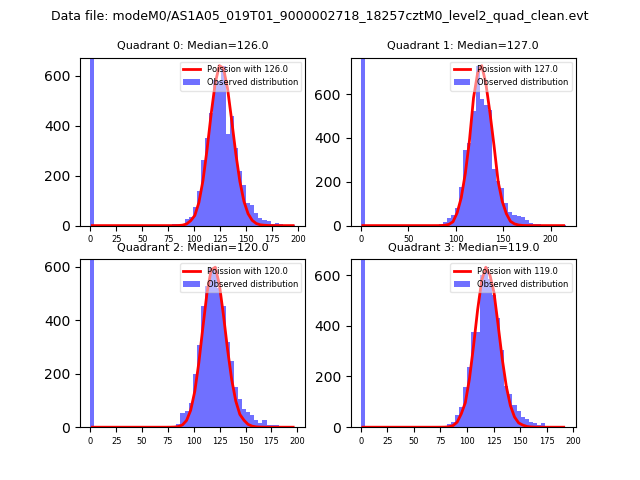 |
 |
| Quadrant-wise count rates Data is divided into 100 sec bins |
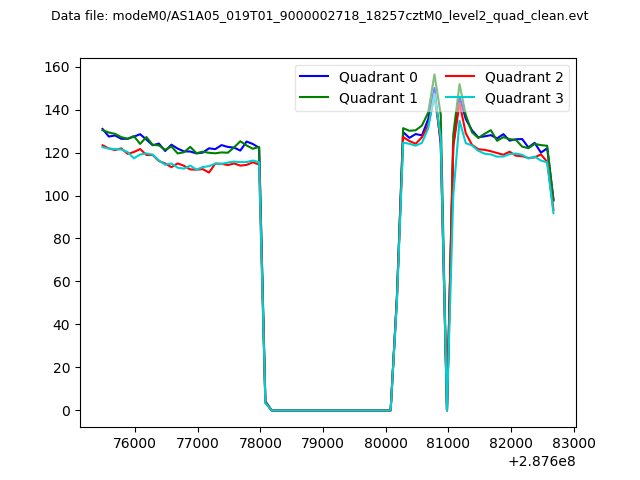 |
|
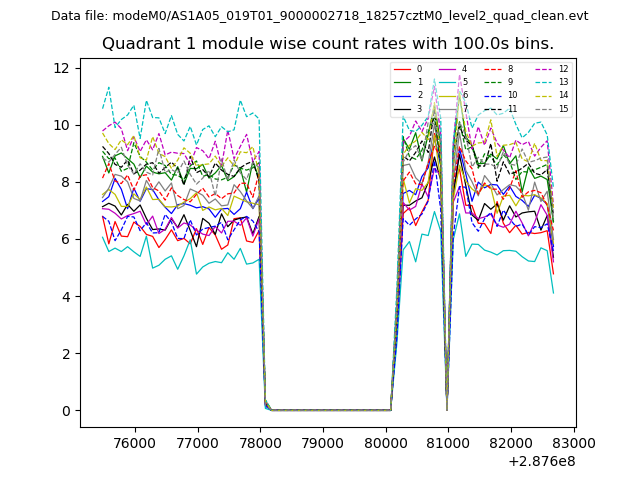
| Module-wise count rates for Quadrant A Data is divided into 100 sec bins |
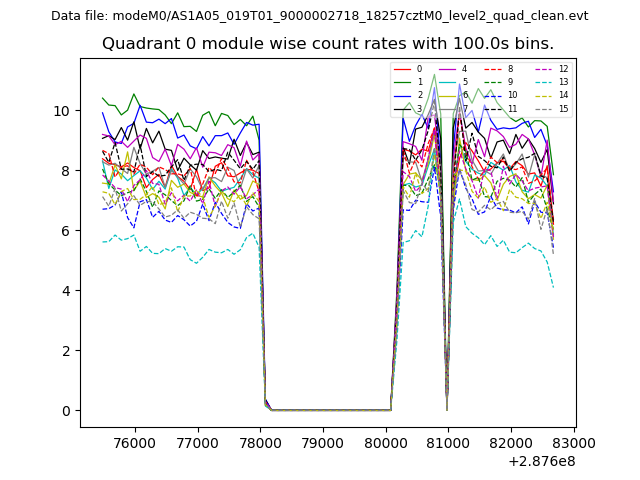 |
 |
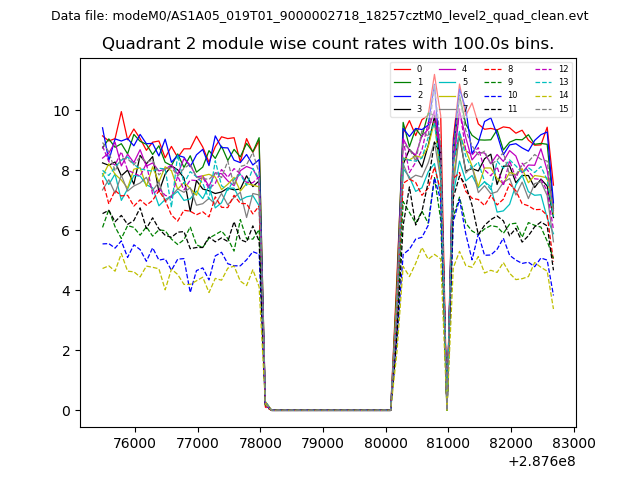
| Module-wise count rates for Quadrant B Data is divided into 100 sec bins |
 |
 |
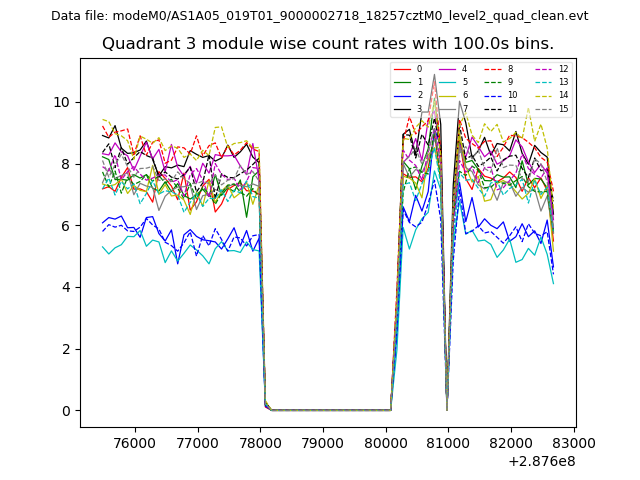
| Module-wise count rates for Quadrant C Data is divided into 100 sec bins |
 |
 |
| Module-wise count rates for Quadrant D Data is divided into 100 sec bins |
 |
 |
| Parameter | Plot |
|---|---|
| CZT HV Monitor | 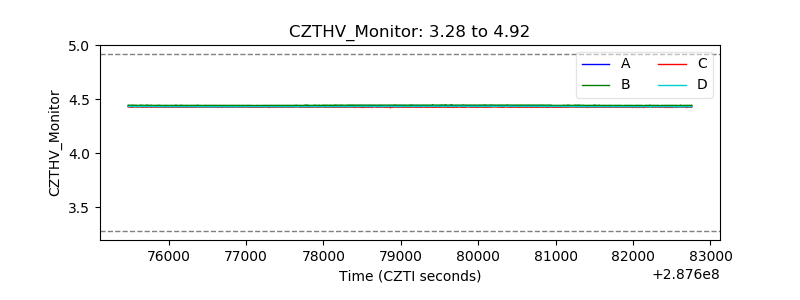 |
| D_VDD | 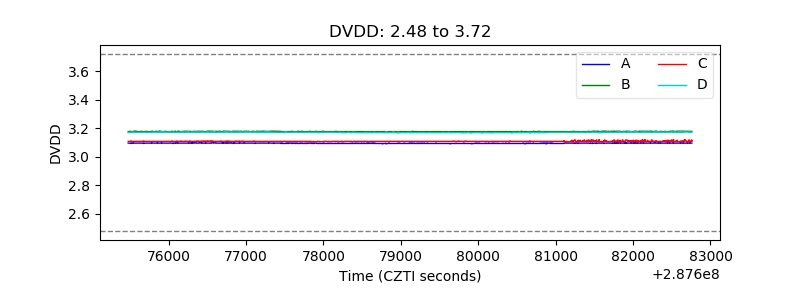 |
| Temperature 1 | 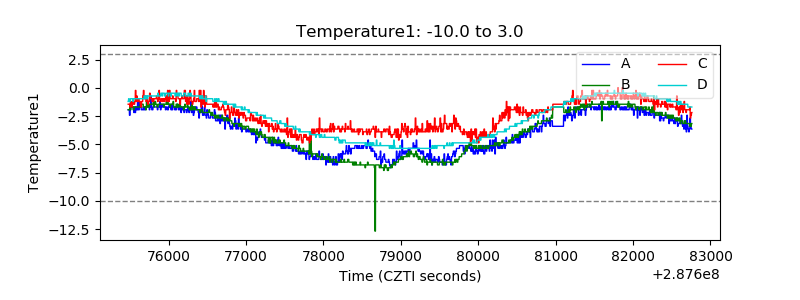 |
| Veto HV Monitor |  |
| Veto LLD | 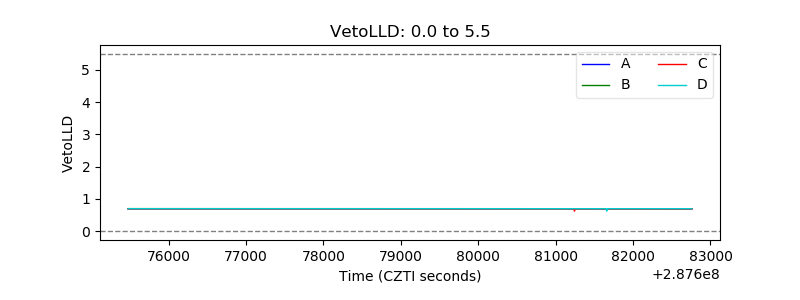 |
| Alpha Counter | 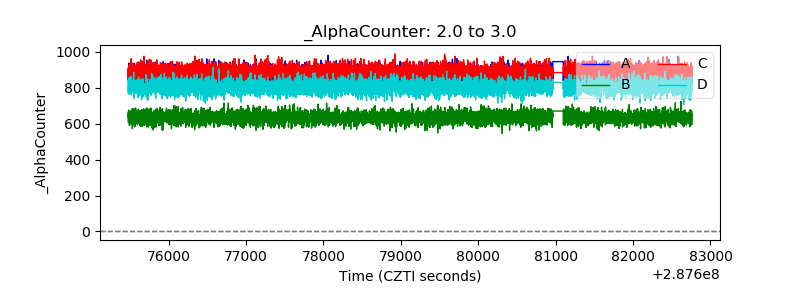 |
| _CPM_Rate | 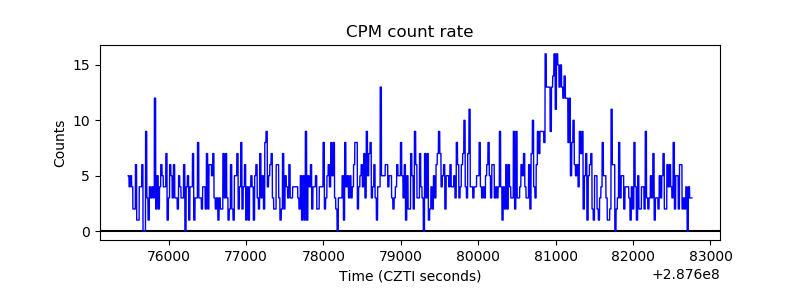 |
| CZT Counter | 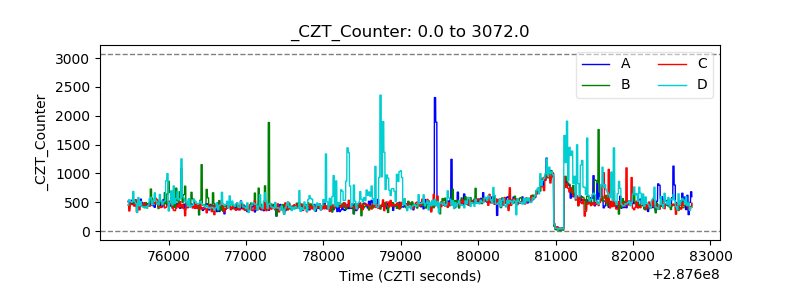 |
| +2.5 Volts monitor |  |
| +5 Volts monitor | 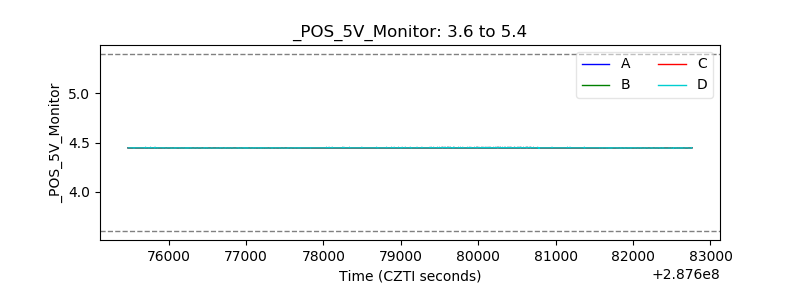 |
| _ROLL_ROT | 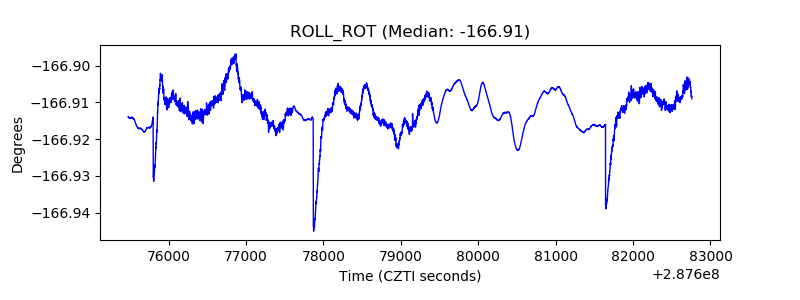 |
| _Roll_DEC | 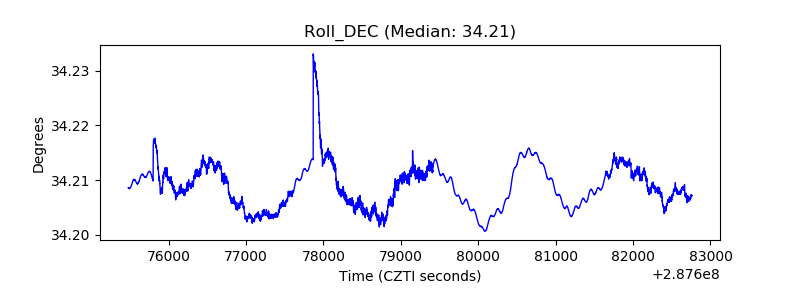 |
| _Roll_RA |  |
| Veto Counter | 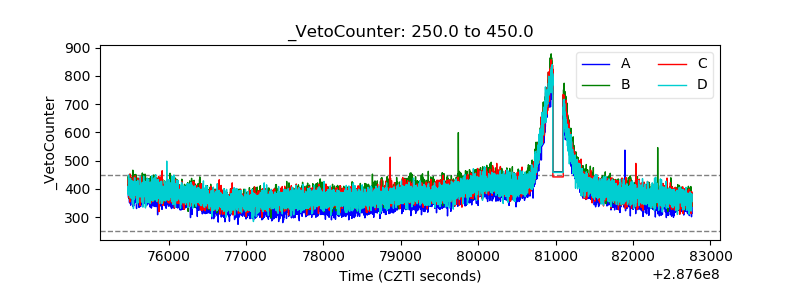 |