| Param | Original file | Final file |
|---|---|---|
| Filename | modeM0/AS1A05_019T01_9000002718_18258cztM0_level2.evt | modeM0/AS1A05_019T01_9000002718_18258cztM0_level2_quad_clean.evt |
| Size (bytes) | 543,245,760 | 100,788,480 |
| Size | 518.1 MB | 96.1 MB |
| Events in quadrant A | 3,757,131 | 655,380 |
| Events in quadrant B | 3,642,265 | 663,250 |
| Events in quadrant C | 3,554,342 | 624,402 |
| Events in quadrant D | 4,997,977 | 595,751 |
| Mode M9 | |||
|---|---|---|---|
| Quadrant | BADHDUFLAG | Total packets | Discarded packets |
| A | 0 | 3 | 0 |
| B | 0 | 3 | 0 |
| C | 0 | 3 | 0 |
| D | 0 | 3 | 0 |
| Mode M0 | |||
|---|---|---|---|
| Quadrant | BADHDUFLAG | Total packets | Discarded packets |
| A | 0 | 15931 | 1 |
| B | 0 | 15659 | 1 |
| C | 0 | 15377 | 1 |
| D | 0 | 19776 | 1 |
| Mode SS | |||
|---|---|---|---|
| Quadrant | BADHDUFLAG | Total packets | Discarded packets |
| A | 0 | 152 | 0 |
| B | 0 | 152 | 0 |
| C | 0 | 152 | 0 |
| D | 0 | 152 | 0 |
| Quadrant | Total seconds | Saturated seconds | Saturation percentage |
|---|---|---|---|
| A | 7367 | 84 | 1.140220% |
| B | 7367 | 68 | 0.923035% |
| C | 7367 | 76 | 1.031628% |
| D | 7367 | 510 | 6.922764% |
Noise dominated data is calculated using 1-second bins in cleaned event files. If a bin has >2000 counts, and if more than 50% of those come from <1% of pixels, then it is considered to be noise-dominated and hence unusable.
| Quadrant | # 1 sec bins | Bins with >0 counts | Bins with >2000 counts | High rate bins dominated by noise | Noise dominated (total time) | Noise dominated (detector-on time) | Marked lightcurve |
|---|---|---|---|---|---|---|---|
| A | 7722 | 7368 | 41 | 41 | 0.53% | 0.56% |  |
| B | 7722 | 7368 | 9 | 9 | 0.12% | 0.12% | 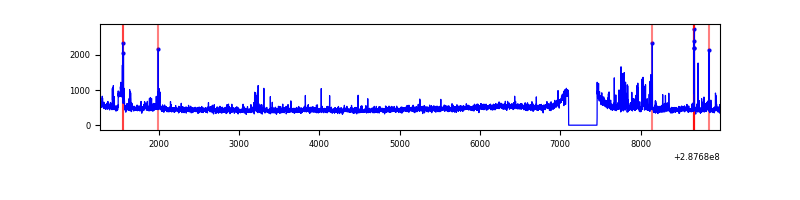 |
| C | 7722 | 7368 | 8 | 8 | 0.10% | 0.11% | 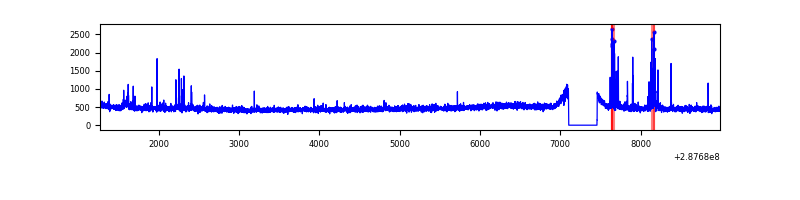 |
| D | 7722 | 7368 | 357 | 357 | 4.62% | 4.85% | 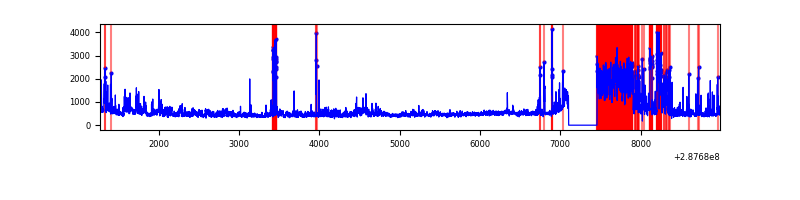 |
Top three noisy pixels from each quadrant. If the there are fewer than three noisy pixels in the level2.evt file, extra rows are filled as -1
| Pixel properties | Quadrant properties | ||||||
|---|---|---|---|---|---|---|---|
| Quadrant | DetID | PixID | Counts | Sigma | Mean | Median | Sigma |
| A | 15 | 174 | 352979 | 1959.89 | 879 | 859 | 179.7 |
| A | 10 | 228 | 21668 | 115.82 | 879 | 859 | 179.7 |
| A | 0 | 226 | 7587 | 37.45 | 879 | 859 | 179.7 |
| B | 7 | 220 | 132485 | 776.36 | 876 | 852 | 169.6 |
| B | 4 | 171 | 49022 | 284.1 | 876 | 852 | 169.6 |
| B | 12 | 111 | 19851 | 112.05 | 876 | 852 | 169.6 |
| C | 14 | 238 | 127851 | 646.07 | 837 | 840 | 196.6 |
| C | 0 | 207 | 124616 | 629.61 | 837 | 840 | 196.6 |
| C | 3 | 233 | 21132 | 103.22 | 837 | 840 | 196.6 |
| D | 7 | 238 | 992296 | 4887.79 | 836 | 811 | 202.8 |
| D | 1 | 52 | 779748 | 3839.98 | 836 | 811 | 202.8 |
| D | 2 | 234 | 32824 | 157.82 | 836 | 811 | 202.8 |
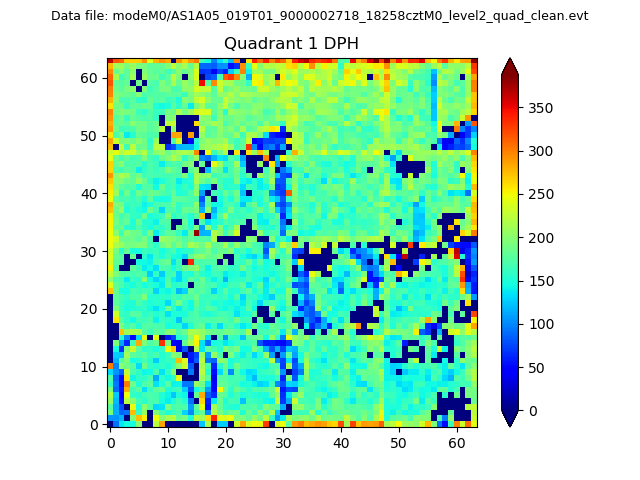
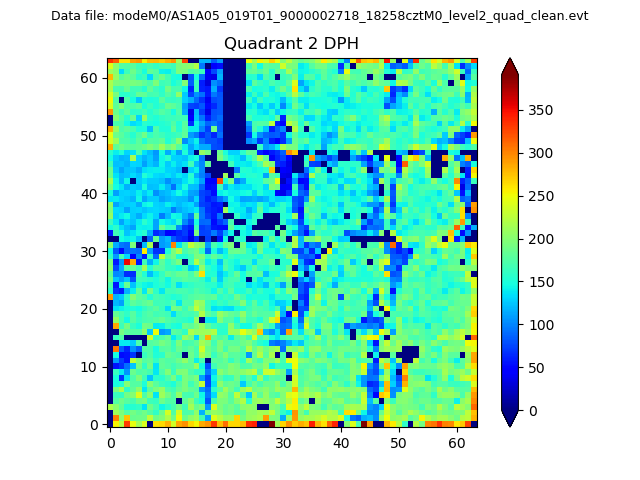
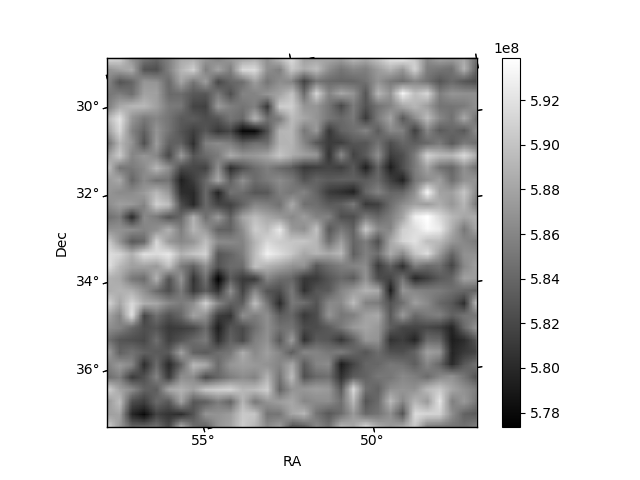
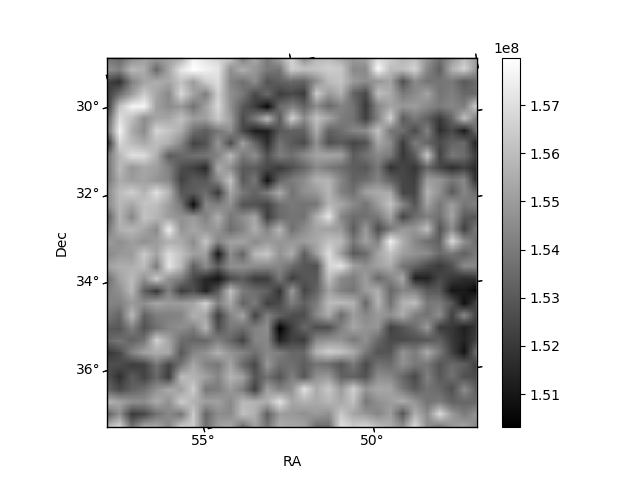
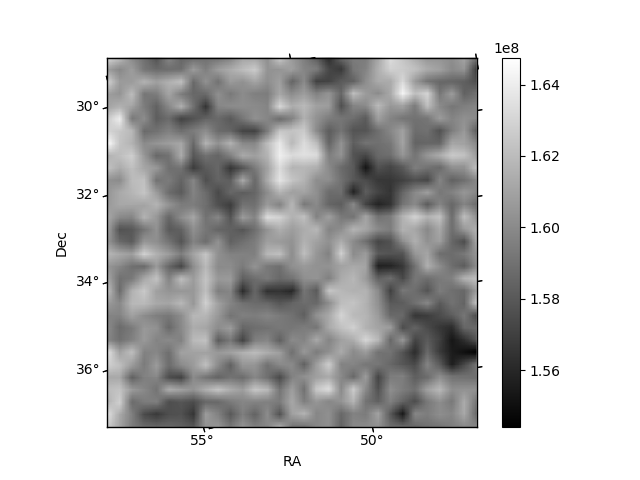
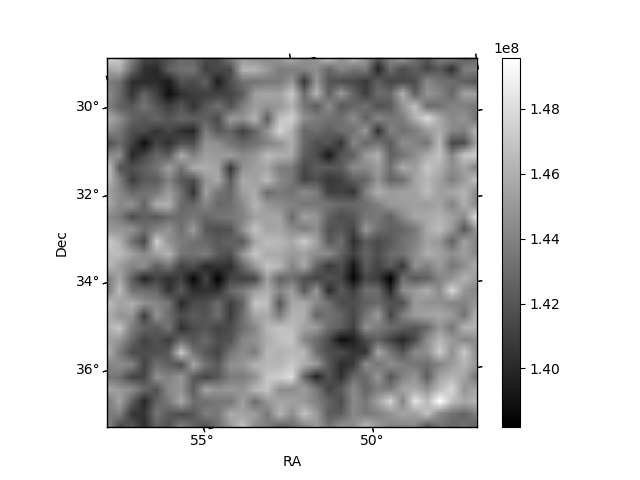
Histogram calculated using DETX and DETY for each event in the final _common_clean file
| Quadrant A | 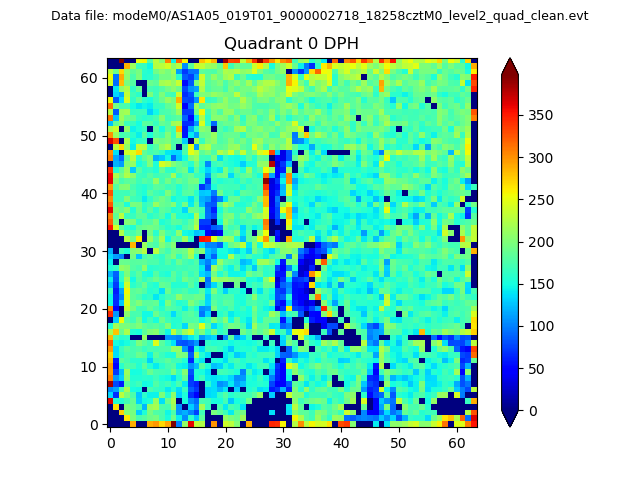 |
 |
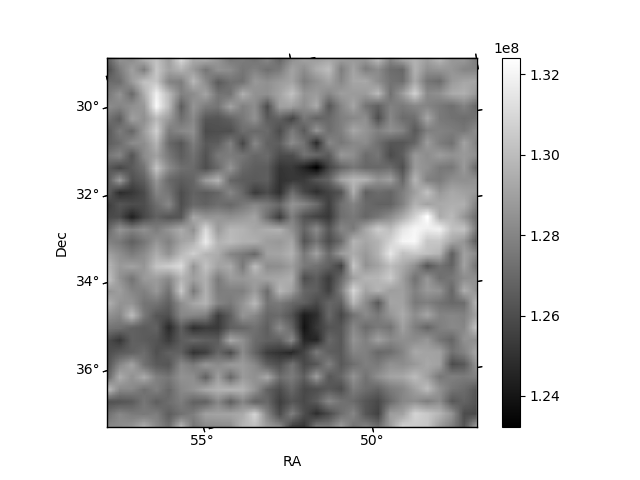
Quadrant B |
|---|---|---|---|
| Quadrant D | 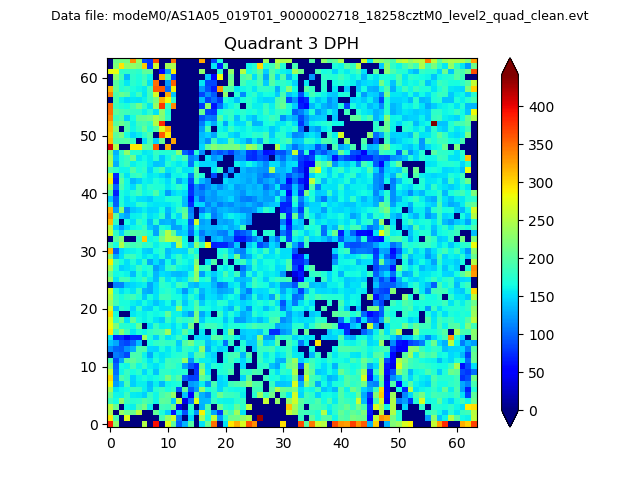 |
 |
Quadrant C |
| Plot type | Count rate plots | Images |
|---|---|---|
| Comparison with Poisson distribution Blue bars denote a histogram of data divided into 1 sec bins. Red curve is a Poisson curve with rate = median count rate of data. |
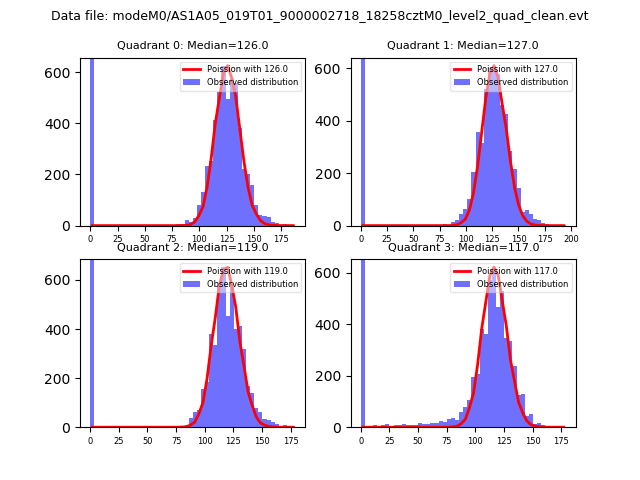 |
 |
| Quadrant-wise count rates Data is divided into 100 sec bins |
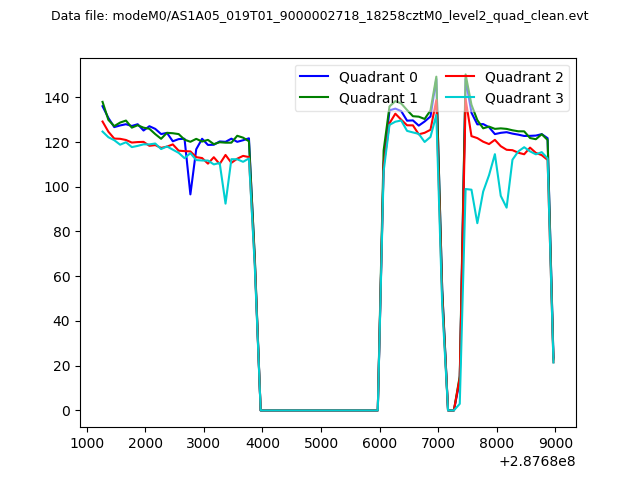 |
|
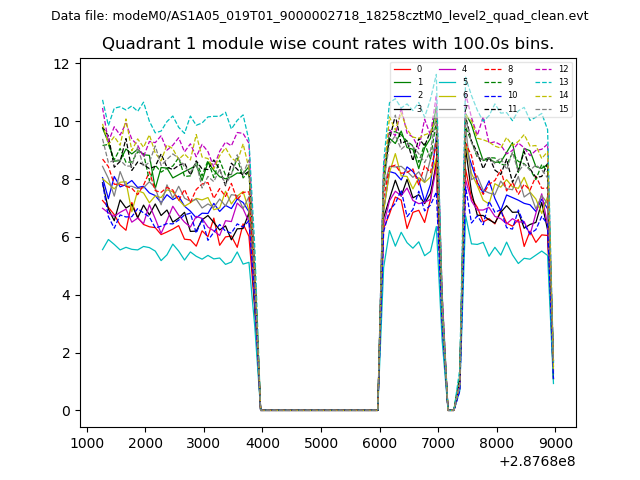
| Module-wise count rates for Quadrant A Data is divided into 100 sec bins |
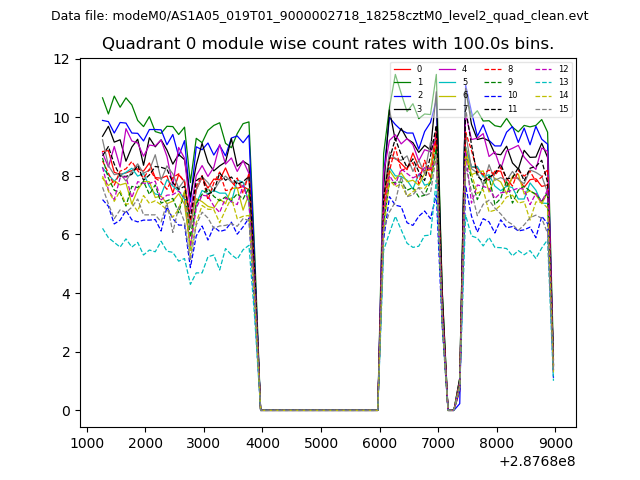 |
 |
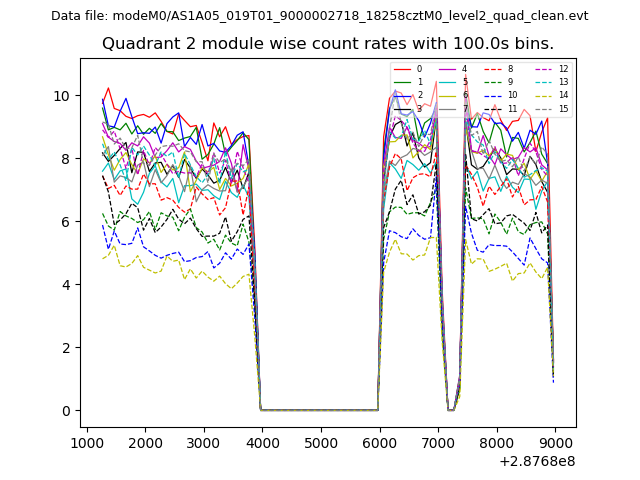
| Module-wise count rates for Quadrant B Data is divided into 100 sec bins |
 |
 |
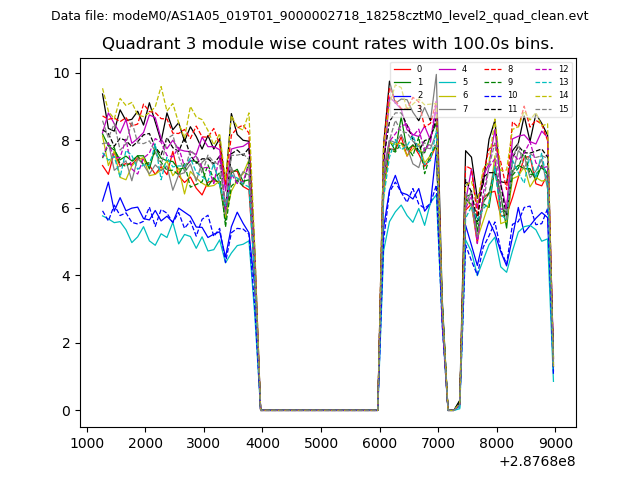
| Module-wise count rates for Quadrant C Data is divided into 100 sec bins |
 |
 |
| Module-wise count rates for Quadrant D Data is divided into 100 sec bins |
 |
 |
| Parameter | Plot |
|---|---|
| CZT HV Monitor | 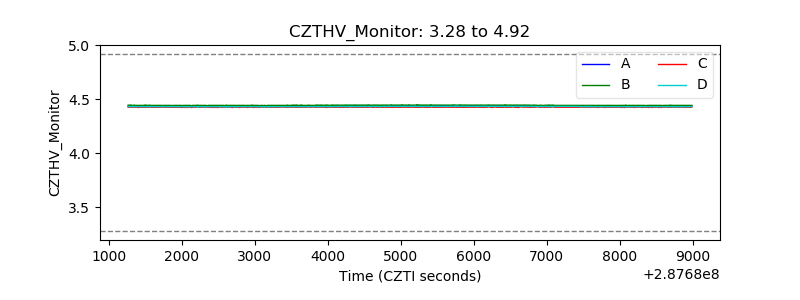 |
| D_VDD | 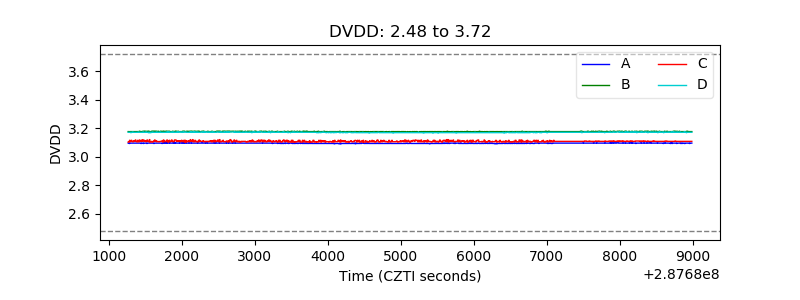 |
| Temperature 1 | 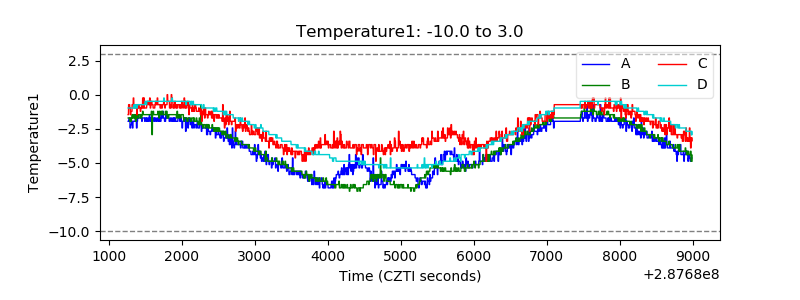 |
| Veto HV Monitor | 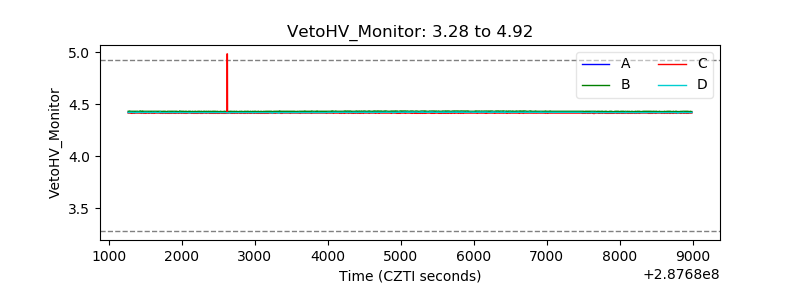 |
| Veto LLD | 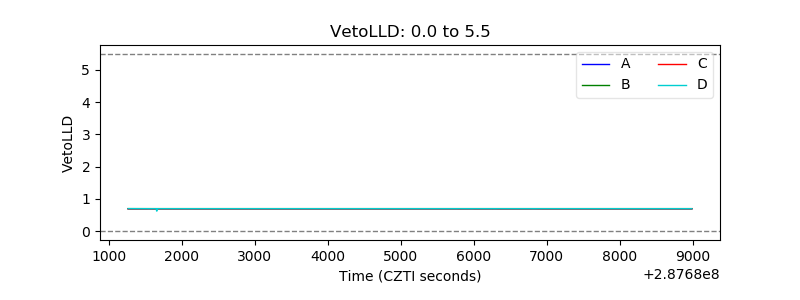 |
| Alpha Counter | 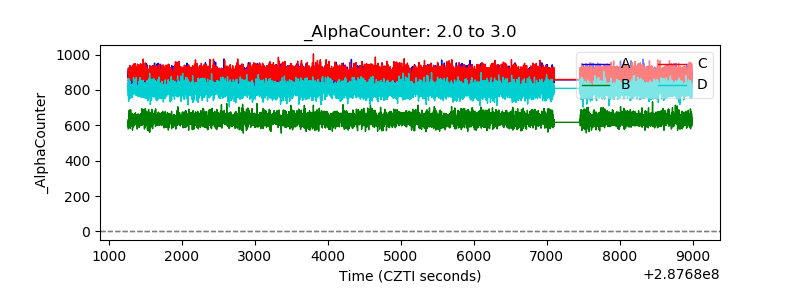 |
| _CPM_Rate | 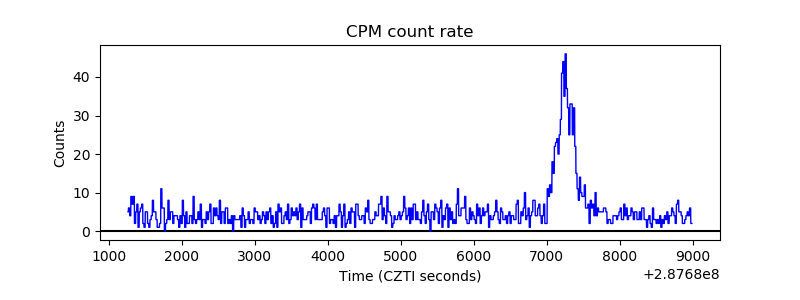 |
| CZT Counter | 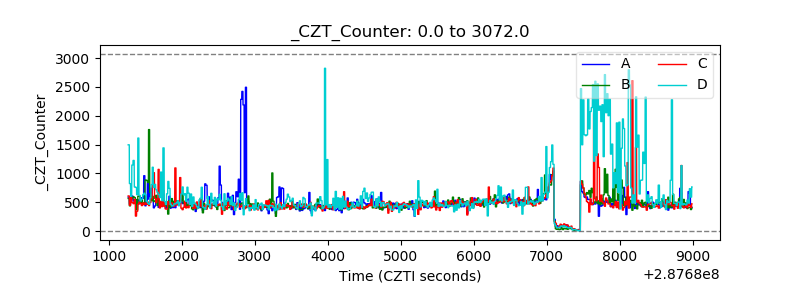 |
| +2.5 Volts monitor |  |
| +5 Volts monitor |  |
| _ROLL_ROT | 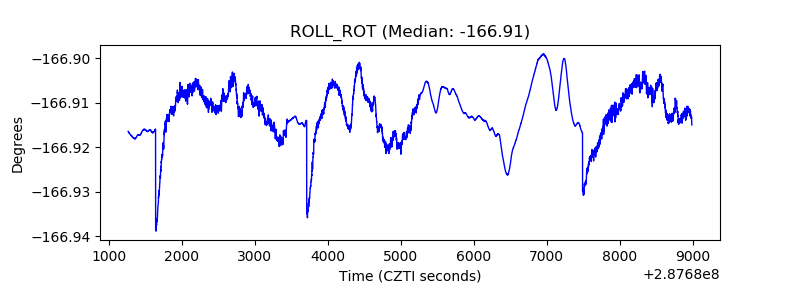 |
| _Roll_DEC | 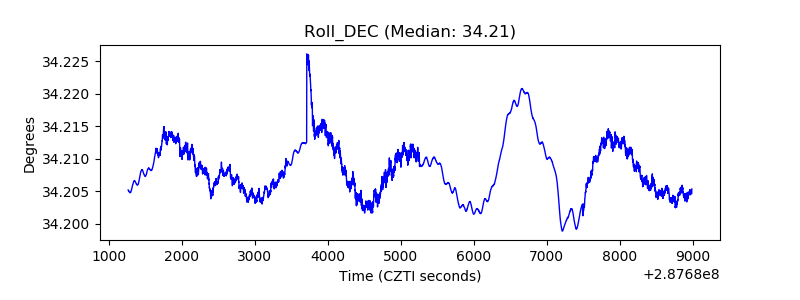 |
| _Roll_RA | 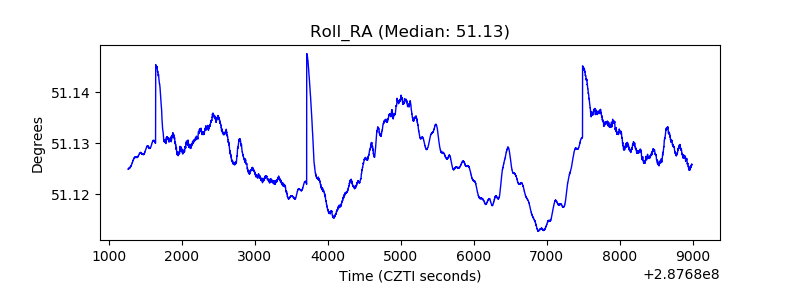 |
| Veto Counter | 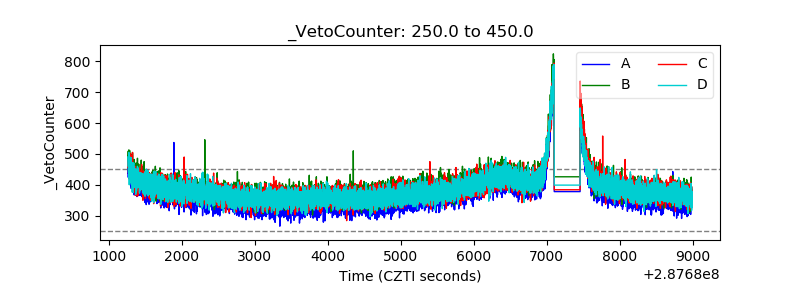 |