| Param | Original file | Final file |
|---|---|---|
| Filename | modeM0/AS1A05_019T01_9000002718_18260cztM0_level2.evt | modeM0/AS1A05_019T01_9000002718_18260cztM0_level2_quad_clean.evt |
| Size (bytes) | 942,955,200 | 168,814,080 |
| Size | 899.3 MB | 161.0 MB |
| Events in quadrant A | 7,028,578 | 1,082,041 |
| Events in quadrant B | 6,320,558 | 1,097,994 |
| Events in quadrant C | 6,153,197 | 1,034,996 |
| Events in quadrant D | 8,174,443 | 998,209 |
| Mode M9 | |||
|---|---|---|---|
| Quadrant | BADHDUFLAG | Total packets | Discarded packets |
| A | 0 | 15 | 0 |
| B | 0 | 15 | 0 |
| C | 0 | 15 | 0 |
| D | 0 | 15 | 0 |
| Mode M0 | |||
|---|---|---|---|
| Quadrant | BADHDUFLAG | Total packets | Discarded packets |
| A | 0 | 29635 | 3 |
| B | 0 | 27324 | 3 |
| C | 0 | 26809 | 3 |
| D | 0 | 33126 | 3 |
| Mode SS | |||
|---|---|---|---|
| Quadrant | BADHDUFLAG | Total packets | Discarded packets |
| A | 0 | 268 | 0 |
| B | 0 | 268 | 0 |
| C | 0 | 268 | 0 |
| D | 0 | 268 | 0 |
| Quadrant | Total seconds | Saturated seconds | Saturation percentage |
|---|---|---|---|
| A | 13006 | 249 | 1.914501% |
| B | 13007 | 107 | 0.822634% |
| C | 13007 | 124 | 0.953333% |
| D | 13007 | 702 | 5.397094% |
Noise dominated data is calculated using 1-second bins in cleaned event files. If a bin has >2000 counts, and if more than 50% of those come from <1% of pixels, then it is considered to be noise-dominated and hence unusable.
| Quadrant | # 1 sec bins | Bins with >0 counts | Bins with >2000 counts | High rate bins dominated by noise | Noise dominated (total time) | Noise dominated (detector-on time) | Marked lightcurve |
|---|---|---|---|---|---|---|---|
| A | 14621 | 13009 | 139 | 139 | 0.95% | 1.07% | 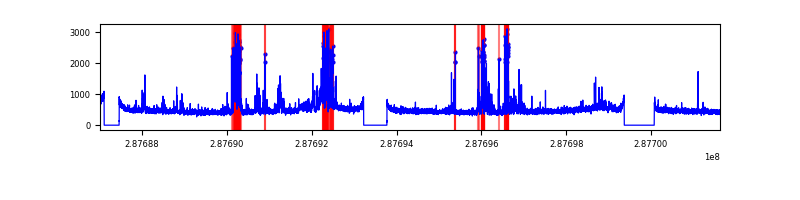 |
| B | 14622 | 13010 | 13 | 13 | 0.09% | 0.10% | 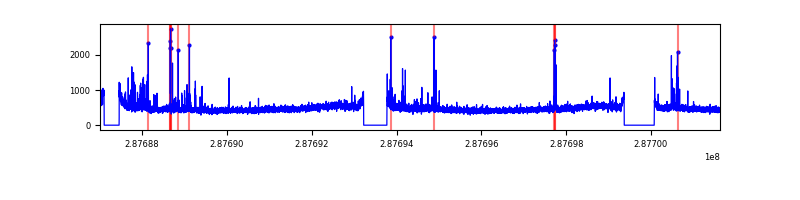 |
| C | 14622 | 13010 | 8 | 8 | 0.05% | 0.06% | 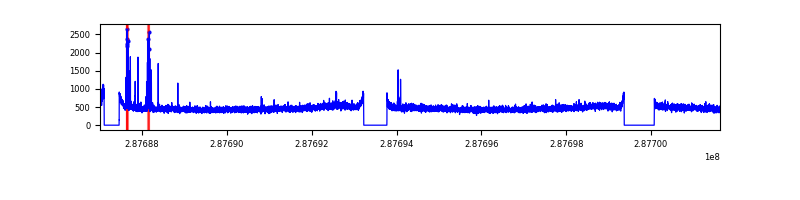 |
| D | 14622 | 13010 | 496 | 496 | 3.39% | 3.81% | 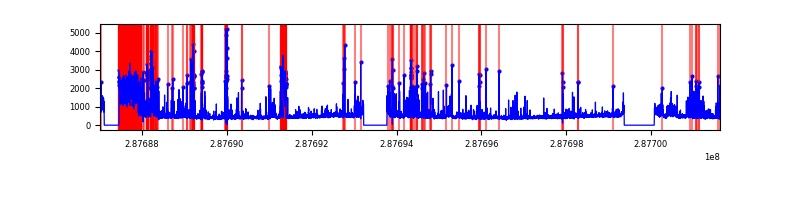 |
Top three noisy pixels from each quadrant. If the there are fewer than three noisy pixels in the level2.evt file, extra rows are filled as -1
| Pixel properties | Quadrant properties | ||||||
|---|---|---|---|---|---|---|---|
| Quadrant | DetID | PixID | Counts | Sigma | Mean | Median | Sigma |
| A | 15 | 174 | 1062394 | 3407.75 | 1540 | 1505 | 311.3 |
| A | 4 | 2 | 44339 | 137.59 | 1540 | 1505 | 311.3 |
| A | 0 | 226 | 13252 | 37.73 | 1540 | 1505 | 311.3 |
| B | 7 | 220 | 152530 | 502.25 | 1549 | 1505 | 300.7 |
| B | 0 | 197 | 39193 | 125.34 | 1549 | 1505 | 300.7 |
| B | 12 | 111 | 35893 | 114.36 | 1549 | 1505 | 300.7 |
| C | 14 | 238 | 230668 | 660.14 | 1483 | 1490 | 347.2 |
| C | 0 | 207 | 103673 | 294.34 | 1483 | 1490 | 347.2 |
| C | 3 | 233 | 33544 | 92.33 | 1483 | 1490 | 347.2 |
| D | 1 | 52 | 1730406 | 4789.15 | 1480 | 1436 | 361.0 |
| D | 7 | 238 | 724155 | 2001.89 | 1480 | 1436 | 361.0 |
| D | 2 | 234 | 53948 | 145.45 | 1480 | 1436 | 361.0 |
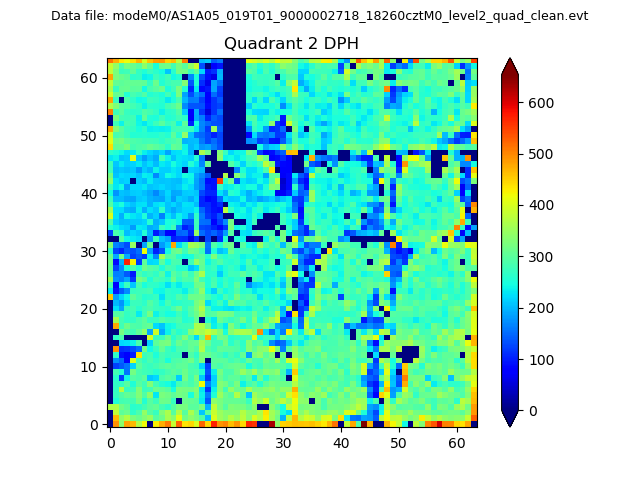
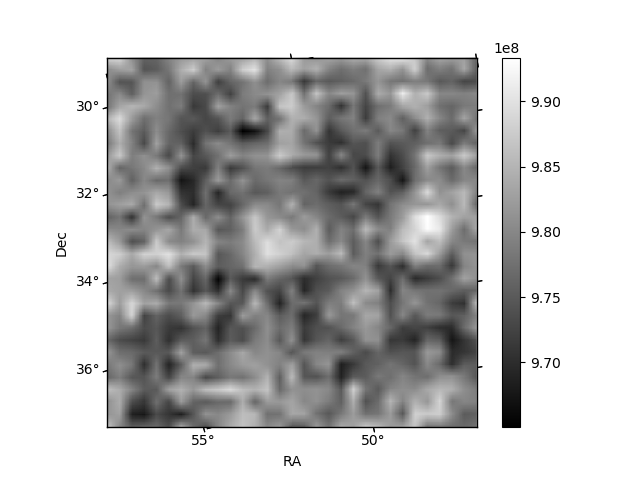
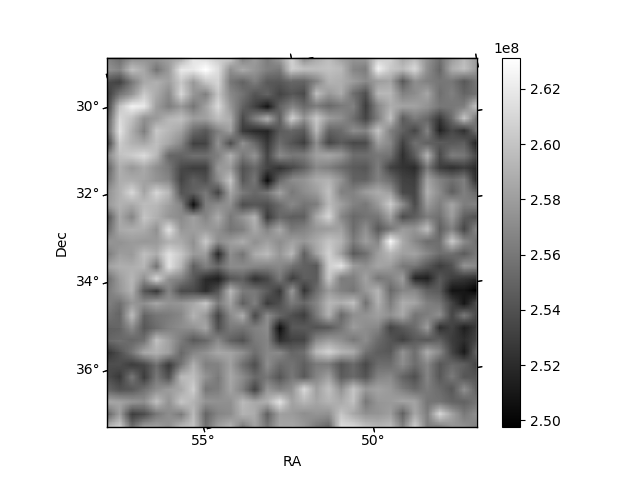
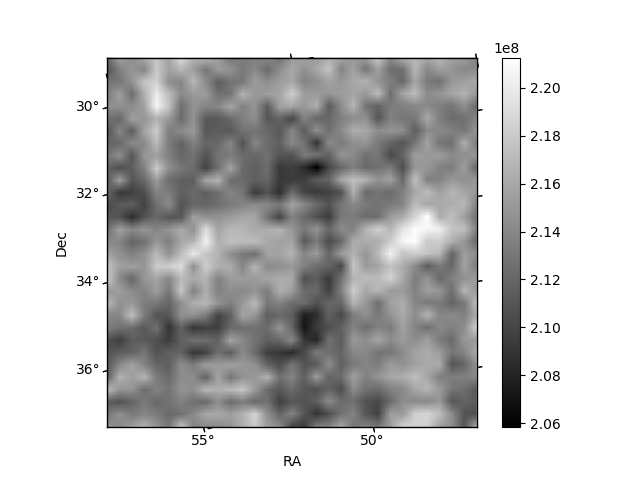
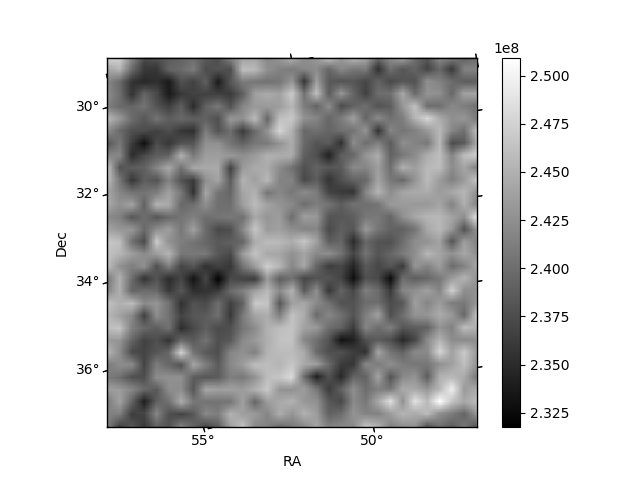
Histogram calculated using DETX and DETY for each event in the final _common_clean file
| Quadrant A | 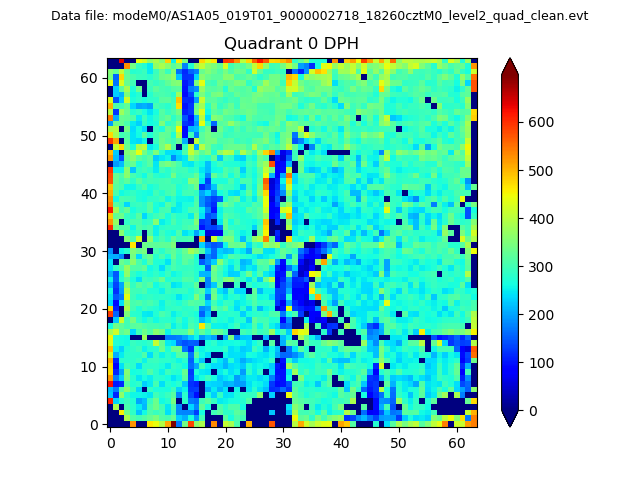 |
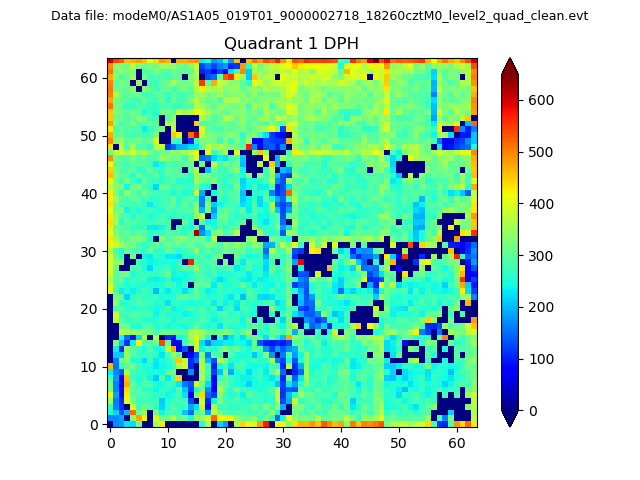 |
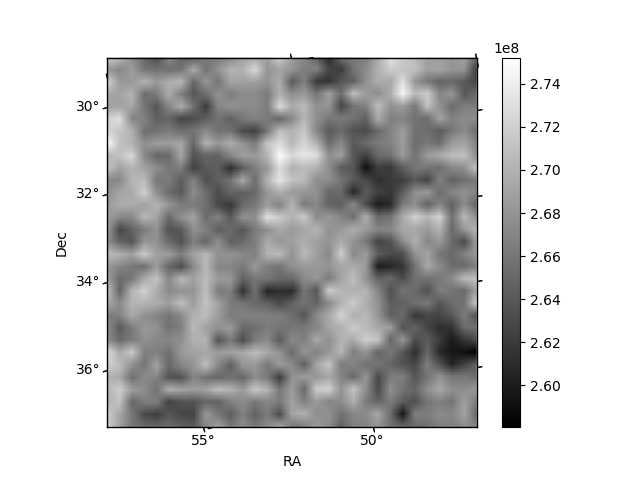
Quadrant B |
|---|---|---|---|
| Quadrant D | 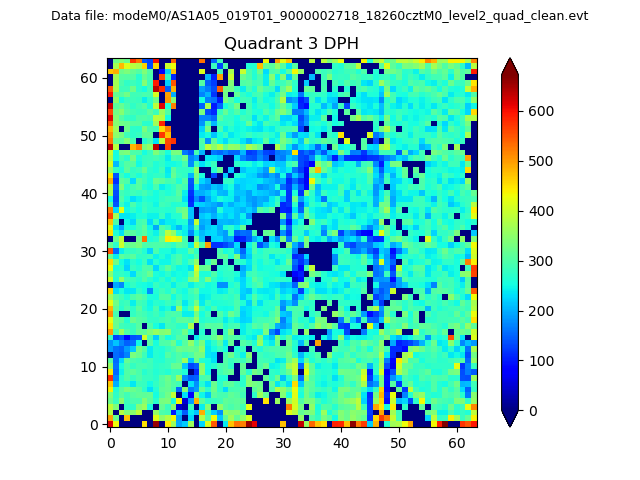 |
 |
Quadrant C |
| Plot type | Count rate plots | Images |
|---|---|---|
| Comparison with Poisson distribution Blue bars denote a histogram of data divided into 1 sec bins. Red curve is a Poisson curve with rate = median count rate of data. |
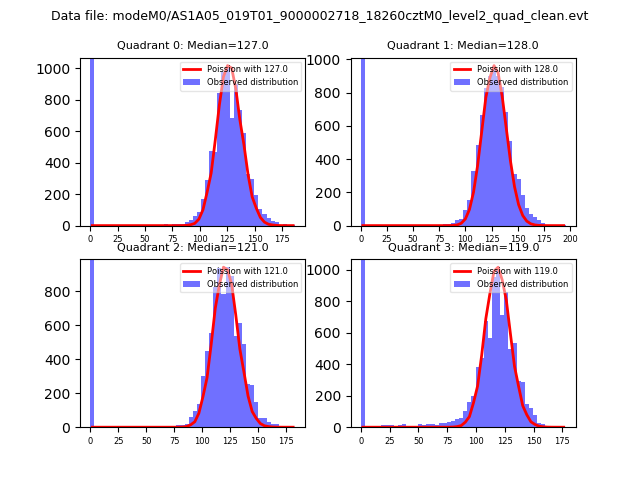 |
 |
| Quadrant-wise count rates Data is divided into 100 sec bins |
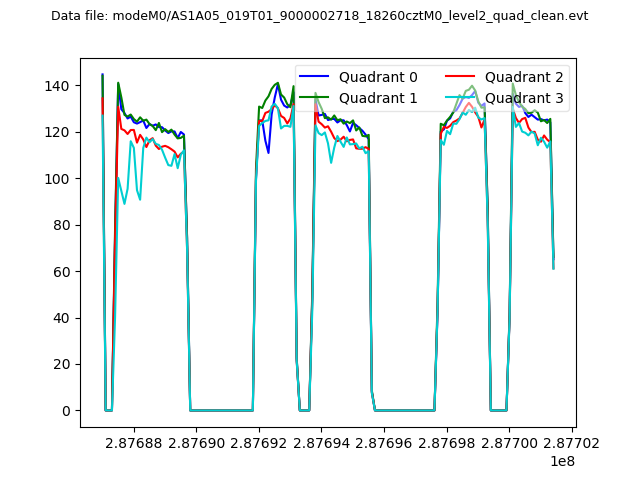 |
|
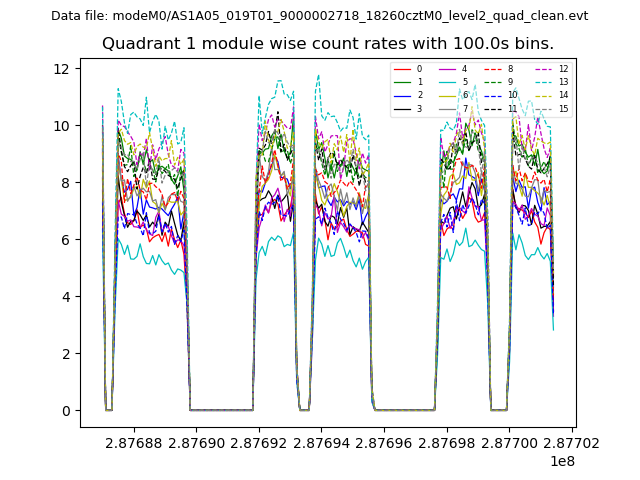
| Module-wise count rates for Quadrant A Data is divided into 100 sec bins |
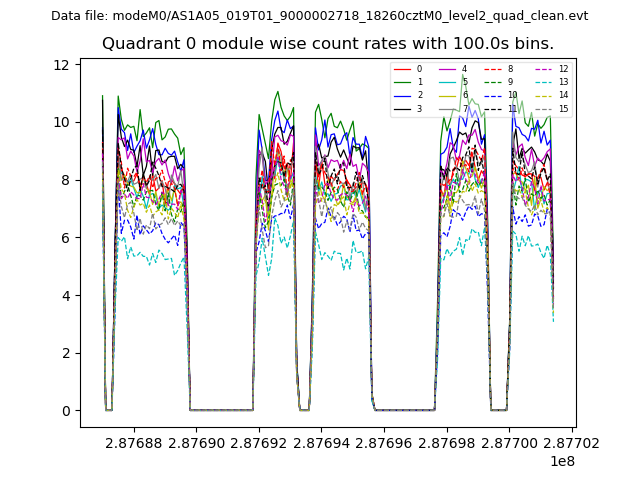 |
 |
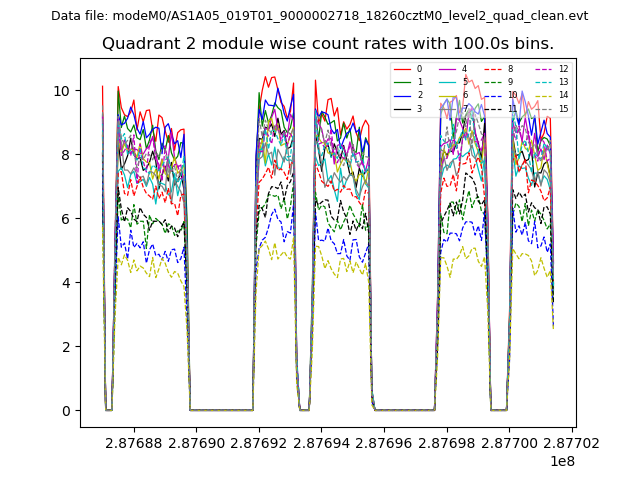
| Module-wise count rates for Quadrant B Data is divided into 100 sec bins |
 |
 |
| Module-wise count rates for Quadrant C Data is divided into 100 sec bins |
 |
 |
| Module-wise count rates for Quadrant D Data is divided into 100 sec bins |
 |
 |
| Parameter | Plot |
|---|---|
| CZT HV Monitor | 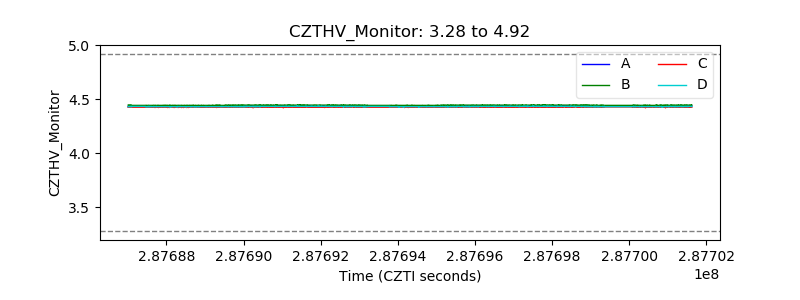 |
| D_VDD | 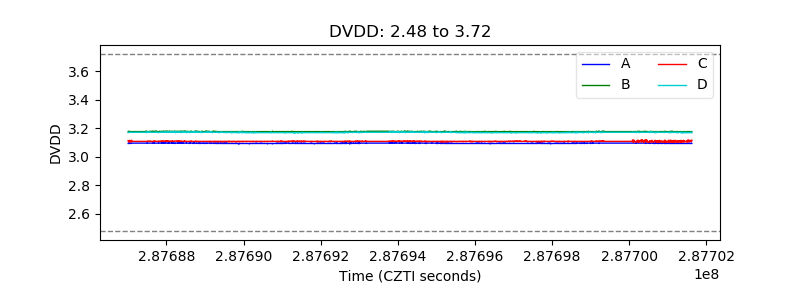 |
| Temperature 1 | 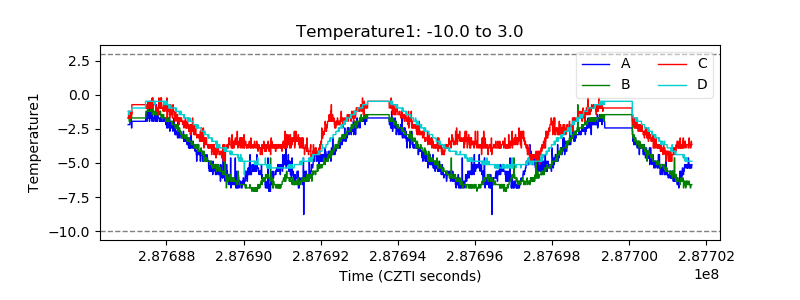 |
| Veto HV Monitor | 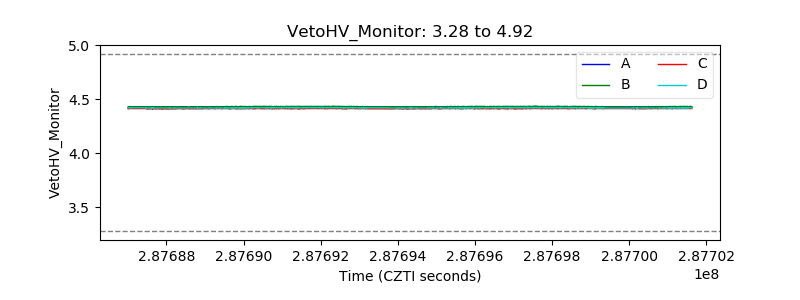 |
| Veto LLD | 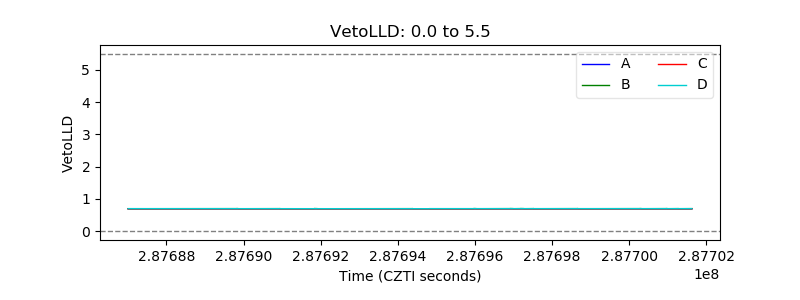 |
| Alpha Counter | 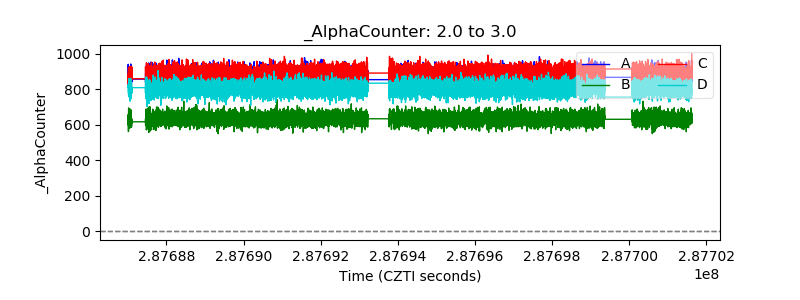 |
| _CPM_Rate | 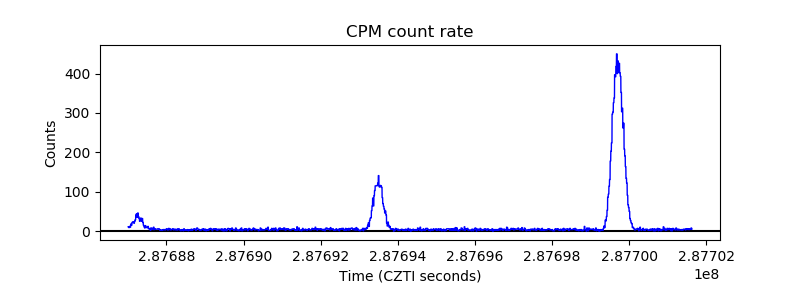 |
| CZT Counter | 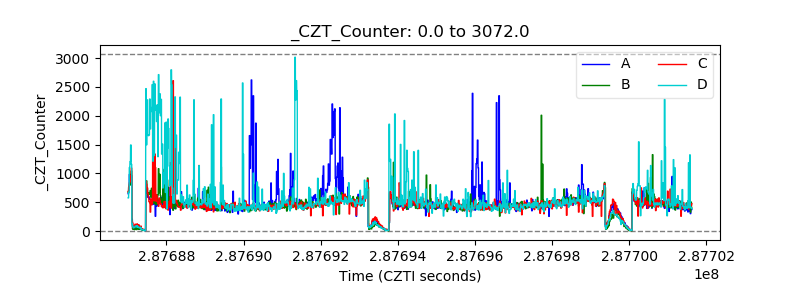 |
| +2.5 Volts monitor |  |
| +5 Volts monitor | 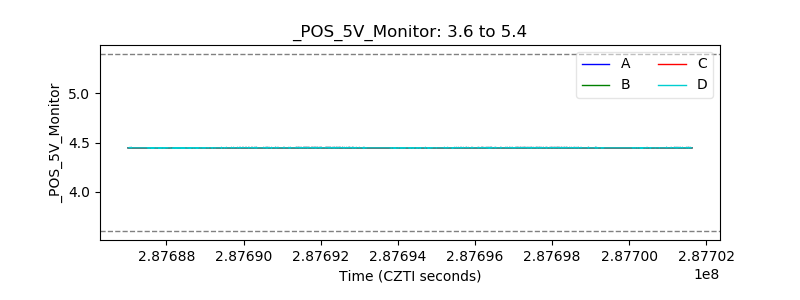 |
| _ROLL_ROT | 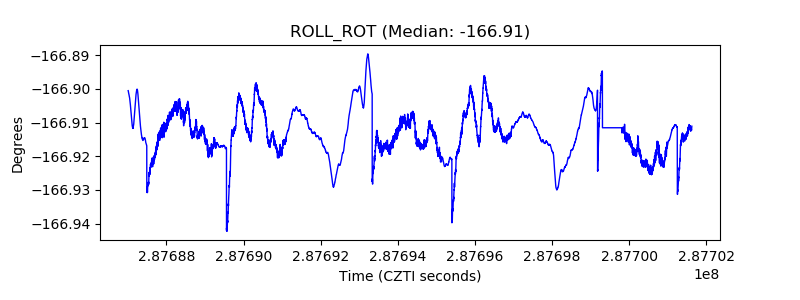 |
| _Roll_DEC |  |
| _Roll_RA | 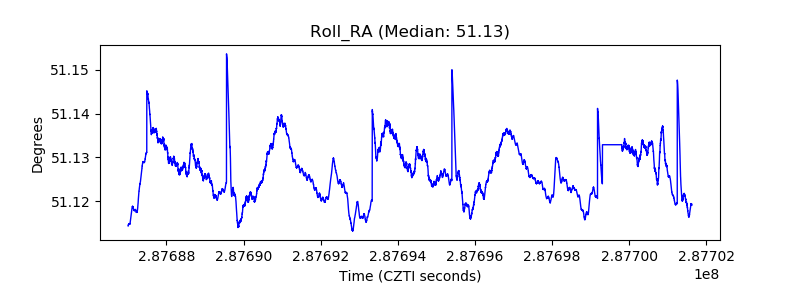 |
| Veto Counter | 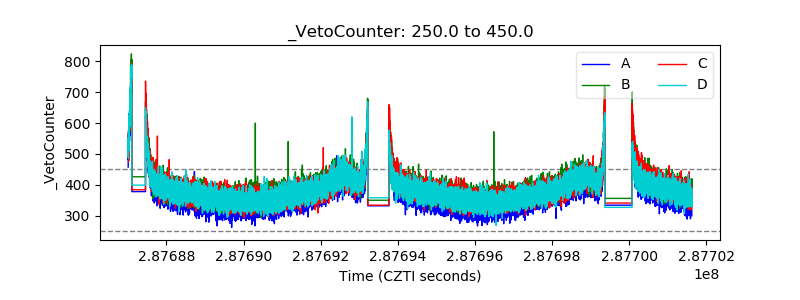 |