| Param | Original file | Final file |
|---|---|---|
| Filename | modeM0/AS1A05_019T01_9000002718_18261cztM0_level2.evt | modeM0/AS1A05_019T01_9000002718_18261cztM0_level2_quad_clean.evt |
| Size (bytes) | 453,585,600 | 86,414,400 |
| Size | 432.6 MB | 82.4 MB |
| Events in quadrant A | 3,234,208 | 545,101 |
| Events in quadrant B | 3,335,803 | 551,163 |
| Events in quadrant C | 3,262,682 | 519,904 |
| Events in quadrant D | 3,430,518 | 515,225 |
| Mode M9 | |||
|---|---|---|---|
| Quadrant | BADHDUFLAG | Total packets | Discarded packets |
| A | 0 | 14 | 0 |
| B | 0 | 15 | 0 |
| C | 0 | 15 | 0 |
| D | 0 | 15 | 0 |
| Mode M0 | |||
|---|---|---|---|
| Quadrant | BADHDUFLAG | Total packets | Discarded packets |
| A | 0 | 14234 | 2 |
| B | 0 | 14405 | 2 |
| C | 0 | 14131 | 2 |
| D | 0 | 15078 | 2 |
| Mode SS | |||
|---|---|---|---|
| Quadrant | BADHDUFLAG | Total packets | Discarded packets |
| A | 0 | 142 | 0 |
| B | 0 | 142 | 0 |
| C | 0 | 142 | 0 |
| D | 0 | 142 | 0 |
| Quadrant | Total seconds | Saturated seconds | Saturation percentage |
|---|---|---|---|
| A | 6967 | 19 | 0.272714% |
| B | 6967 | 32 | 0.459308% |
| C | 6967 | 43 | 0.617195% |
| D | 6967 | 38 | 0.545428% |
Noise dominated data is calculated using 1-second bins in cleaned event files. If a bin has >2000 counts, and if more than 50% of those come from <1% of pixels, then it is considered to be noise-dominated and hence unusable.
| Quadrant | # 1 sec bins | Bins with >0 counts | Bins with >2000 counts | High rate bins dominated by noise | Noise dominated (total time) | Noise dominated (detector-on time) | Marked lightcurve |
|---|---|---|---|---|---|---|---|
| A | 7867 | 6968 | 2 | 2 | 0.03% | 0.03% | 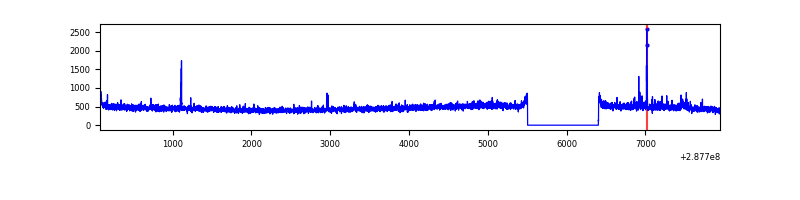 |
| B | 7867 | 6968 | 1 | 1 | 0.01% | 0.01% | 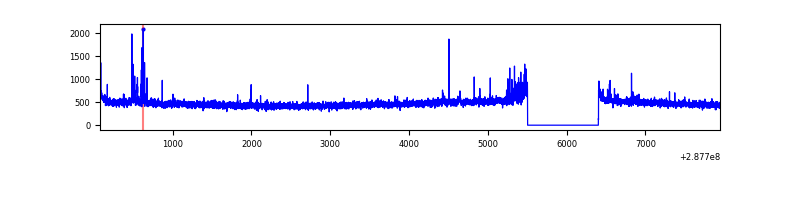 |
| C | 7867 | 6968 | 0 | 0 | 0.00% | 0.00% | 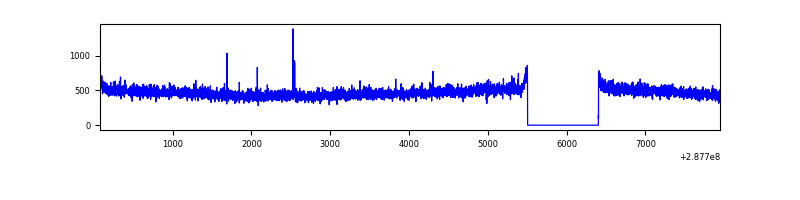 |
| D | 7867 | 6968 | 28 | 28 | 0.36% | 0.40% | 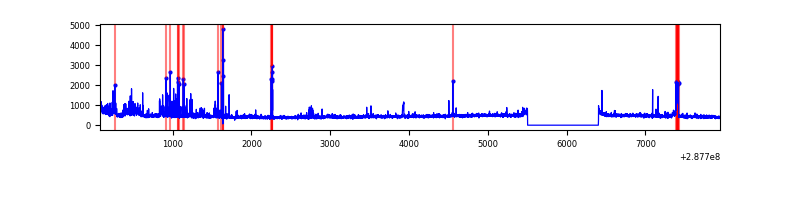 |
Top three noisy pixels from each quadrant. If the there are fewer than three noisy pixels in the level2.evt file, extra rows are filled as -1
| Pixel properties | Quadrant properties | ||||||
|---|---|---|---|---|---|---|---|
| Quadrant | DetID | PixID | Counts | Sigma | Mean | Median | Sigma |
| A | 4 | 2 | 36720 | 215.2 | 827 | 807 | 166.9 |
| A | 15 | 174 | 16860 | 96.19 | 827 | 807 | 166.9 |
| A | 0 | 226 | 7160 | 38.07 | 827 | 807 | 166.9 |
| B | 7 | 220 | 42849 | 262.17 | 829 | 809 | 160.4 |
| B | 0 | 197 | 24227 | 146.04 | 829 | 809 | 160.4 |
| B | 0 | 189 | 19374 | 115.78 | 829 | 809 | 160.4 |
| C | 14 | 238 | 122216 | 646.89 | 795 | 801 | 187.7 |
| C | 3 | 233 | 13263 | 66.4 | 795 | 801 | 187.7 |
| C | 8 | 128 | 12344 | 61.5 | 795 | 801 | 187.7 |
| D | 1 | 52 | 267514 | 1358.79 | 804 | 778 | 196.3 |
| D | 2 | 152 | 62053 | 312.14 | 804 | 778 | 196.3 |
| D | 7 | 96 | 30137 | 149.56 | 804 | 778 | 196.3 |
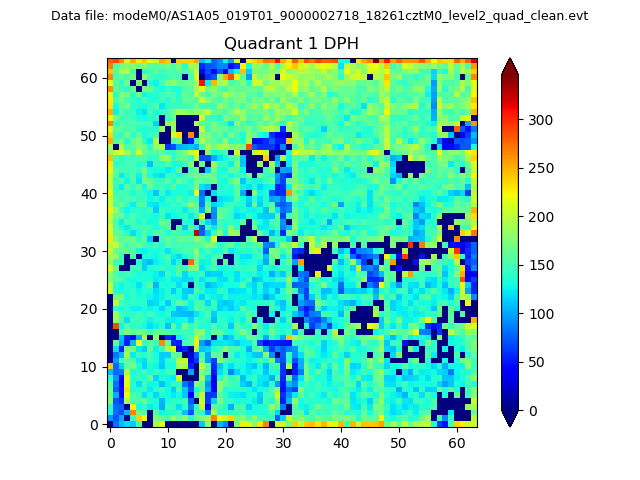
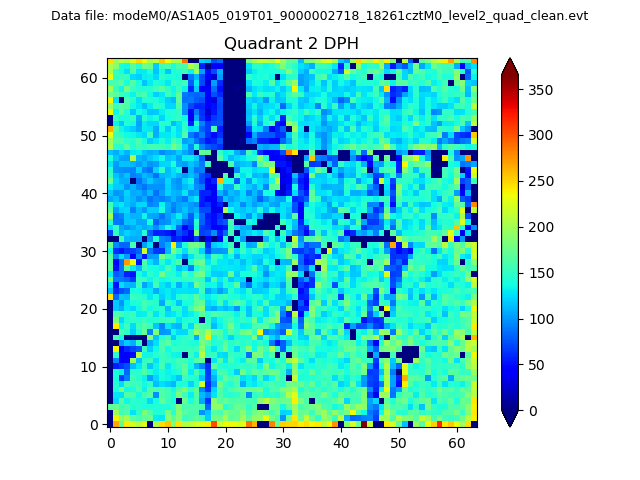
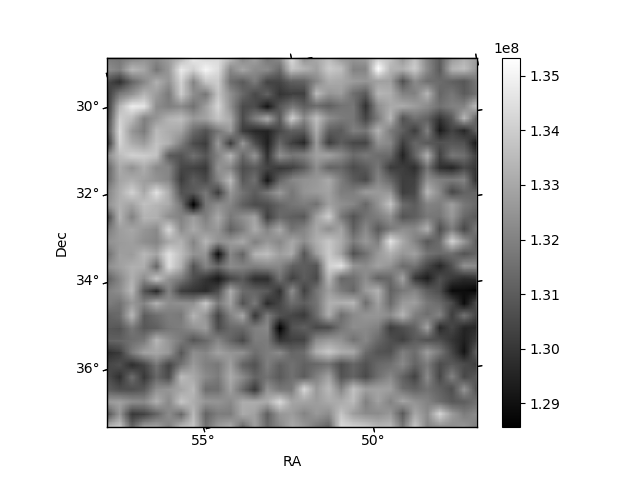
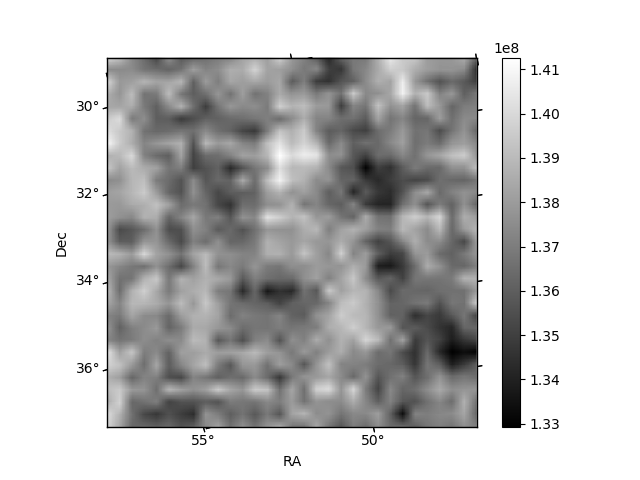
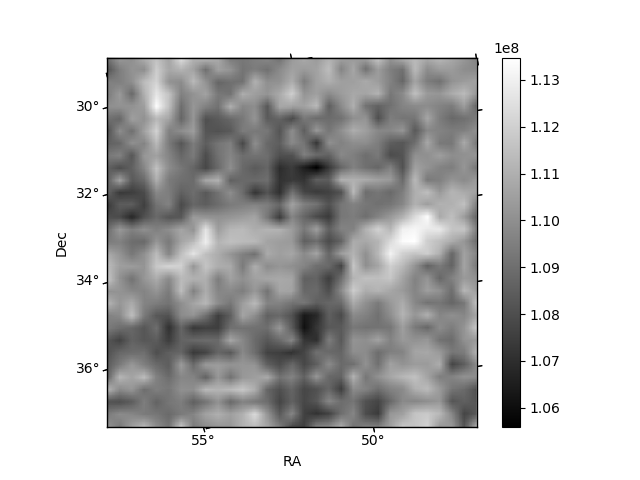
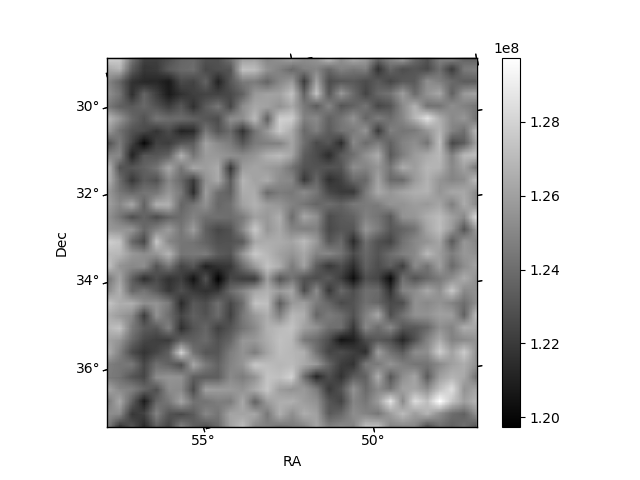
Histogram calculated using DETX and DETY for each event in the final _common_clean file
| Quadrant A |  |
 |
Quadrant B |
|---|---|---|---|
| Quadrant D |  |
 |
Quadrant C |
| Plot type | Count rate plots | Images |
|---|---|---|
| Comparison with Poisson distribution Blue bars denote a histogram of data divided into 1 sec bins. Red curve is a Poisson curve with rate = median count rate of data. |
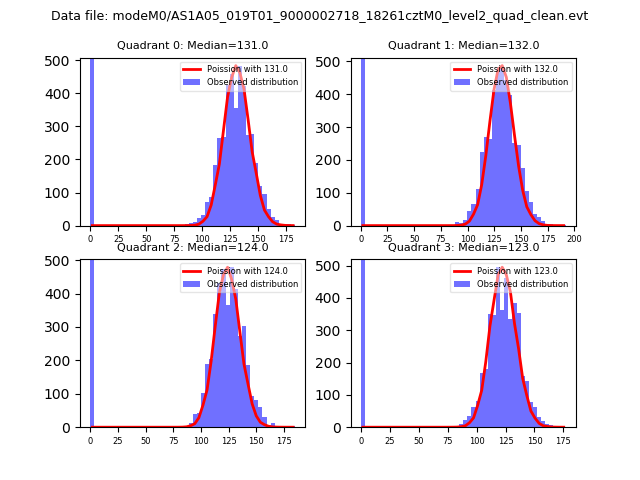 |
 |
| Quadrant-wise count rates Data is divided into 100 sec bins |
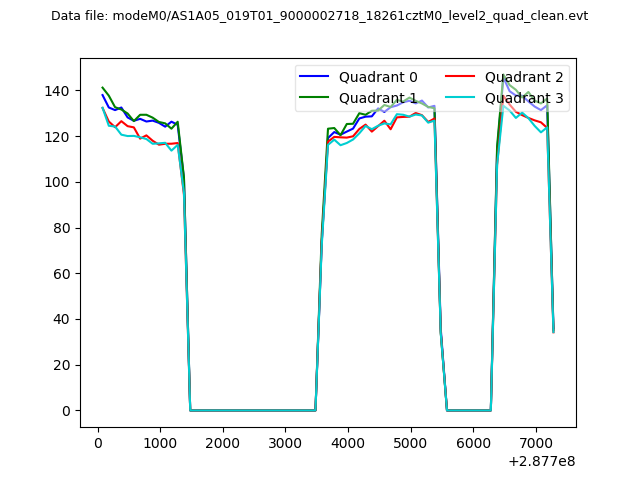 |
|
| Module-wise count rates for Quadrant A Data is divided into 100 sec bins |
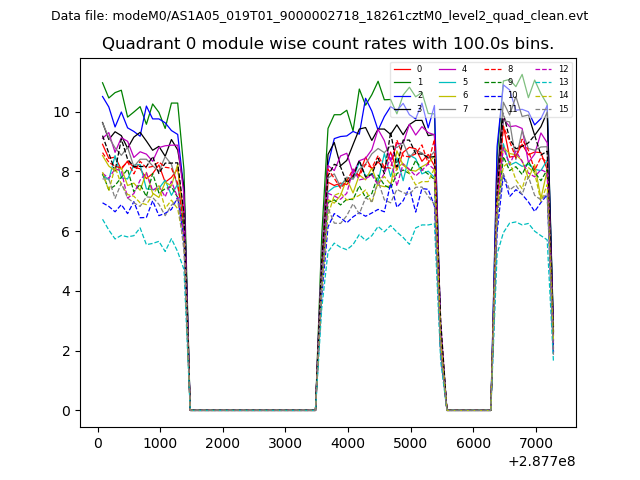 |
 |
| Module-wise count rates for Quadrant B Data is divided into 100 sec bins |
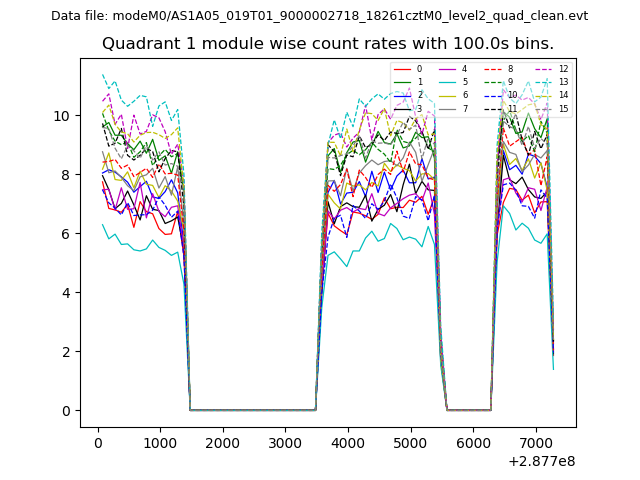 |
 |
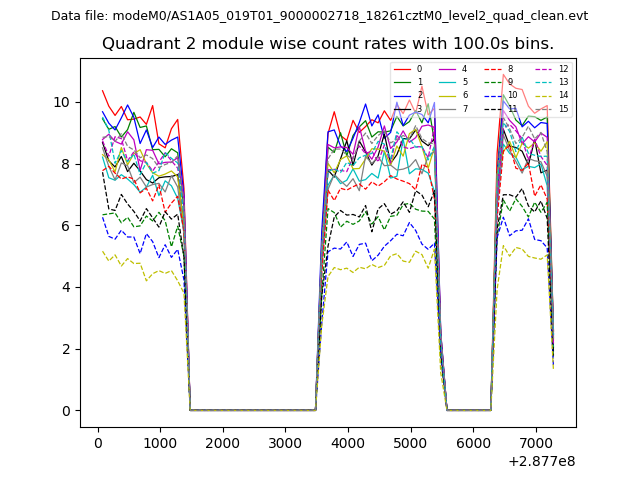
| Module-wise count rates for Quadrant C Data is divided into 100 sec bins |
 |
 |
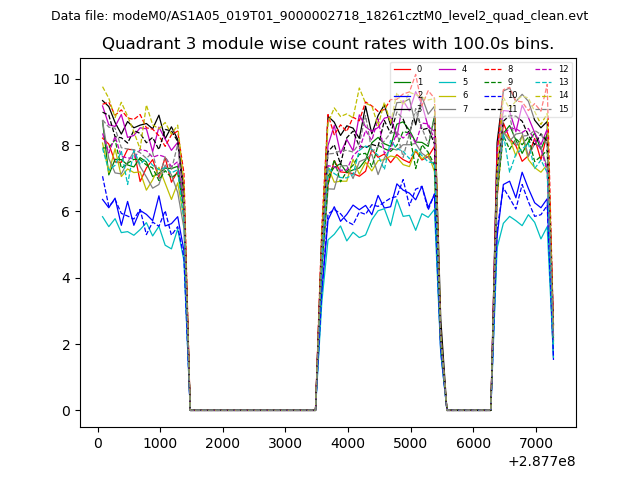
| Module-wise count rates for Quadrant D Data is divided into 100 sec bins |
 |
 |
| Parameter | Plot |
|---|---|
| CZT HV Monitor |  |
| D_VDD | 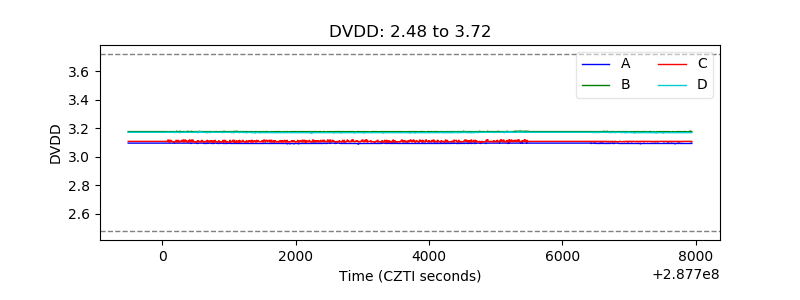 |
| Temperature 1 | 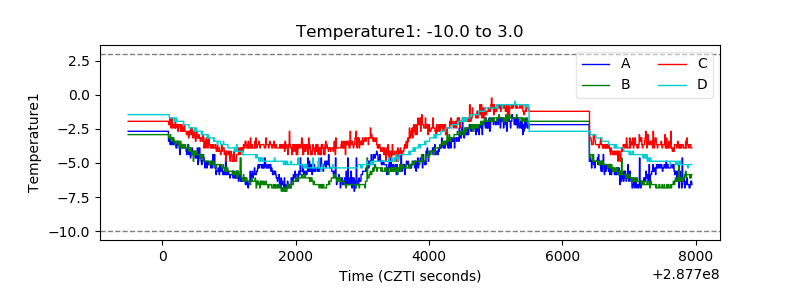 |
| Veto HV Monitor | 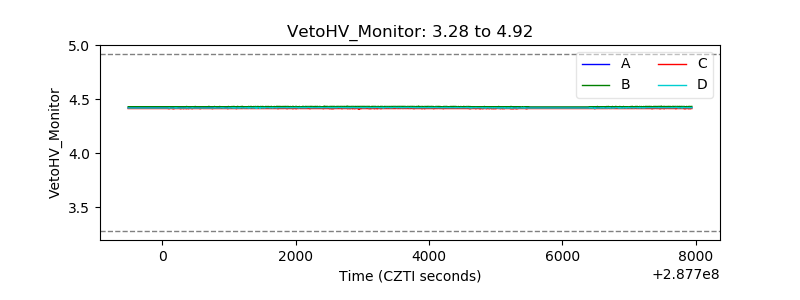 |
| Veto LLD | 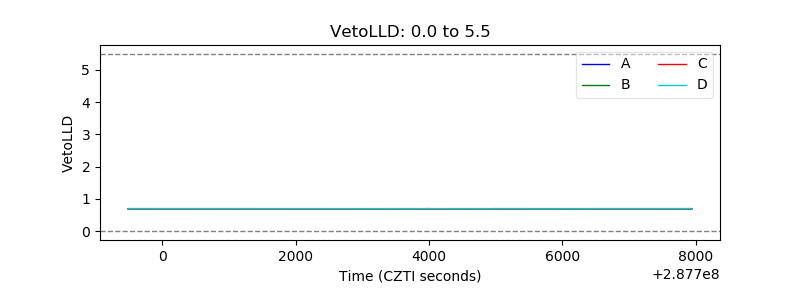 |
| Alpha Counter | 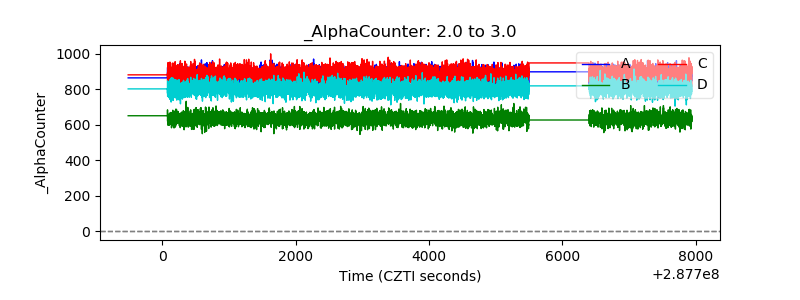 |
| _CPM_Rate | 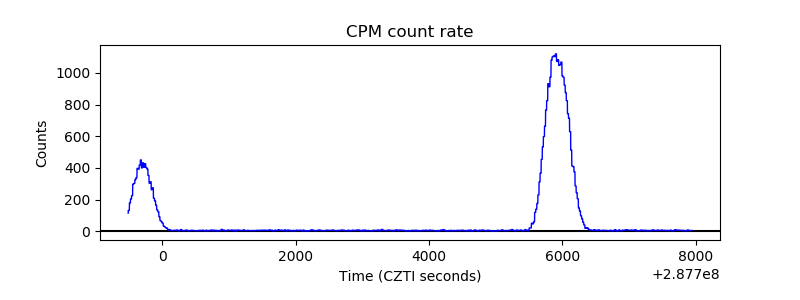 |
| CZT Counter | 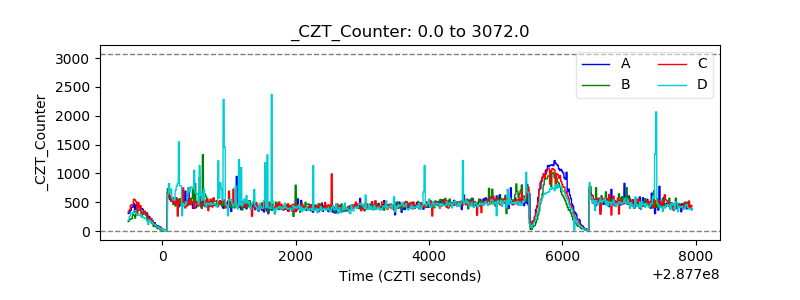 |
| +2.5 Volts monitor |  |
| +5 Volts monitor |  |
| _ROLL_ROT | 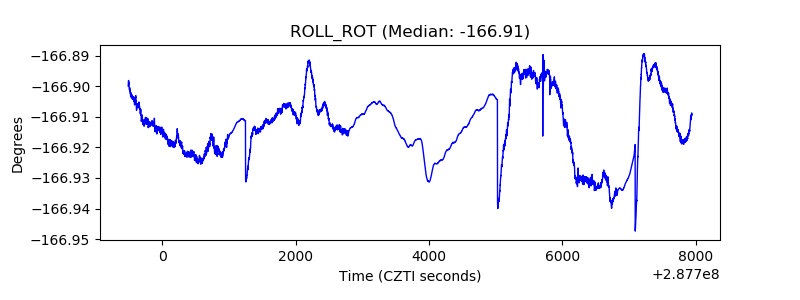 |
| _Roll_DEC | 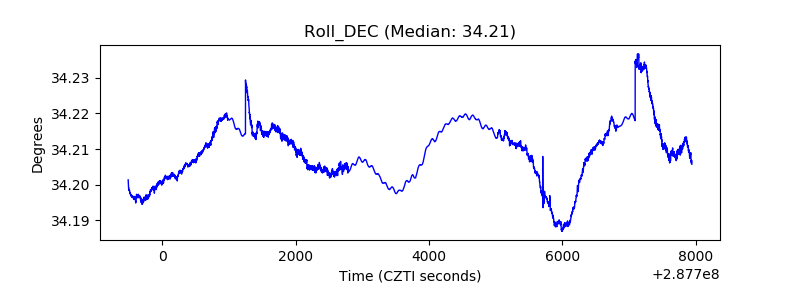 |
| _Roll_RA | 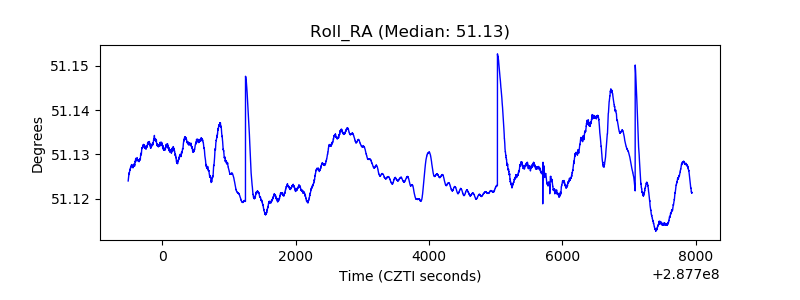 |
| Veto Counter | 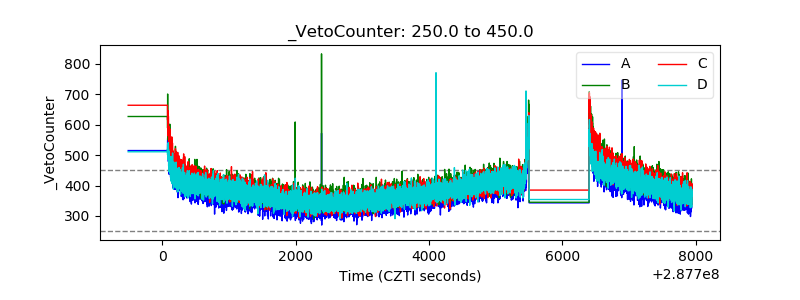 |