| Param | Original file | Final file |
|---|---|---|
| Filename | modeM0/AS1A05_019T01_9000002718_18262cztM0_level2.evt | modeM0/AS1A05_019T01_9000002718_18262cztM0_level2_quad_clean.evt |
| Size (bytes) | 489,784,320 | 81,120,960 |
| Size | 467.1 MB | 77.4 MB |
| Events in quadrant A | 3,427,087 | 505,353 |
| Events in quadrant B | 3,443,244 | 511,911 |
| Events in quadrant C | 3,320,444 | 484,682 |
| Events in quadrant D | 4,169,123 | 468,954 |
| Mode M9 | |||
|---|---|---|---|
| Quadrant | BADHDUFLAG | Total packets | Discarded packets |
| A | 0 | 19 | 0 |
| B | 0 | 19 | 0 |
| C | 0 | 19 | 0 |
| D | 0 | 19 | 0 |
| Mode M0 | |||
|---|---|---|---|
| Quadrant | BADHDUFLAG | Total packets | Discarded packets |
| A | 0 | 14558 | 2 |
| B | 0 | 14692 | 2 |
| C | 0 | 14274 | 2 |
| D | 0 | 17278 | 2 |
| Mode SS | |||
|---|---|---|---|
| Quadrant | BADHDUFLAG | Total packets | Discarded packets |
| A | 0 | 144 | 0 |
| B | 0 | 144 | 0 |
| C | 0 | 144 | 0 |
| D | 0 | 144 | 0 |
| Quadrant | Total seconds | Saturated seconds | Saturation percentage |
|---|---|---|---|
| A | 6968 | 29 | 0.416188% |
| B | 6968 | 52 | 0.746269% |
| C | 6967 | 70 | 1.004737% |
| D | 6967 | 158 | 2.267834% |
Noise dominated data is calculated using 1-second bins in cleaned event files. If a bin has >2000 counts, and if more than 50% of those come from <1% of pixels, then it is considered to be noise-dominated and hence unusable.
| Quadrant | # 1 sec bins | Bins with >0 counts | Bins with >2000 counts | High rate bins dominated by noise | Noise dominated (total time) | Noise dominated (detector-on time) | Marked lightcurve |
|---|---|---|---|---|---|---|---|
| A | 8913 | 6970 | 2 | 2 | 0.02% | 0.03% | 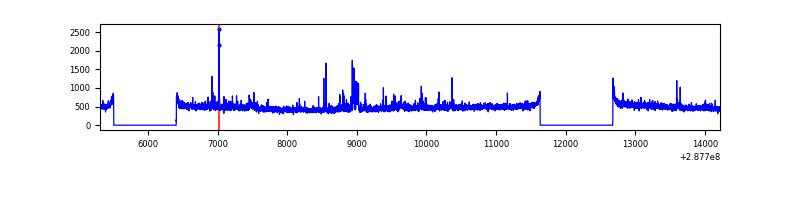 |
| B | 8913 | 6970 | 3 | 3 | 0.03% | 0.04% | 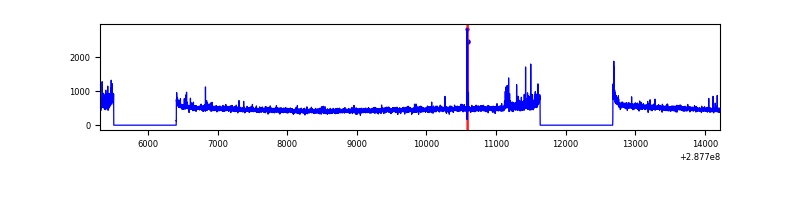 |
| C | 8912 | 6969 | 0 | 0 | 0.00% | 0.00% | 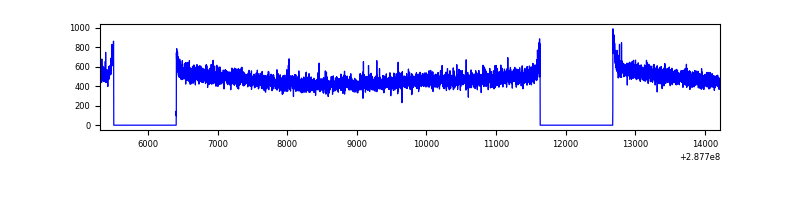 |
| D | 8912 | 6969 | 99 | 99 | 1.11% | 1.42% | 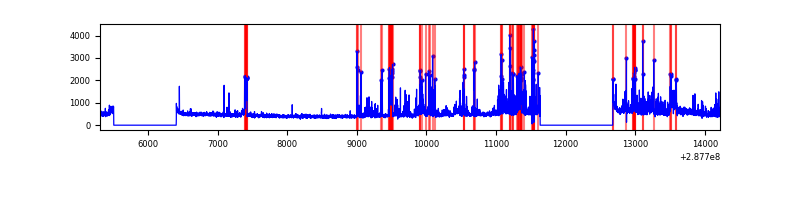 |
Top three noisy pixels from each quadrant. If the there are fewer than three noisy pixels in the level2.evt file, extra rows are filled as -1
| Pixel properties | Quadrant properties | ||||||
|---|---|---|---|---|---|---|---|
| Quadrant | DetID | PixID | Counts | Sigma | Mean | Median | Sigma |
| A | 4 | 2 | 144044 | 824.38 | 851 | 832 | 173.7 |
| A | 0 | 226 | 7415 | 37.89 | 851 | 832 | 173.7 |
| A | 11 | 29 | 6357 | 31.8 | 851 | 832 | 173.7 |
| B | 7 | 220 | 79204 | 477.81 | 854 | 833 | 164.0 |
| B | 12 | 111 | 19288 | 112.52 | 854 | 833 | 164.0 |
| B | 11 | 111 | 16879 | 97.83 | 854 | 833 | 164.0 |
| C | 14 | 238 | 127226 | 657.59 | 818 | 822 | 192.2 |
| C | 13 | 61 | 5696 | 25.36 | 818 | 822 | 192.2 |
| C | 3 | 233 | 4004 | 16.55 | 818 | 822 | 192.2 |
| D | 1 | 52 | 786179 | 3957.53 | 817 | 793 | 198.5 |
| D | 7 | 238 | 181211 | 909.12 | 817 | 793 | 198.5 |
| D | 2 | 152 | 61327 | 305.03 | 817 | 793 | 198.5 |
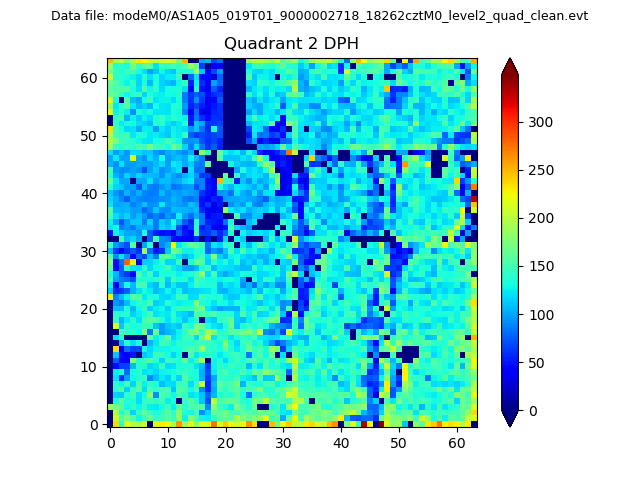
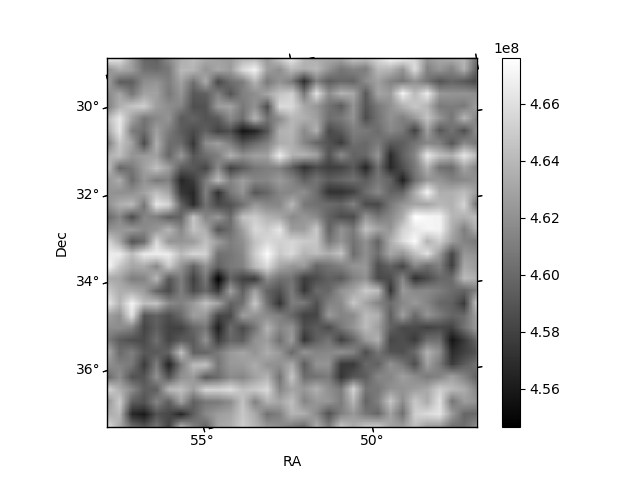
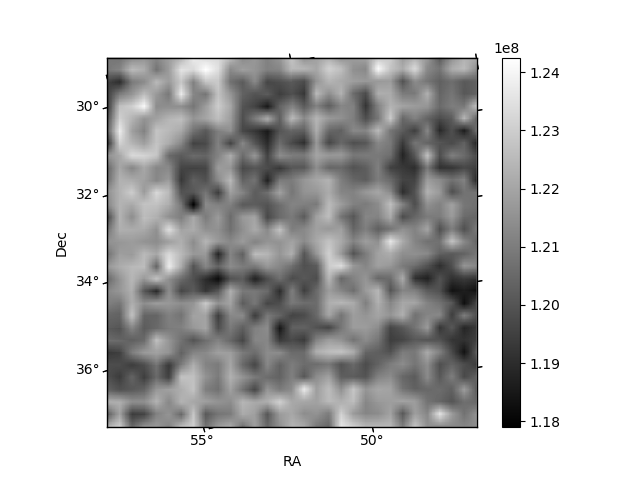
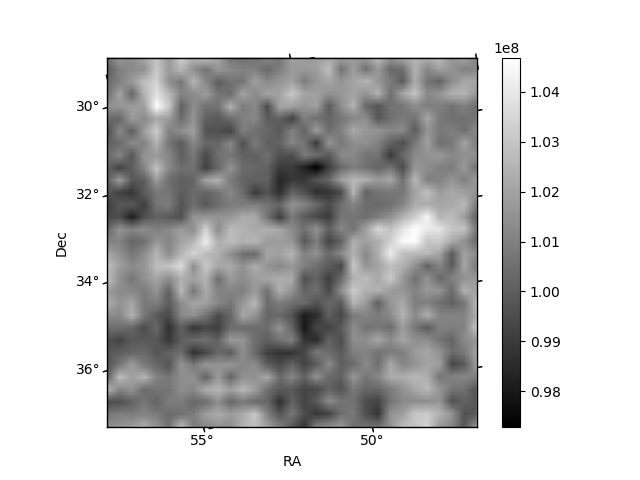
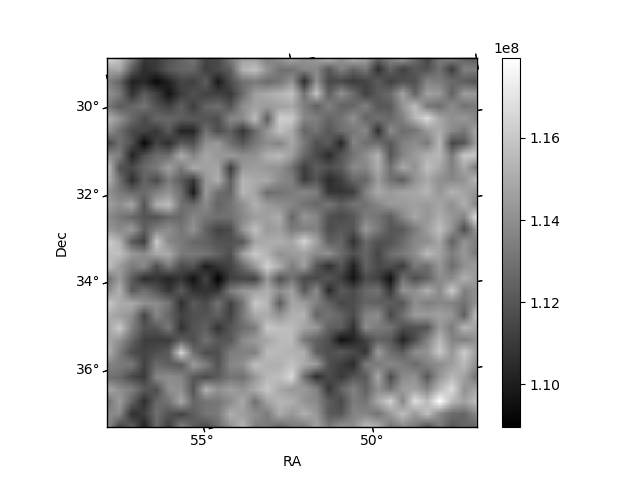
Histogram calculated using DETX and DETY for each event in the final _common_clean file
| Quadrant A | 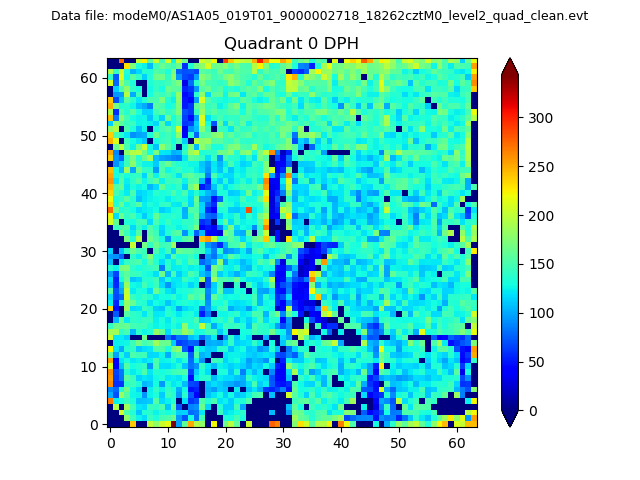 |
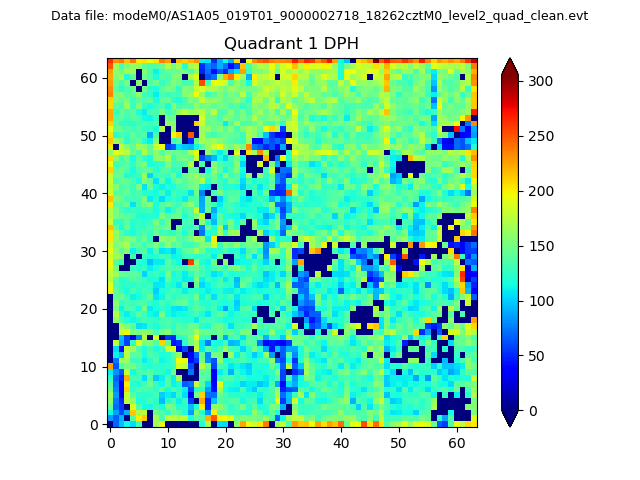 |
Quadrant B |
|---|---|---|---|
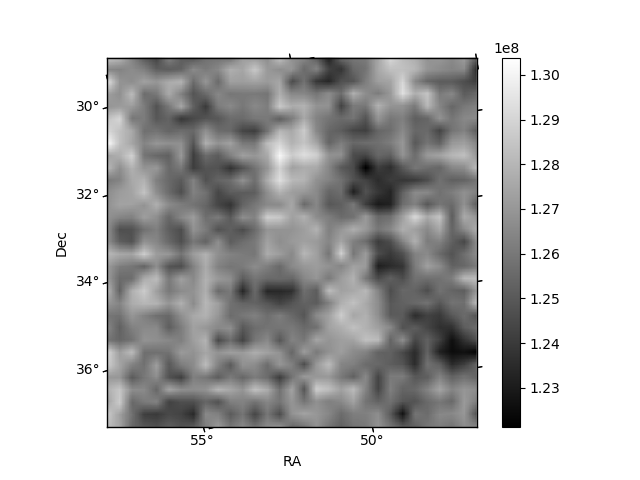
| Quadrant D | 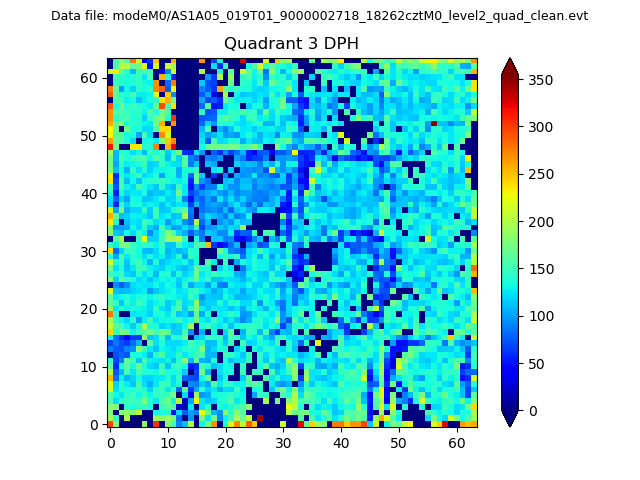 |
 |
Quadrant C |
| Plot type | Count rate plots | Images |
|---|---|---|
| Comparison with Poisson distribution Blue bars denote a histogram of data divided into 1 sec bins. Red curve is a Poisson curve with rate = median count rate of data. |
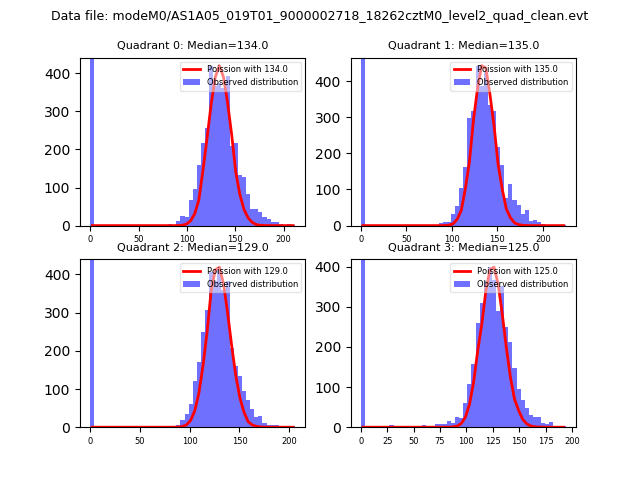 |
 |
| Quadrant-wise count rates Data is divided into 100 sec bins |
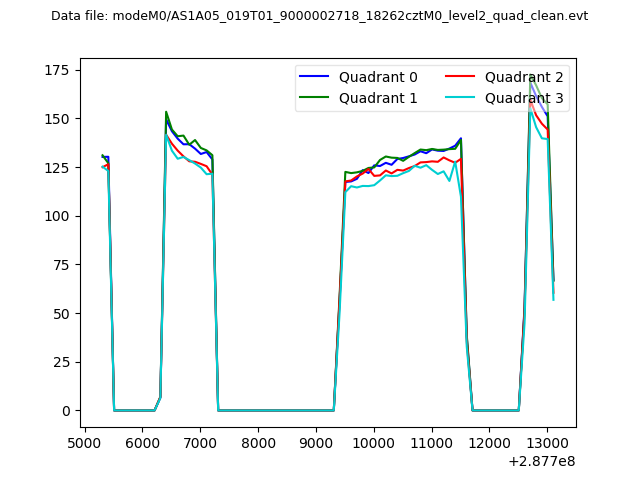 |
|
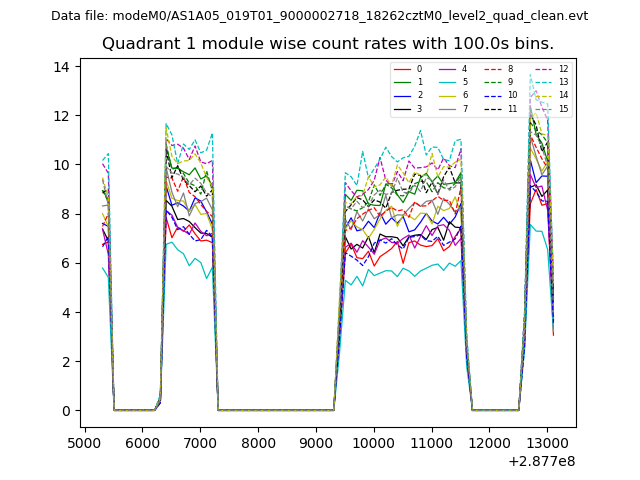
| Module-wise count rates for Quadrant A Data is divided into 100 sec bins |
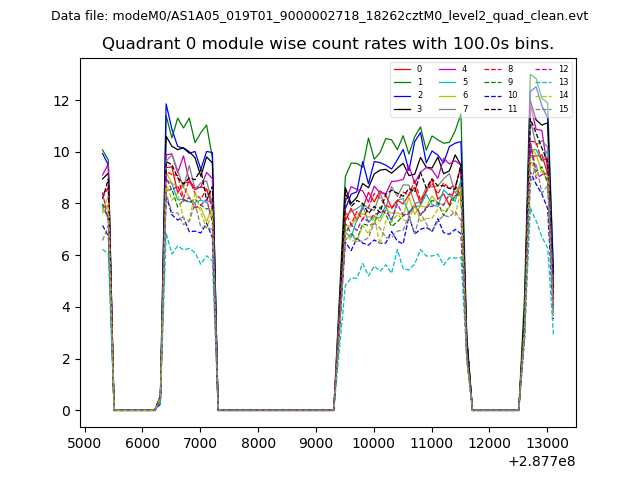 |
 |
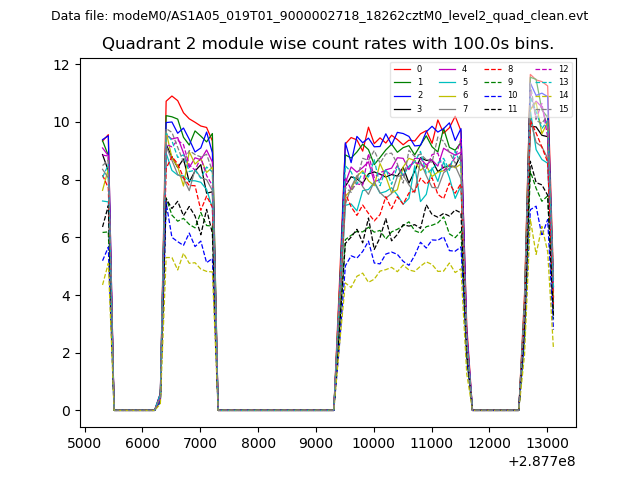
| Module-wise count rates for Quadrant B Data is divided into 100 sec bins |
 |
 |
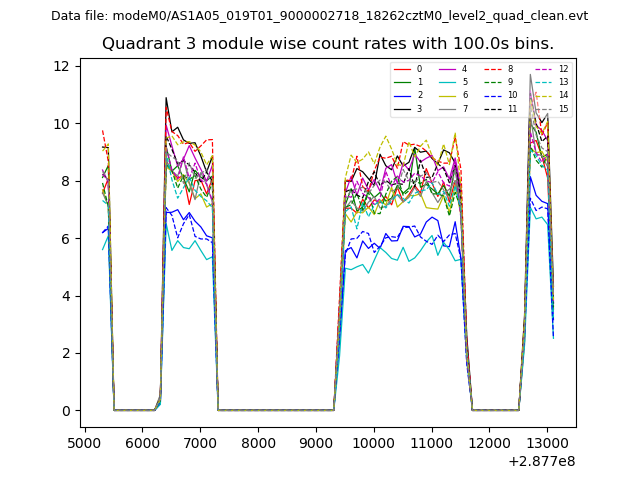
| Module-wise count rates for Quadrant C Data is divided into 100 sec bins |
 |
 |
| Module-wise count rates for Quadrant D Data is divided into 100 sec bins |
 |
 |
| Parameter | Plot |
|---|---|
| CZT HV Monitor | 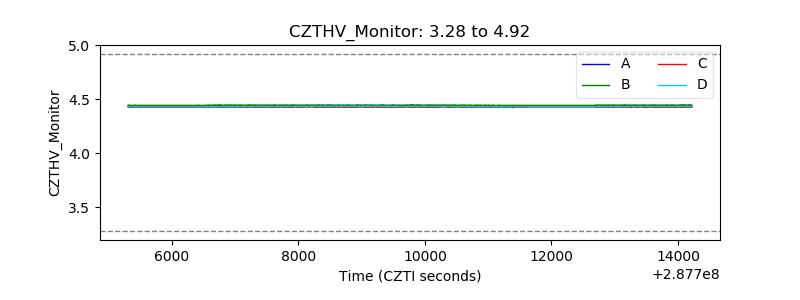 |
| D_VDD | 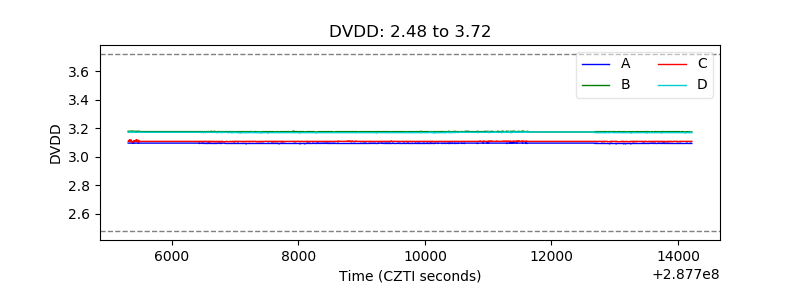 |
| Temperature 1 |  |
| Veto HV Monitor | 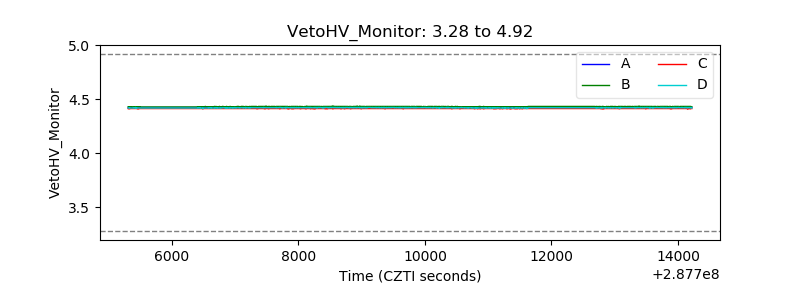 |
| Veto LLD | 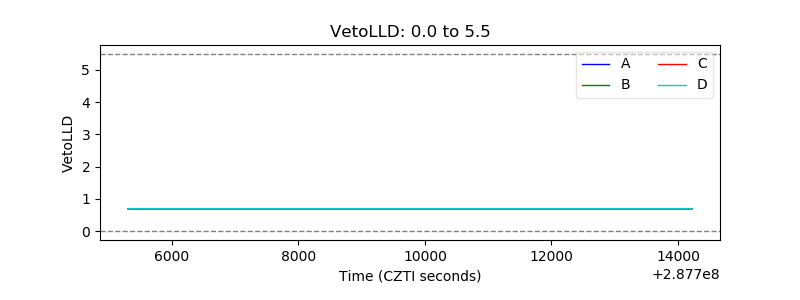 |
| Alpha Counter | 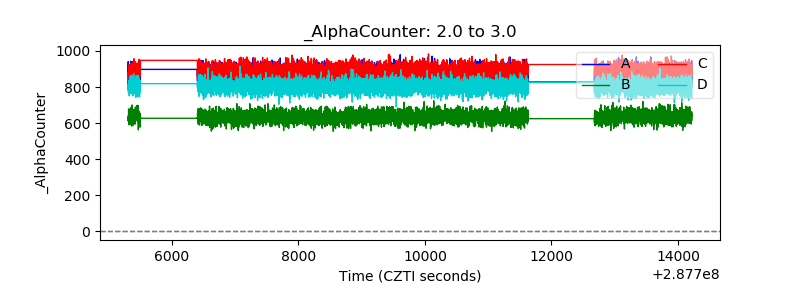 |
| _CPM_Rate | 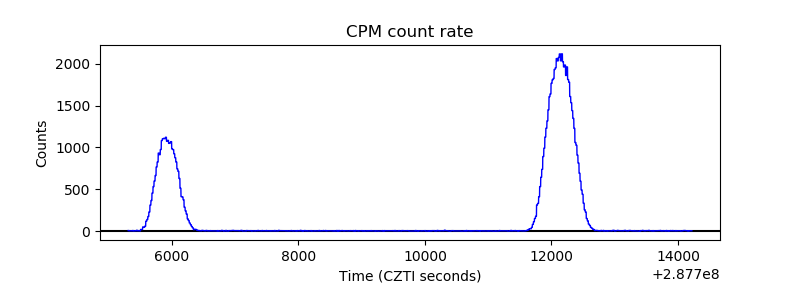 |
| CZT Counter | 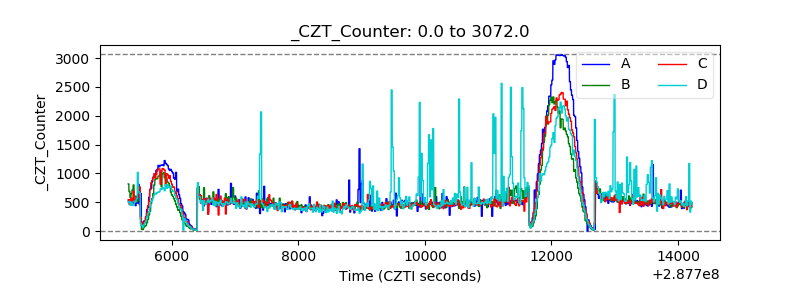 |
| +2.5 Volts monitor |  |
| +5 Volts monitor |  |
| _ROLL_ROT | 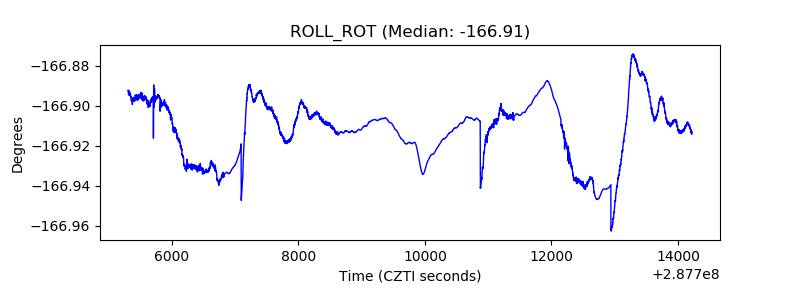 |
| _Roll_DEC | 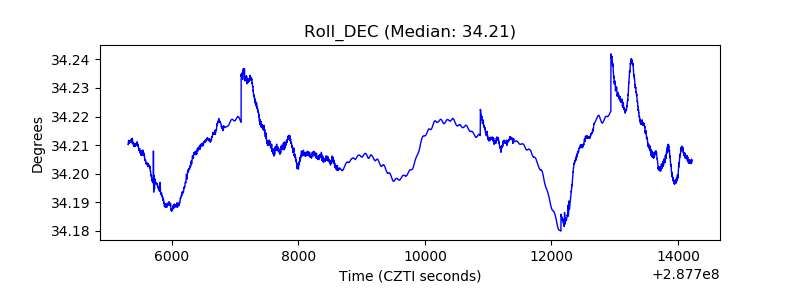 |
| _Roll_RA | 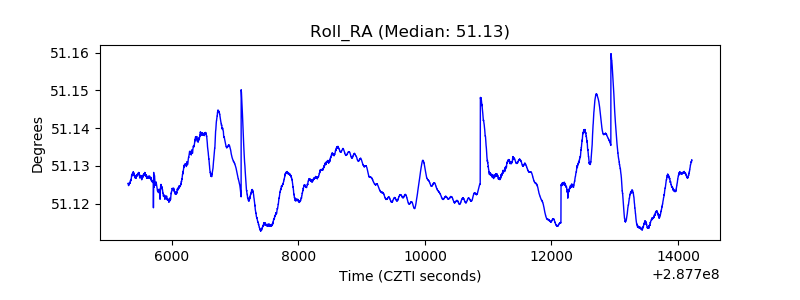 |
| Veto Counter | 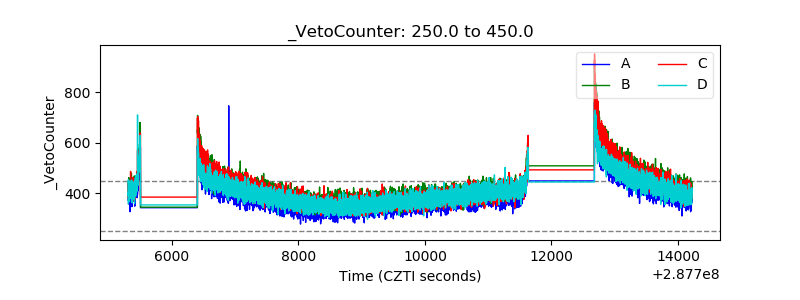 |