| Param | Original file | Final file |
|---|---|---|
| Filename | modeM0/AS1A05_019T01_9000002718_18264cztM0_level2.evt | modeM0/AS1A05_019T01_9000002718_18264cztM0_level2_quad_clean.evt |
| Size (bytes) | 475,110,720 | 66,836,160 |
| Size | 453.1 MB | 63.7 MB |
| Events in quadrant A | 3,186,259 | 403,427 |
| Events in quadrant B | 3,252,929 | 411,769 |
| Events in quadrant C | 3,172,288 | 386,793 |
| Events in quadrant D | 4,340,402 | 372,699 |
| Mode M9 | |||
|---|---|---|---|
| Quadrant | BADHDUFLAG | Total packets | Discarded packets |
| A | 0 | 12 | 0 |
| B | 0 | 12 | 0 |
| C | 0 | 12 | 0 |
| D | 0 | 12 | 0 |
| Mode M0 | |||
|---|---|---|---|
| Quadrant | BADHDUFLAG | Total packets | Discarded packets |
| A | 0 | 13451 | 2 |
| B | 0 | 13636 | 2 |
| C | 0 | 13444 | 2 |
| D | 0 | 17409 | 2 |
| Mode SS | |||
|---|---|---|---|
| Quadrant | BADHDUFLAG | Total packets | Discarded packets |
| A | 0 | 132 | 0 |
| B | 0 | 132 | 0 |
| C | 0 | 132 | 0 |
| D | 0 | 132 | 0 |
| Quadrant | Total seconds | Saturated seconds | Saturation percentage |
|---|---|---|---|
| A | 6428 | 17 | 0.264468% |
| B | 6429 | 25 | 0.388863% |
| C | 6429 | 50 | 0.777726% |
| D | 6429 | 167 | 2.597605% |
Noise dominated data is calculated using 1-second bins in cleaned event files. If a bin has >2000 counts, and if more than 50% of those come from <1% of pixels, then it is considered to be noise-dominated and hence unusable.
| Quadrant | # 1 sec bins | Bins with >0 counts | Bins with >2000 counts | High rate bins dominated by noise | Noise dominated (total time) | Noise dominated (detector-on time) | Marked lightcurve |
|---|---|---|---|---|---|---|---|
| A | 7623 | 6429 | 0 | 0 | 0.00% | 0.00% | 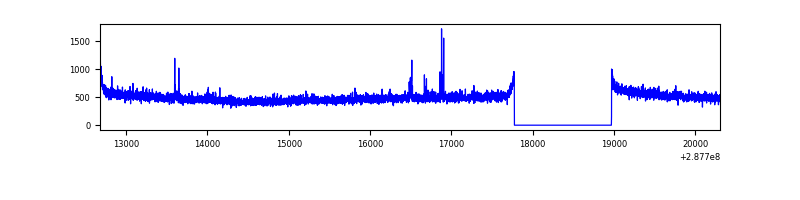 |
| B | 7624 | 6430 | 0 | 0 | 0.00% | 0.00% | 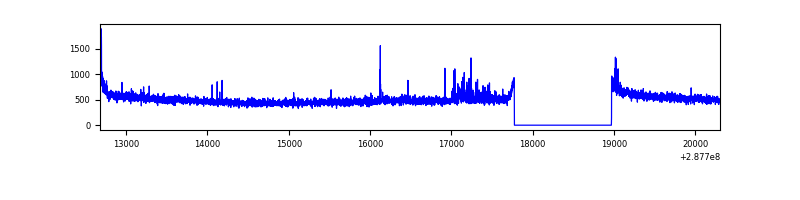 |
| C | 7624 | 6430 | 0 | 0 | 0.00% | 0.00% | 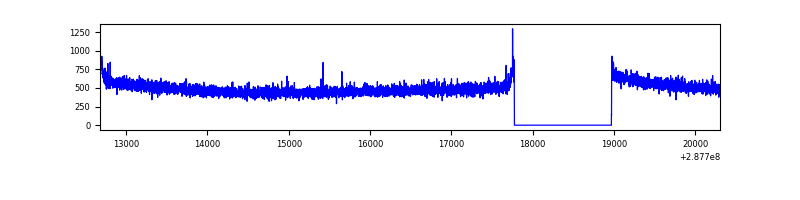 |
| D | 7624 | 6430 | 129 | 129 | 1.69% | 2.01% | 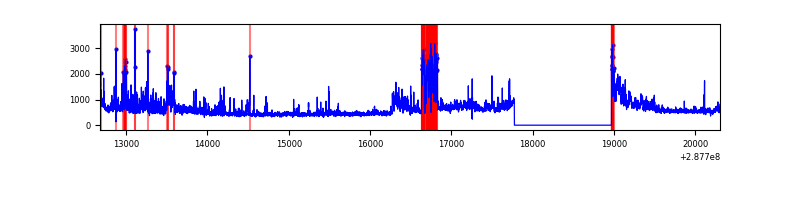 |
Top three noisy pixels from each quadrant. If the there are fewer than three noisy pixels in the level2.evt file, extra rows are filled as -1
| Pixel properties | Quadrant properties | ||||||
|---|---|---|---|---|---|---|---|
| Quadrant | DetID | PixID | Counts | Sigma | Mean | Median | Sigma |
| A | 4 | 2 | 24134 | 142.41 | 816 | 798 | 163.9 |
| A | 15 | 174 | 22604 | 133.08 | 816 | 798 | 163.9 |
| A | 0 | 226 | 7091 | 38.4 | 816 | 798 | 163.9 |
| B | 7 | 220 | 36230 | 229.68 | 818 | 799 | 154.3 |
| B | 12 | 111 | 18173 | 112.63 | 818 | 799 | 154.3 |
| B | 11 | 111 | 16008 | 98.59 | 818 | 799 | 154.3 |
| C | 14 | 238 | 122595 | 665.64 | 781 | 786 | 183.0 |
| C | 13 | 61 | 5418 | 25.31 | 781 | 786 | 183.0 |
| C | 3 | 233 | 4126 | 18.25 | 781 | 786 | 183.0 |
| D | 1 | 52 | 791671 | 4145.38 | 779 | 756 | 190.8 |
| D | 7 | 238 | 525037 | 2747.88 | 779 | 756 | 190.8 |
| D | 2 | 234 | 26324 | 134.01 | 779 | 756 | 190.8 |
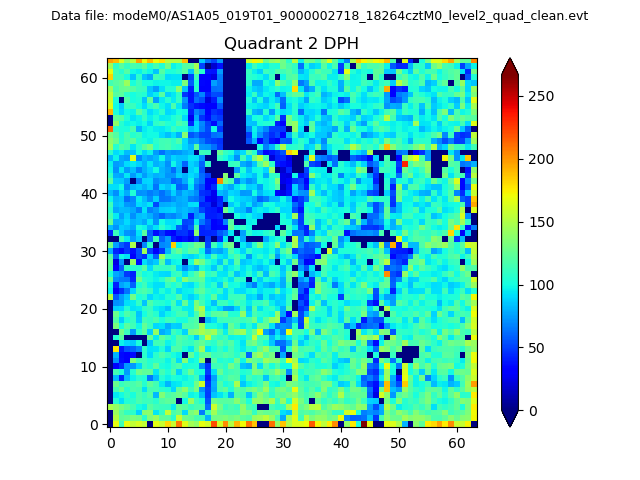
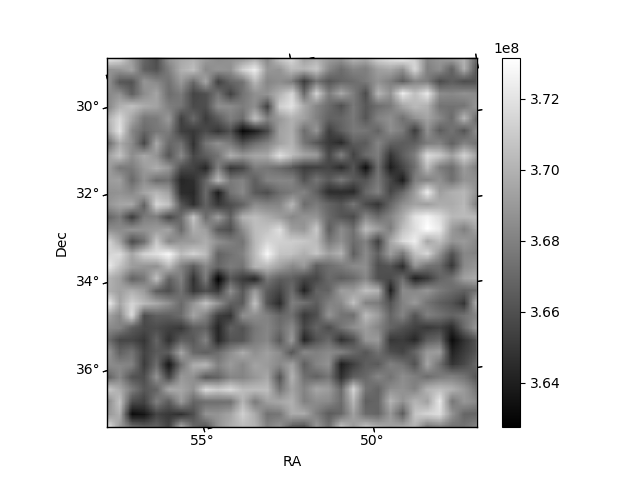
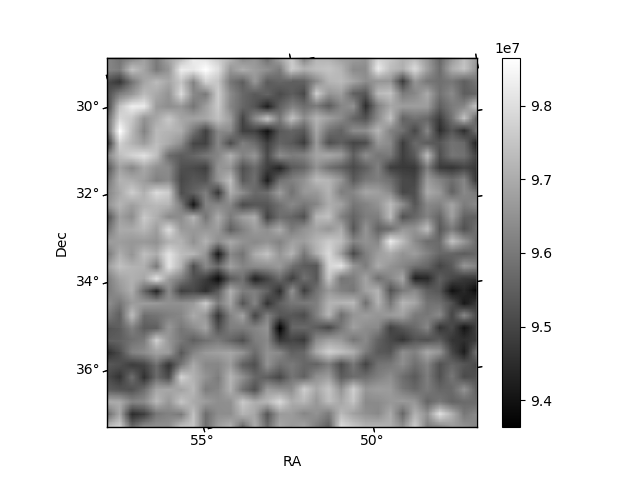
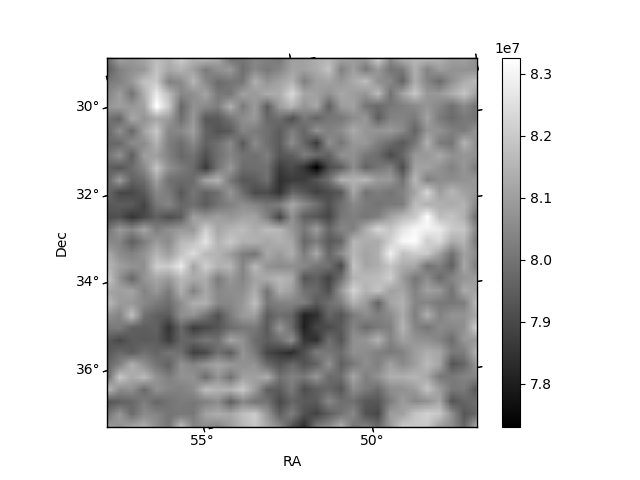
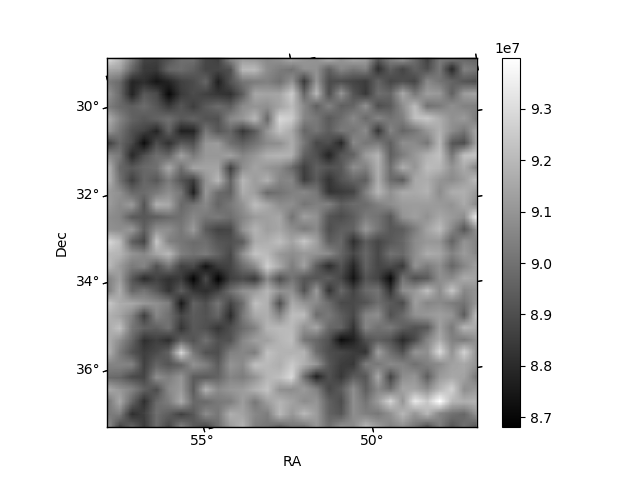
Histogram calculated using DETX and DETY for each event in the final _common_clean file
| Quadrant A | 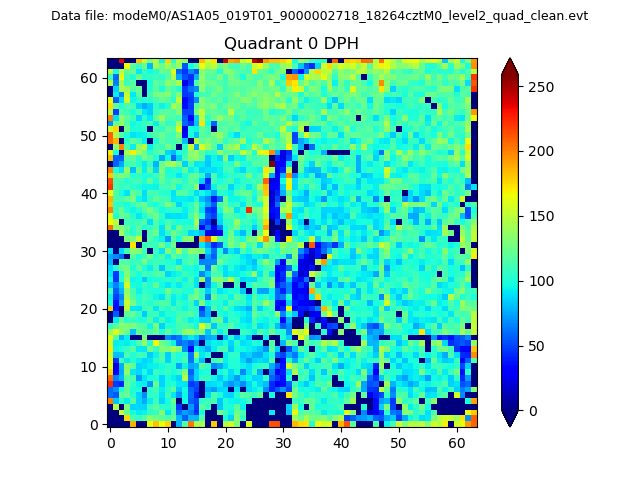 |
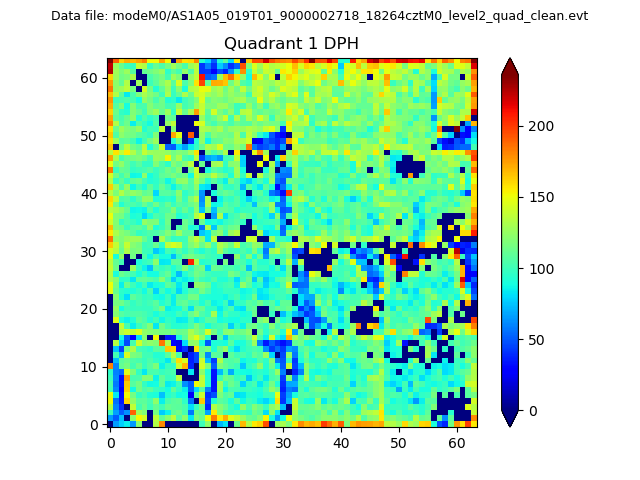 |
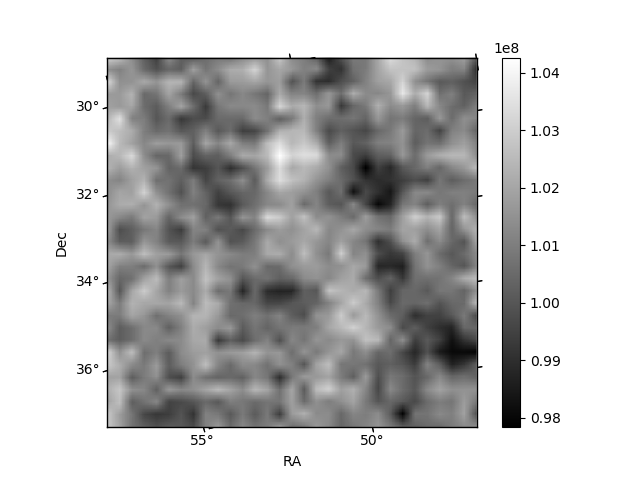
Quadrant B |
|---|---|---|---|
| Quadrant D | 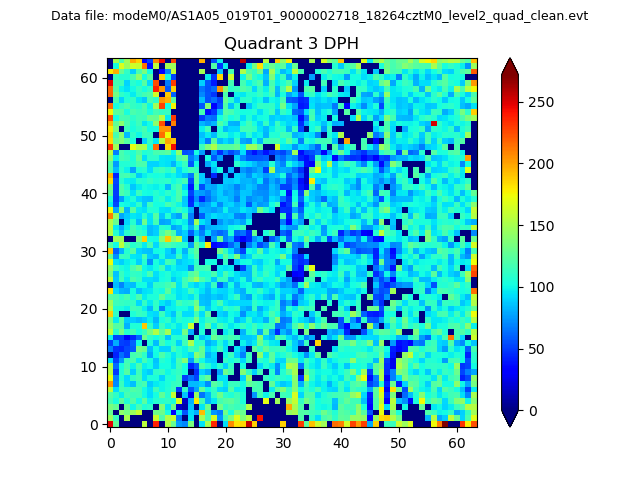 |
 |
Quadrant C |
| Plot type | Count rate plots | Images |
|---|---|---|
| Comparison with Poisson distribution Blue bars denote a histogram of data divided into 1 sec bins. Red curve is a Poisson curve with rate = median count rate of data. |
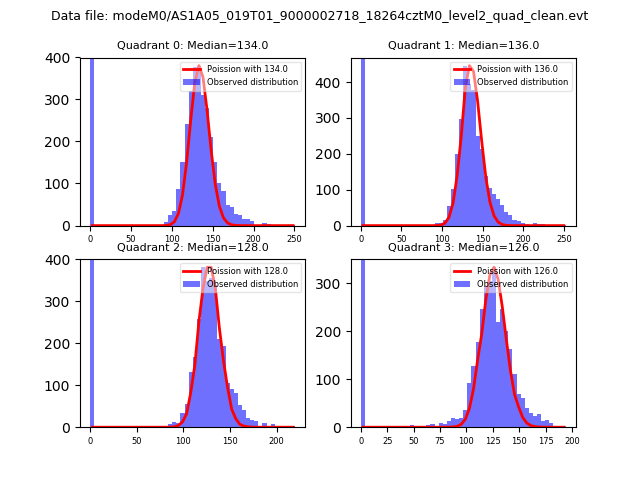 |
 |
| Quadrant-wise count rates Data is divided into 100 sec bins |
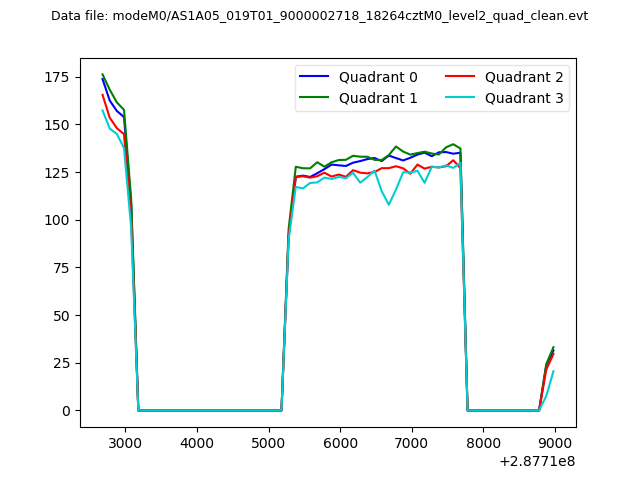 |
|
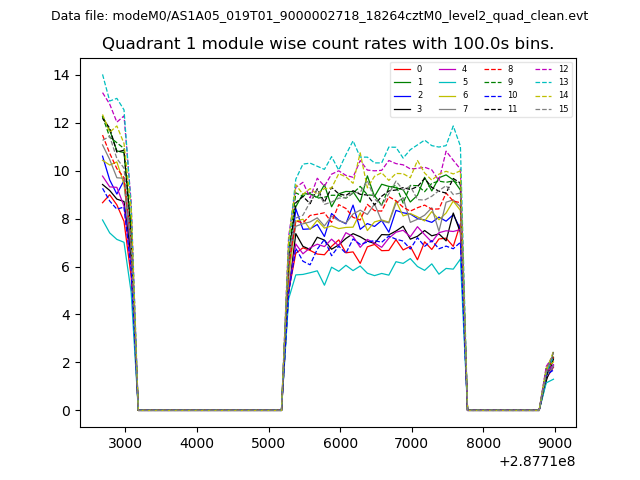
| Module-wise count rates for Quadrant A Data is divided into 100 sec bins |
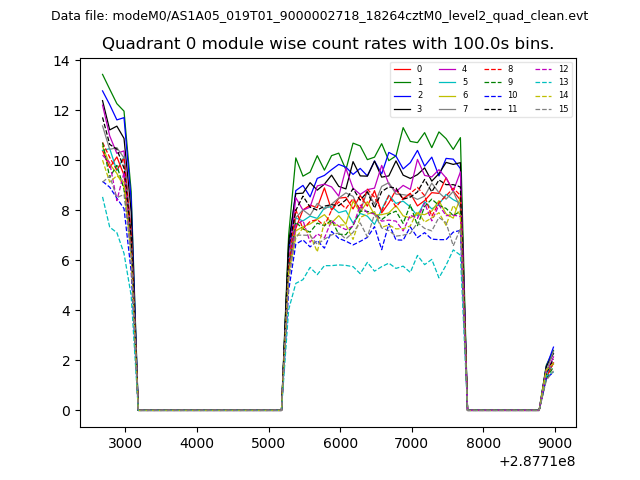 |
 |
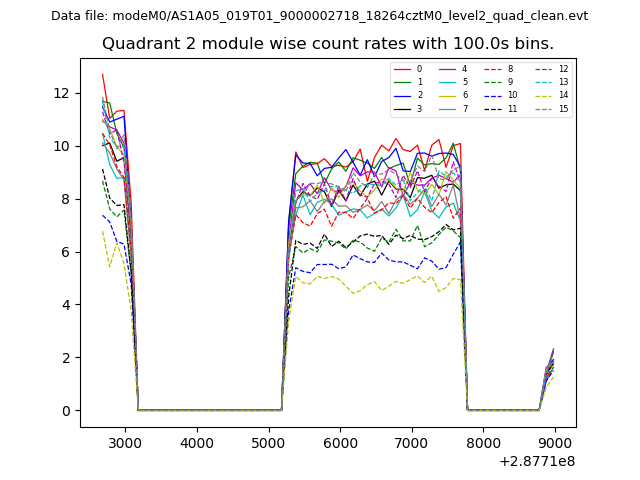
| Module-wise count rates for Quadrant B Data is divided into 100 sec bins |
 |
 |
| Module-wise count rates for Quadrant C Data is divided into 100 sec bins |
 |
 |
| Module-wise count rates for Quadrant D Data is divided into 100 sec bins |
 |
 |
| Parameter | Plot |
|---|---|
| CZT HV Monitor | 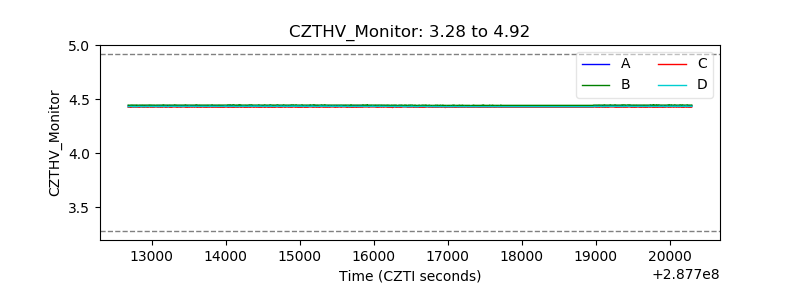 |
| D_VDD | 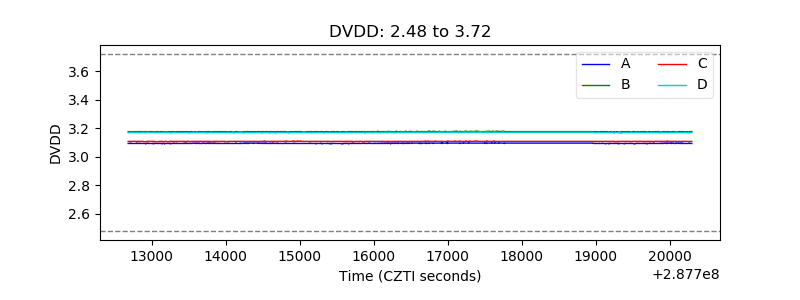 |
| Temperature 1 |  |
| Veto HV Monitor | 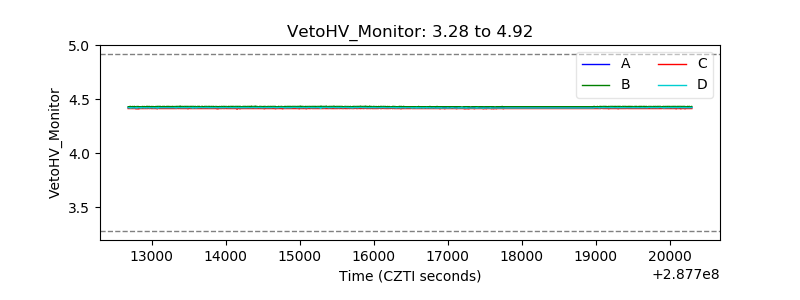 |
| Veto LLD | 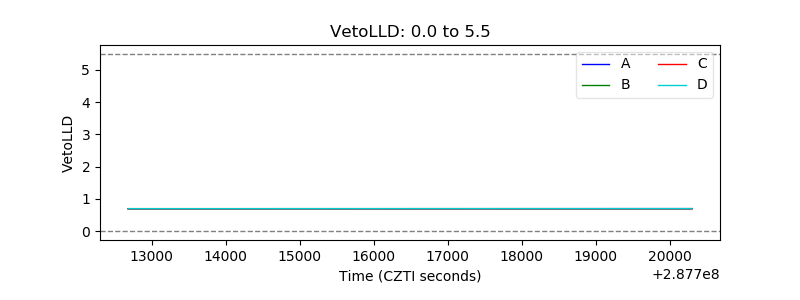 |
| Alpha Counter | 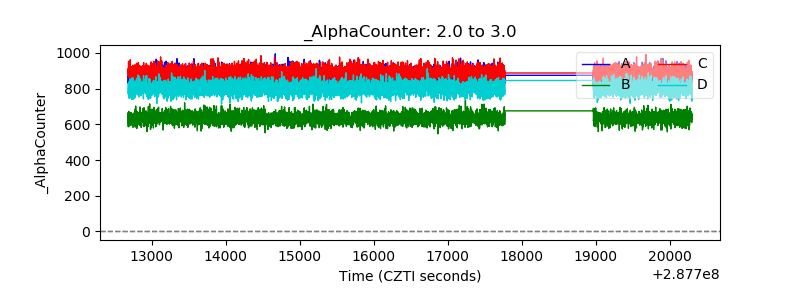 |
| _CPM_Rate | 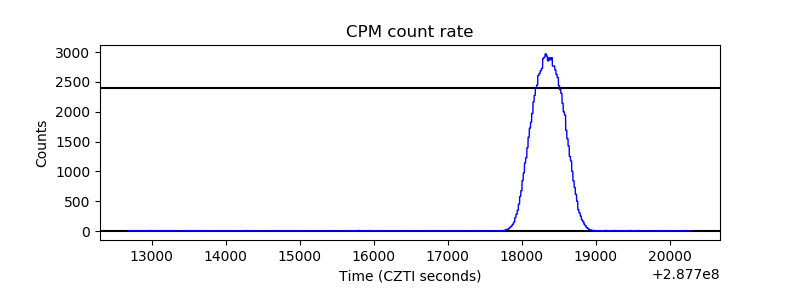 |
| CZT Counter | 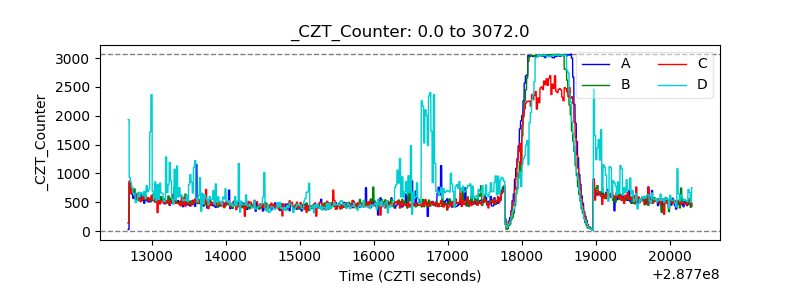 |
| +2.5 Volts monitor |  |
| +5 Volts monitor |  |
| _ROLL_ROT | 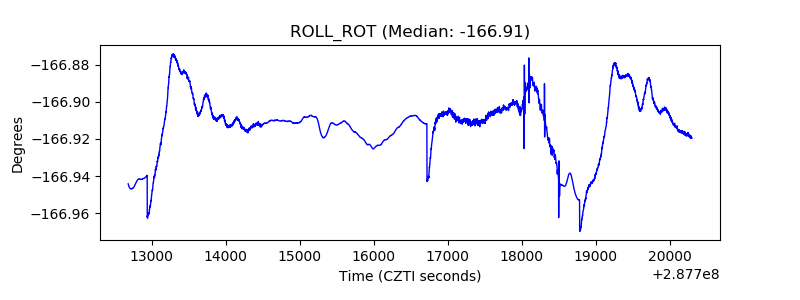 |
| _Roll_DEC |  |
| _Roll_RA | 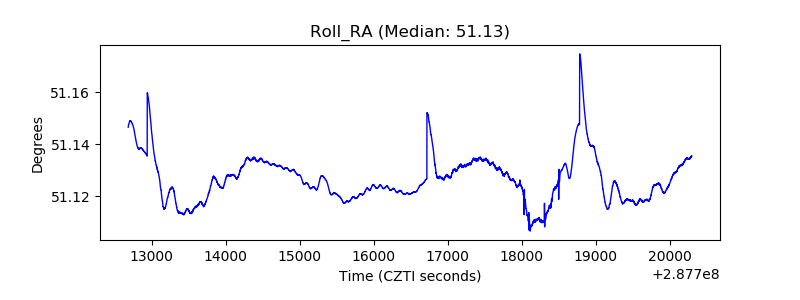 |
| Veto Counter | 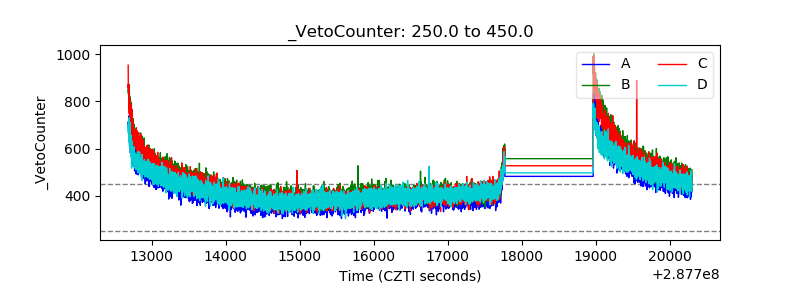 |