| Param | Original file | Final file |
|---|---|---|
| Filename | modeM0/AS1A05_019T01_9000002718_18265cztM0_level2.evt | modeM0/AS1A05_019T01_9000002718_18265cztM0_level2_quad_clean.evt |
| Size (bytes) | 495,552,960 | 64,307,520 |
| Size | 472.6 MB | 61.3 MB |
| Events in quadrant A | 3,410,521 | 386,668 |
| Events in quadrant B | 3,374,411 | 391,571 |
| Events in quadrant C | 3,325,568 | 368,003 |
| Events in quadrant D | 4,462,818 | 353,829 |
| Mode M9 | |||
|---|---|---|---|
| Quadrant | BADHDUFLAG | Total packets | Discarded packets |
| A | 0 | 20 | 0 |
| B | 0 | 21 | 0 |
| C | 0 | 21 | 0 |
| D | 0 | 21 | 0 |
| Mode M0 | |||
|---|---|---|---|
| Quadrant | BADHDUFLAG | Total packets | Discarded packets |
| A | 0 | 14040 | 2 |
| B | 0 | 13927 | 2 |
| C | 0 | 13813 | 2 |
| D | 0 | 17527 | 2 |
| Mode SS | |||
|---|---|---|---|
| Quadrant | BADHDUFLAG | Total packets | Discarded packets |
| A | 0 | 130 | 0 |
| B | 0 | 130 | 0 |
| C | 0 | 130 | 0 |
| D | 0 | 130 | 0 |
| Quadrant | Total seconds | Saturated seconds | Saturation percentage |
|---|---|---|---|
| A | 6406 | 51 | 0.796129% |
| B | 6406 | 60 | 0.936622% |
| C | 6406 | 69 | 1.077115% |
| D | 6406 | 155 | 2.419607% |
Noise dominated data is calculated using 1-second bins in cleaned event files. If a bin has >2000 counts, and if more than 50% of those come from <1% of pixels, then it is considered to be noise-dominated and hence unusable.
| Quadrant | # 1 sec bins | Bins with >0 counts | Bins with >2000 counts | High rate bins dominated by noise | Noise dominated (total time) | Noise dominated (detector-on time) | Marked lightcurve |
|---|---|---|---|---|---|---|---|
| A | 7681 | 6407 | 4 | 4 | 0.05% | 0.06% | 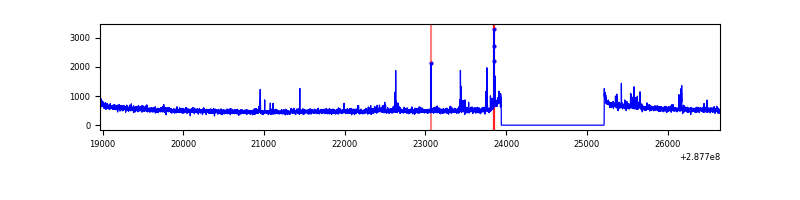 |
| B | 7681 | 6407 | 0 | 0 | 0.00% | 0.00% |  |
| C | 7681 | 6407 | 3 | 3 | 0.04% | 0.05% | 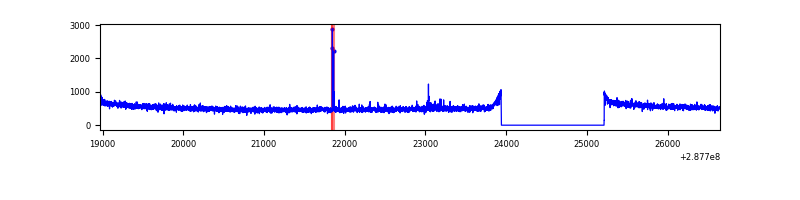 |
| D | 7681 | 6407 | 78 | 78 | 1.02% | 1.22% | 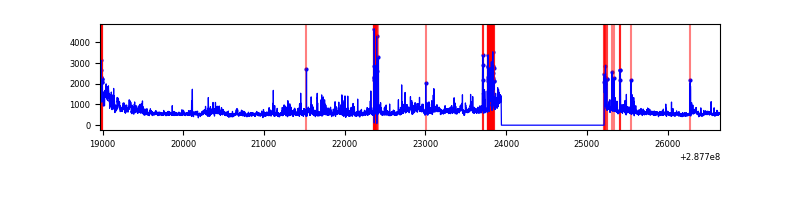 |
Top three noisy pixels from each quadrant. If the there are fewer than three noisy pixels in the level2.evt file, extra rows are filled as -1
| Pixel properties | Quadrant properties | ||||||
|---|---|---|---|---|---|---|---|
| Quadrant | DetID | PixID | Counts | Sigma | Mean | Median | Sigma |
| A | 4 | 2 | 98853 | 575.92 | 856 | 839 | 170.2 |
| A | 15 | 174 | 10301 | 55.6 | 856 | 839 | 170.2 |
| A | 15 | 192 | 8089 | 42.6 | 856 | 839 | 170.2 |
| B | 12 | 111 | 18441 | 109.11 | 858 | 841 | 161.3 |
| B | 11 | 111 | 15942 | 93.62 | 858 | 841 | 161.3 |
| B | 14 | 111 | 13521 | 78.61 | 858 | 841 | 161.3 |
| C | 14 | 238 | 129464 | 682.71 | 812 | 820 | 188.4 |
| C | 0 | 207 | 25706 | 132.07 | 812 | 820 | 188.4 |
| C | 3 | 233 | 6954 | 32.55 | 812 | 820 | 188.4 |
| D | 1 | 52 | 959837 | 4879.66 | 810 | 787 | 196.5 |
| D | 7 | 238 | 277985 | 1410.39 | 810 | 787 | 196.5 |
| D | 13 | 168 | 80024 | 403.16 | 810 | 787 | 196.5 |
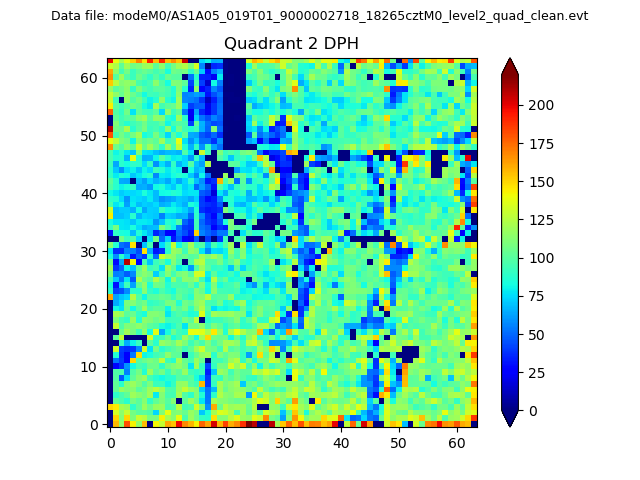
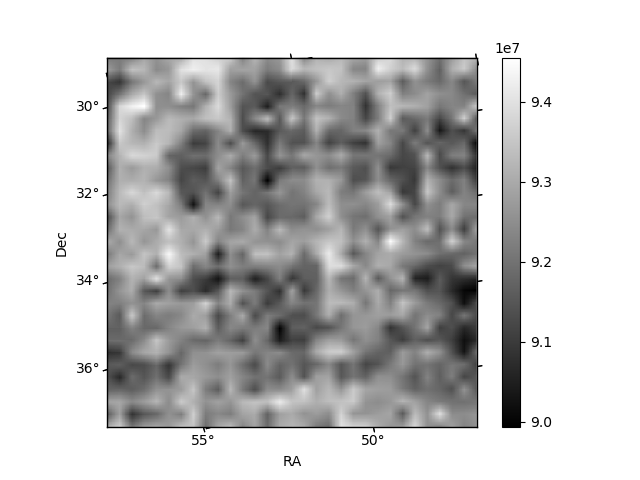
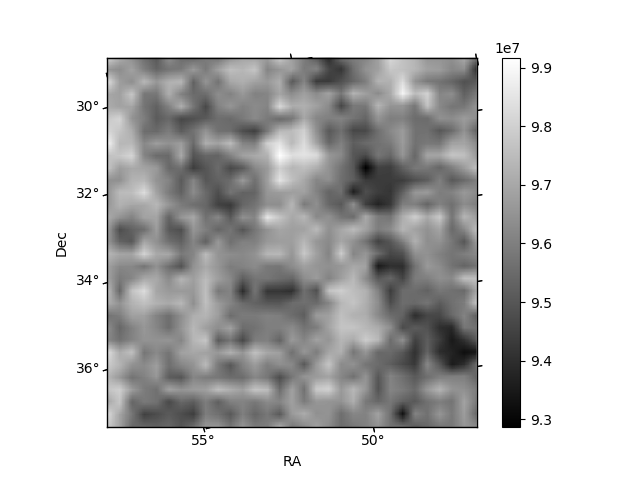
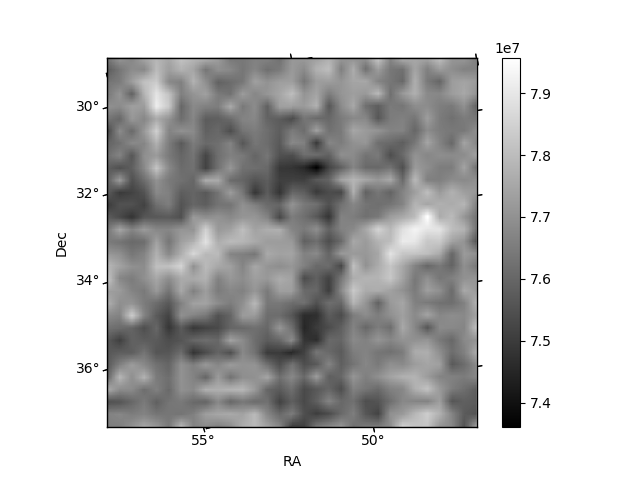
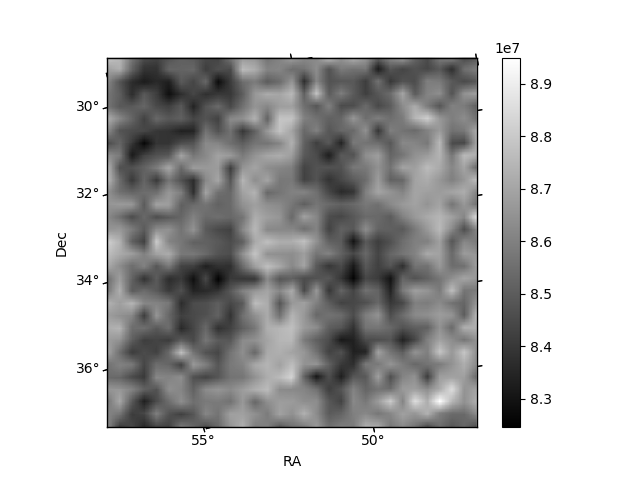
Histogram calculated using DETX and DETY for each event in the final _common_clean file
| Quadrant A | 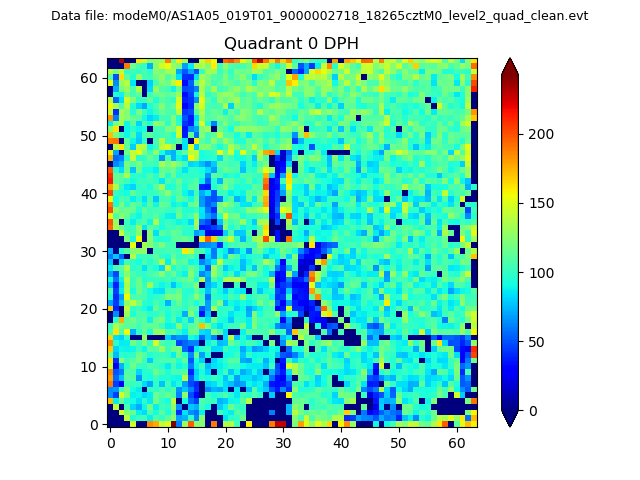 |
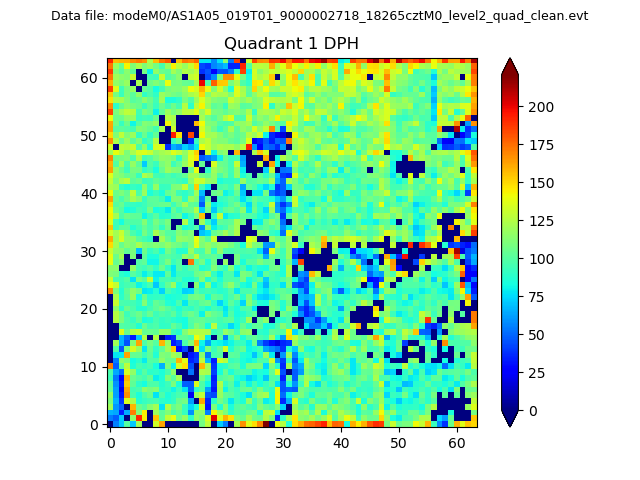 |
Quadrant B |
|---|---|---|---|
| Quadrant D | 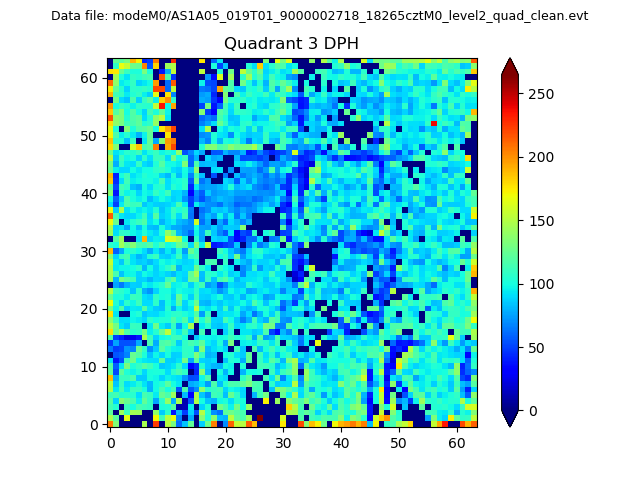 |
 |
Quadrant C |
| Plot type | Count rate plots | Images |
|---|---|---|
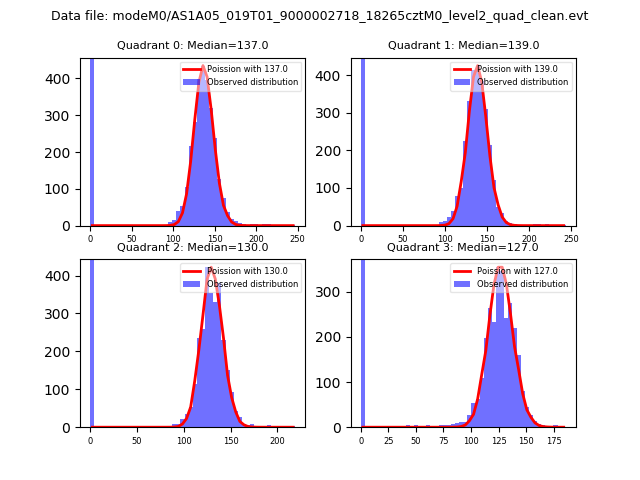
| Comparison with Poisson distribution Blue bars denote a histogram of data divided into 1 sec bins. Red curve is a Poisson curve with rate = median count rate of data. |
 |
 |
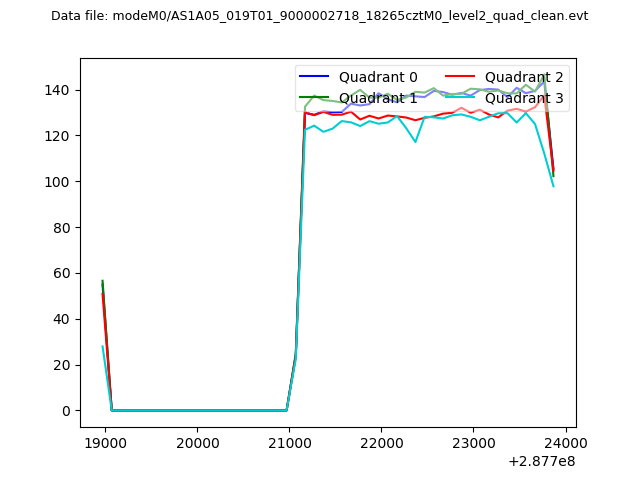
| Quadrant-wise count rates Data is divided into 100 sec bins |
 |
|
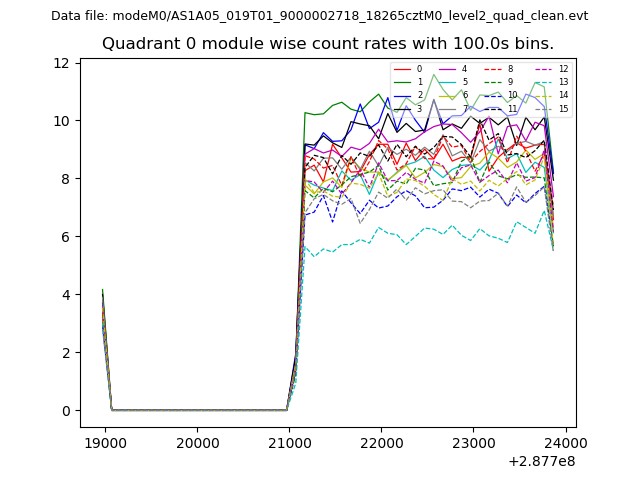
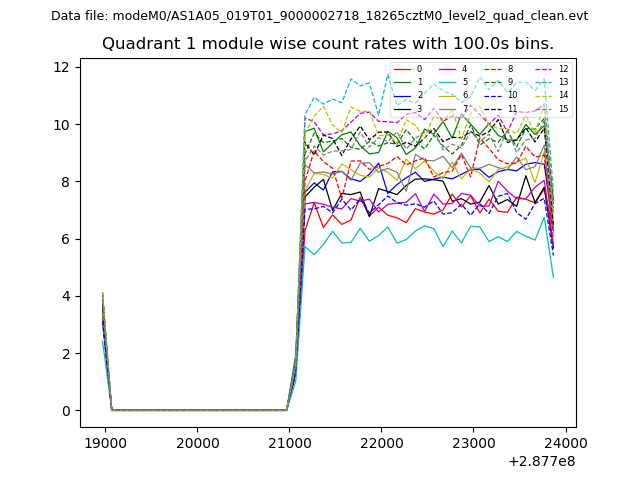
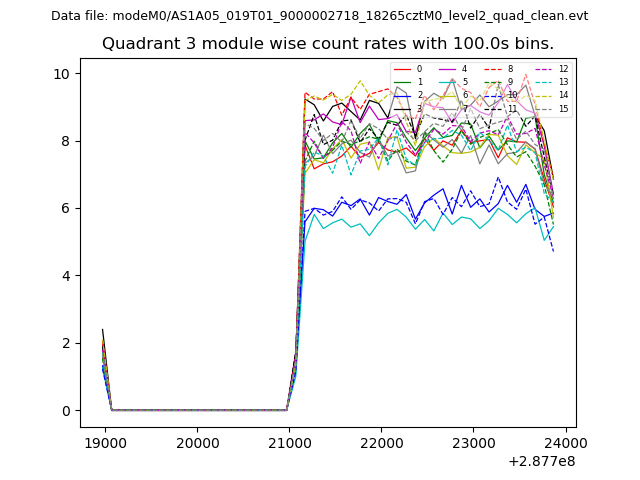
| Module-wise count rates for Quadrant A Data is divided into 100 sec bins |
 |
 |
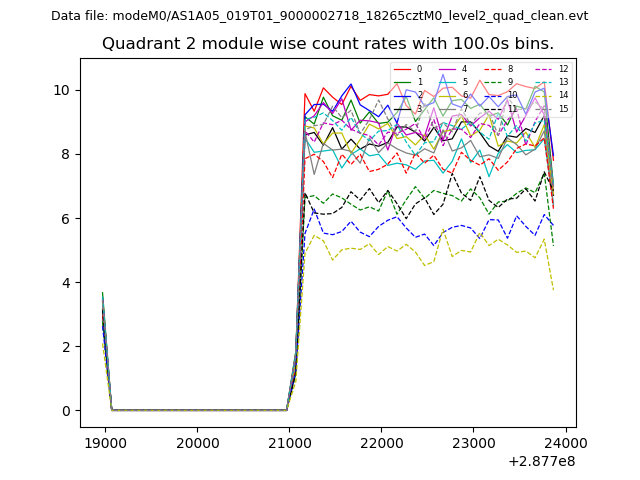
| Module-wise count rates for Quadrant B Data is divided into 100 sec bins |
 |
 |
| Module-wise count rates for Quadrant C Data is divided into 100 sec bins |
 |
 |
| Module-wise count rates for Quadrant D Data is divided into 100 sec bins |
 |
 |
| Parameter | Plot |
|---|---|
| CZT HV Monitor | 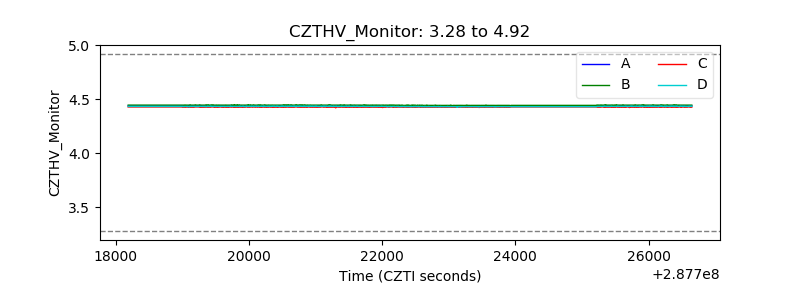 |
| D_VDD | 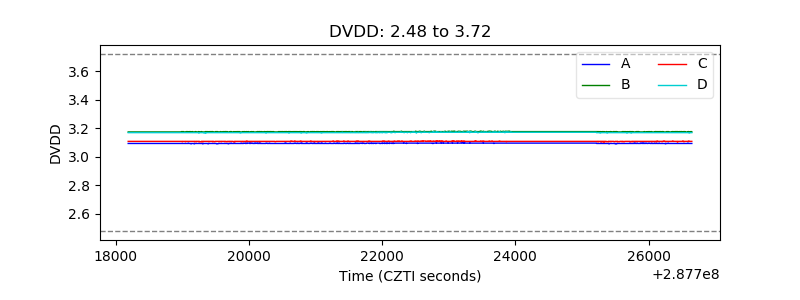 |
| Temperature 1 | 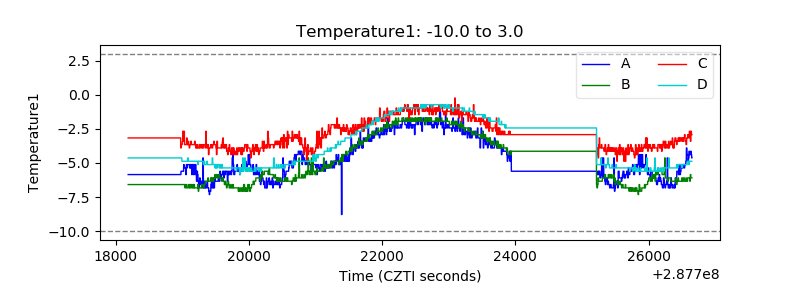 |
| Veto HV Monitor | 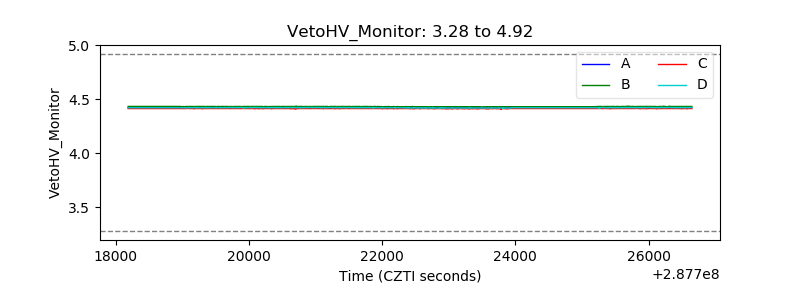 |
| Veto LLD | 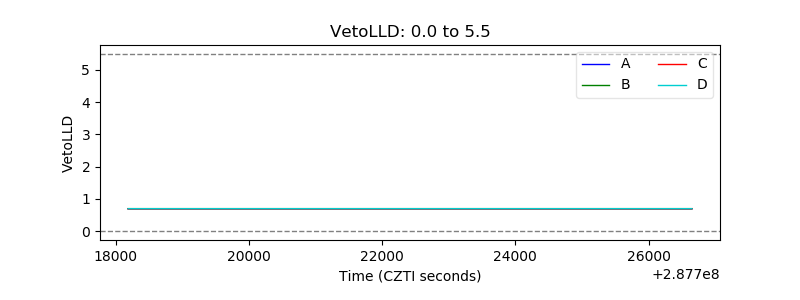 |
| Alpha Counter | 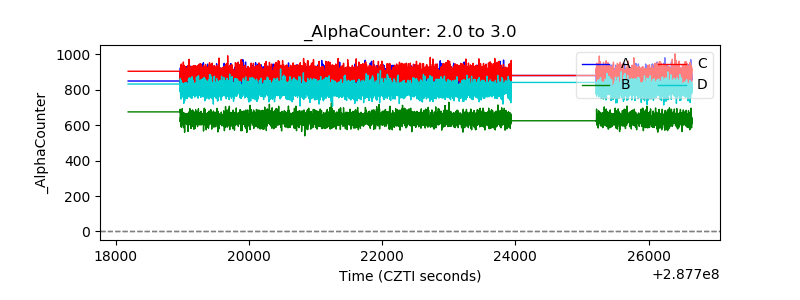 |
| _CPM_Rate | 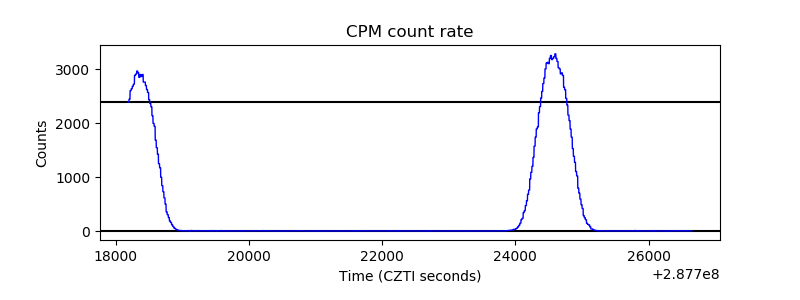 |
| CZT Counter | 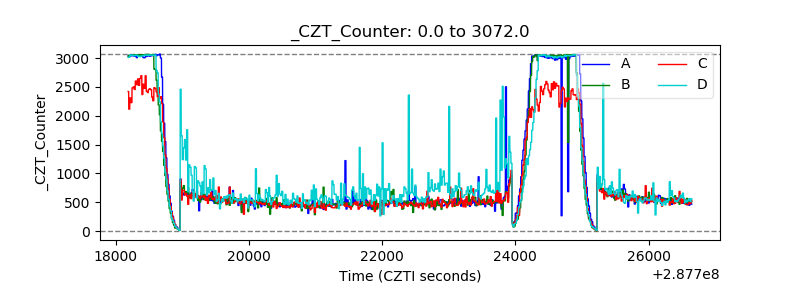 |
| +2.5 Volts monitor | 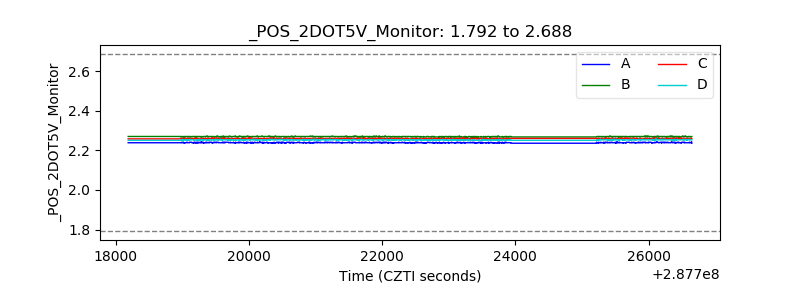 |
| +5 Volts monitor | 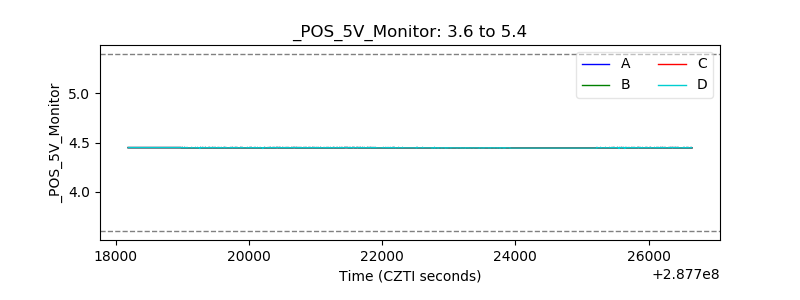 |
| _ROLL_ROT | 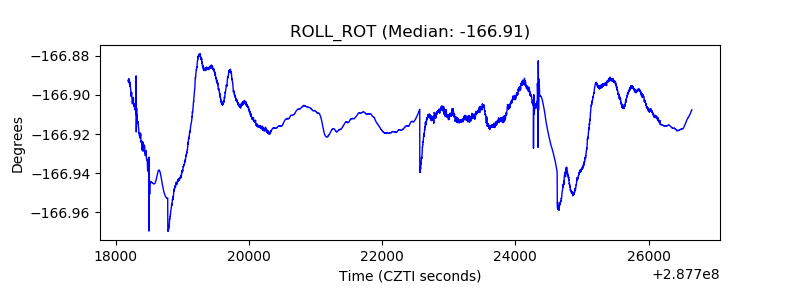 |
| _Roll_DEC | 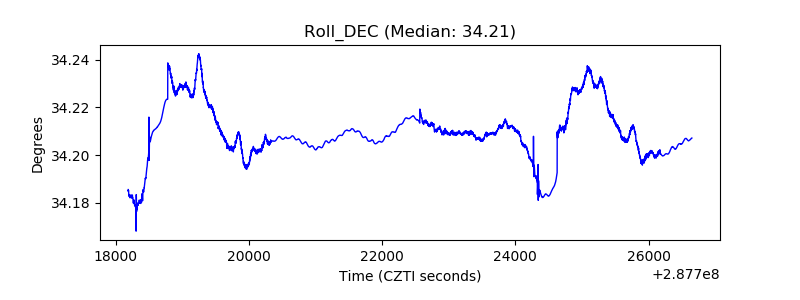 |
| _Roll_RA | 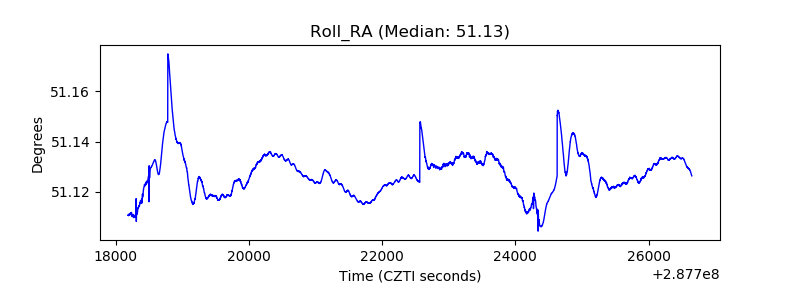 |
| Veto Counter | 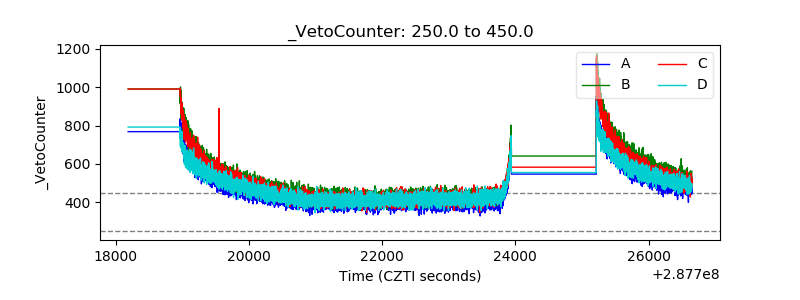 |