| Param | Original file | Final file |
|---|---|---|
| Filename | modeM0/AS1A05_019T01_9000002718_18269cztM0_level2.evt | modeM0/AS1A05_019T01_9000002718_18269cztM0_level2_quad_clean.evt |
| Size (bytes) | 329,783,040 | 69,431,040 |
| Size | 314.5 MB | 66.2 MB |
| Events in quadrant A | 2,036,668 | 472,588 |
| Events in quadrant B | 1,981,537 | 475,291 |
| Events in quadrant C | 1,933,539 | 443,236 |
| Events in quadrant D | 3,758,681 | 424,522 |
| Mode M9 | |||
|---|---|---|---|
| Quadrant | BADHDUFLAG | Total packets | Discarded packets |
| A | 0 | 4 | 0 |
| B | 0 | 5 | 0 |
| C | 0 | 5 | 0 |
| D | 0 | 5 | 0 |
| Mode M0 | |||
|---|---|---|---|
| Quadrant | BADHDUFLAG | Total packets | Discarded packets |
| A | 0 | 8500 | 1 |
| B | 0 | 8453 | 1 |
| C | 0 | 8327 | 1 |
| D | 0 | 14129 | 1 |
| Mode SS | |||
|---|---|---|---|
| Quadrant | BADHDUFLAG | Total packets | Discarded packets |
| A | 0 | 82 | 0 |
| B | 0 | 82 | 0 |
| C | 0 | 82 | 0 |
| D | 0 | 82 | 0 |
| Quadrant | Total seconds | Saturated seconds | Saturation percentage |
|---|---|---|---|
| A | 4063 | 34 | 0.836820% |
| B | 4063 | 18 | 0.443022% |
| C | 4063 | 24 | 0.590697% |
| D | 4063 | 262 | 6.448437% |
Noise dominated data is calculated using 1-second bins in cleaned event files. If a bin has >2000 counts, and if more than 50% of those come from <1% of pixels, then it is considered to be noise-dominated and hence unusable.
| Quadrant | # 1 sec bins | Bins with >0 counts | Bins with >2000 counts | High rate bins dominated by noise | Noise dominated (total time) | Noise dominated (detector-on time) | Marked lightcurve |
|---|---|---|---|---|---|---|---|
| A | 4063 | 4063 | 14 | 14 | 0.34% | 0.34% | 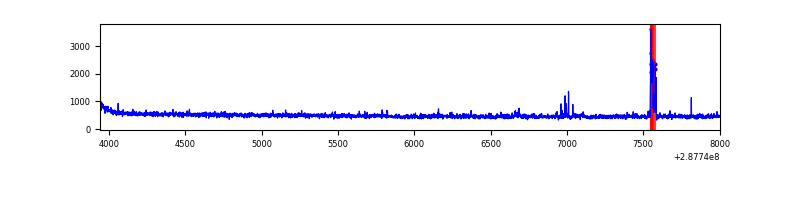 |
| B | 4063 | 4063 | 1 | 1 | 0.02% | 0.02% | 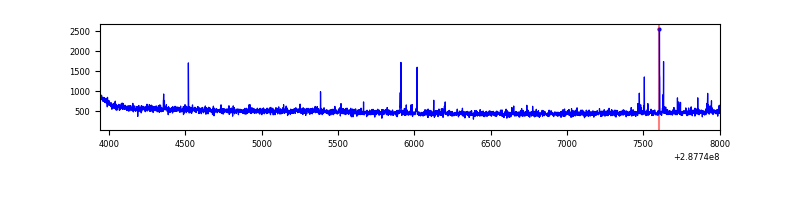 |
| C | 4063 | 4063 | 0 | 0 | 0.00% | 0.00% | 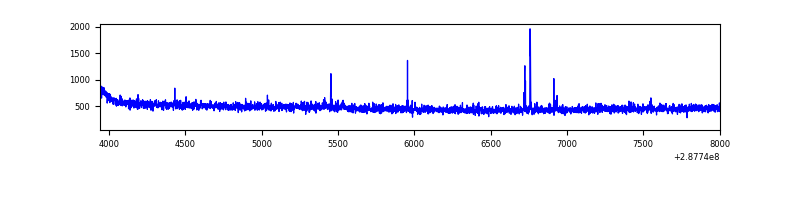 |
| D | 4063 | 4063 | 200 | 200 | 4.92% | 4.92% | 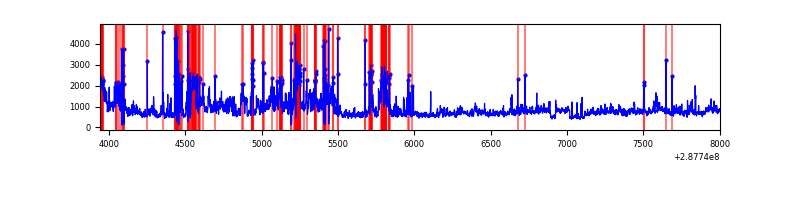 |
Top three noisy pixels from each quadrant. If the there are fewer than three noisy pixels in the level2.evt file, extra rows are filled as -1
| Pixel properties | Quadrant properties | ||||||
|---|---|---|---|---|---|---|---|
| Quadrant | DetID | PixID | Counts | Sigma | Mean | Median | Sigma |
| A | 15 | 174 | 57374 | 561.58 | 504 | 495 | 101.3 |
| A | 4 | 2 | 26089 | 252.69 | 504 | 495 | 101.3 |
| A | 12 | 16 | 9516 | 89.07 | 504 | 495 | 101.3 |
| B | 7 | 220 | 14849 | 150.63 | 498 | 487 | 95.3 |
| B | 4 | 216 | 14289 | 144.76 | 498 | 487 | 95.3 |
| B | 12 | 111 | 10515 | 105.18 | 498 | 487 | 95.3 |
| C | 14 | 238 | 73484 | 666.87 | 469 | 473 | 109.5 |
| C | 0 | 207 | 14746 | 130.37 | 469 | 473 | 109.5 |
| C | 3 | 233 | 14681 | 129.77 | 469 | 473 | 109.5 |
| D | 1 | 52 | 1184246 | 10356.08 | 468 | 454 | 114.3 |
| D | 7 | 238 | 617922 | 5401.75 | 468 | 454 | 114.3 |
| D | 13 | 168 | 147484 | 1286.25 | 468 | 454 | 114.3 |
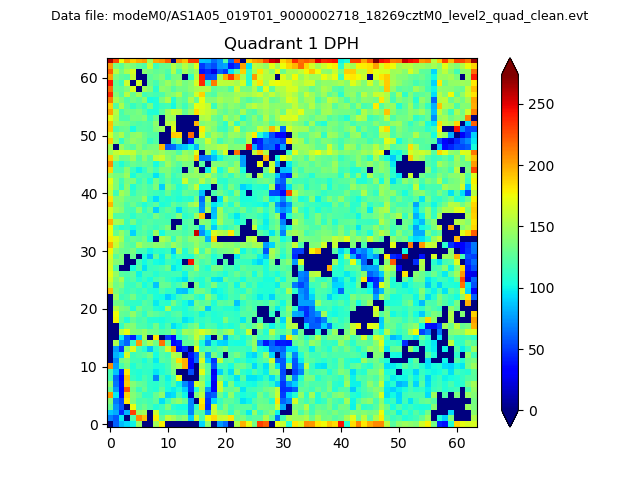
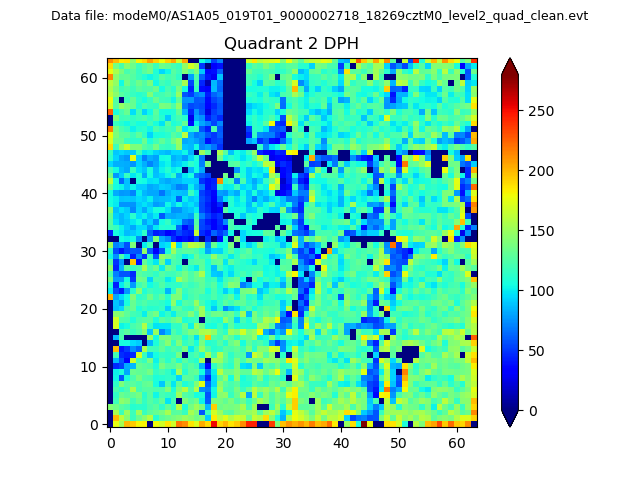
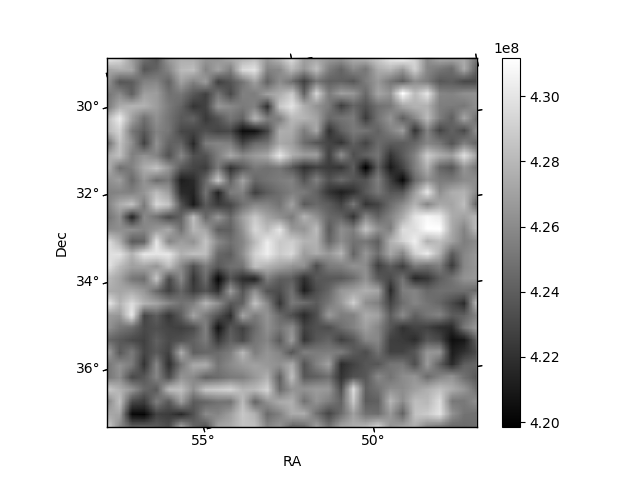
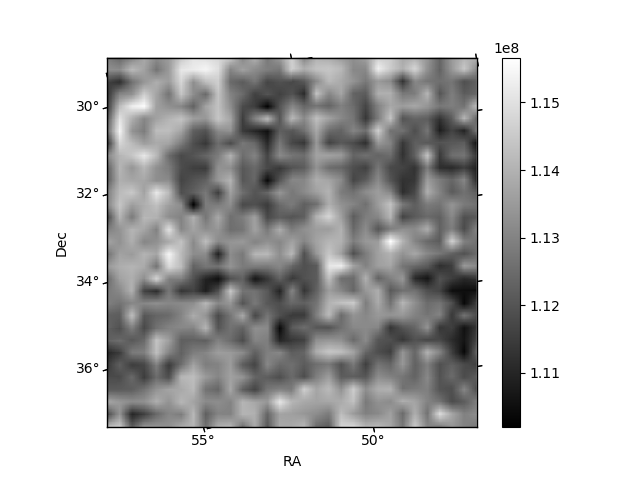
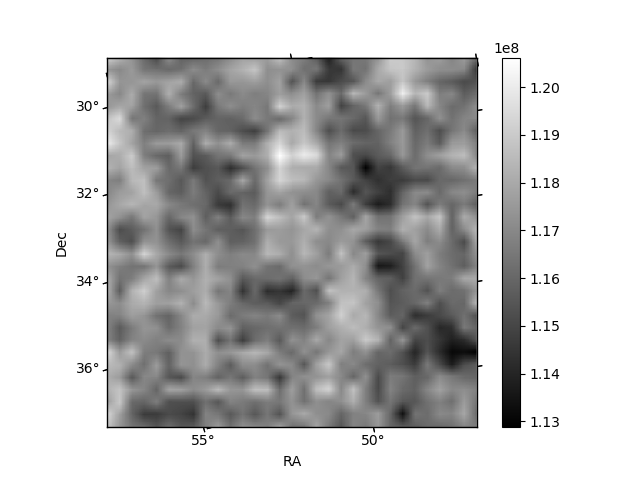
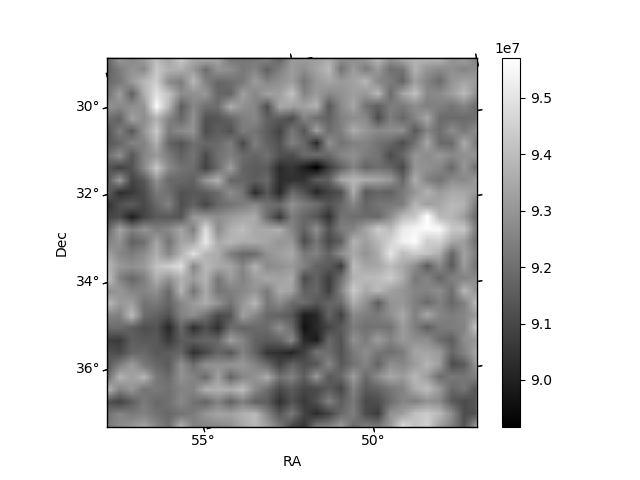
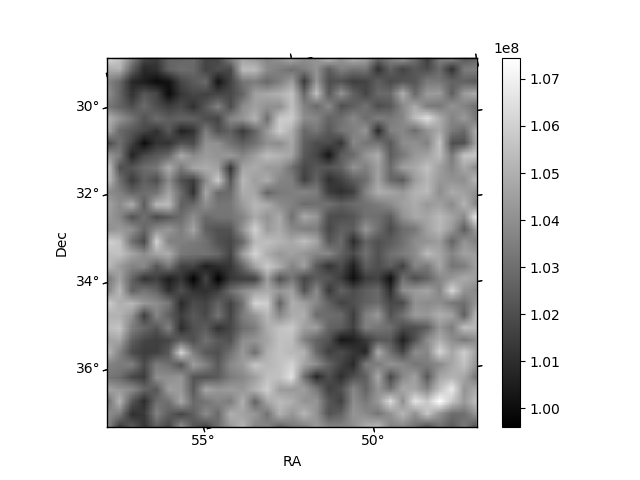
Histogram calculated using DETX and DETY for each event in the final _common_clean file
| Quadrant A |  |
 |
Quadrant B |
|---|---|---|---|
| Quadrant D | 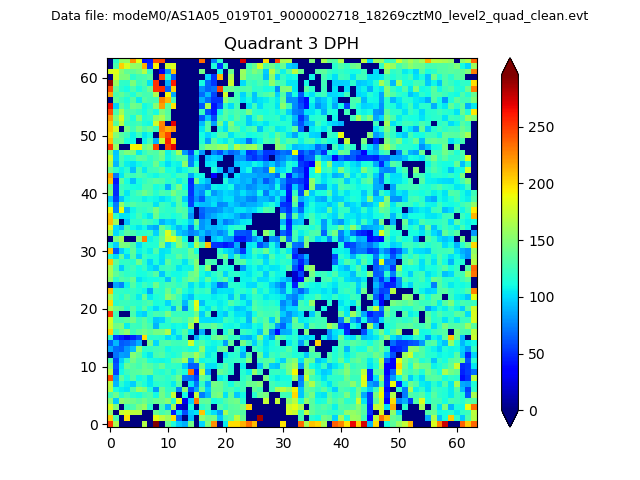 |
 |
Quadrant C |
| Plot type | Count rate plots | Images |
|---|---|---|
| Comparison with Poisson distribution Blue bars denote a histogram of data divided into 1 sec bins. Red curve is a Poisson curve with rate = median count rate of data. |
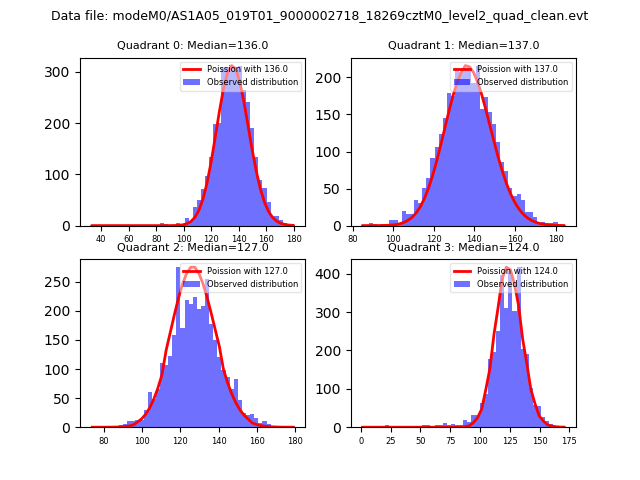 |
 |
| Quadrant-wise count rates Data is divided into 100 sec bins |
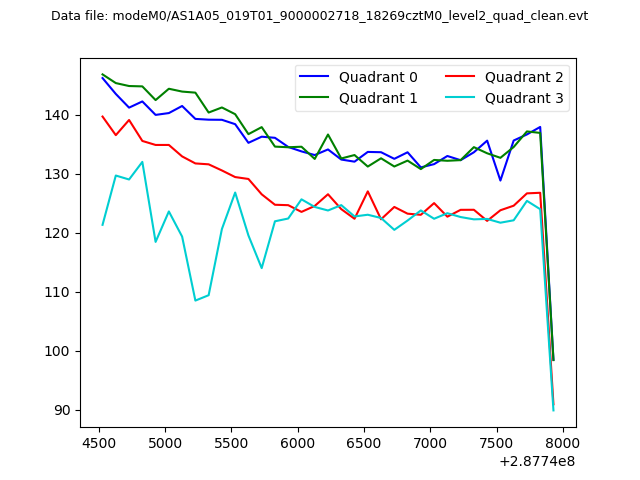 |
|
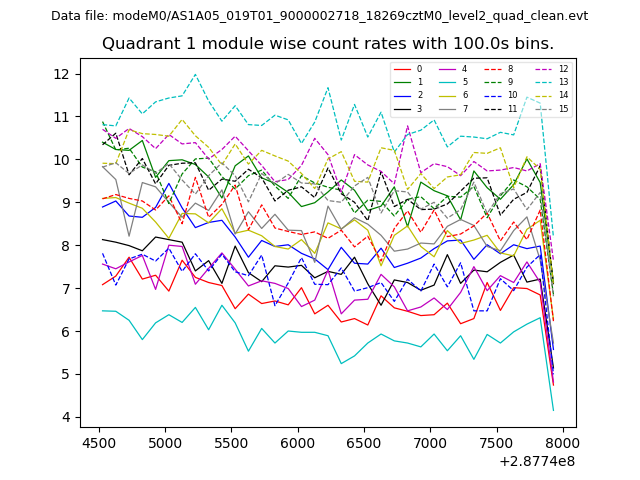
| Module-wise count rates for Quadrant A Data is divided into 100 sec bins |
 |
 |
| Module-wise count rates for Quadrant B Data is divided into 100 sec bins |
 |
 |
| Module-wise count rates for Quadrant C Data is divided into 100 sec bins |
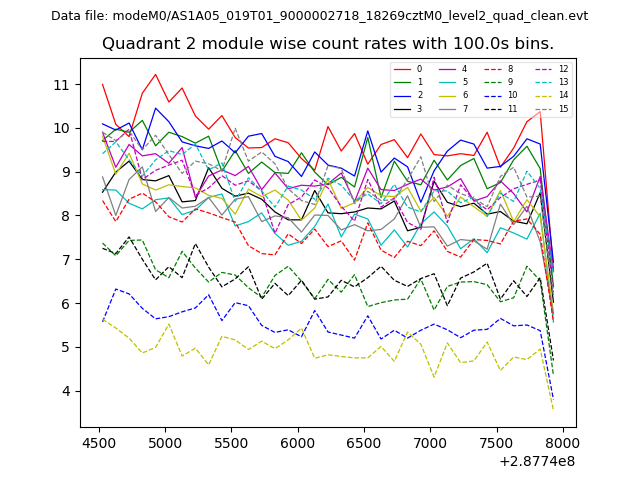 |
 |
| Module-wise count rates for Quadrant D Data is divided into 100 sec bins |
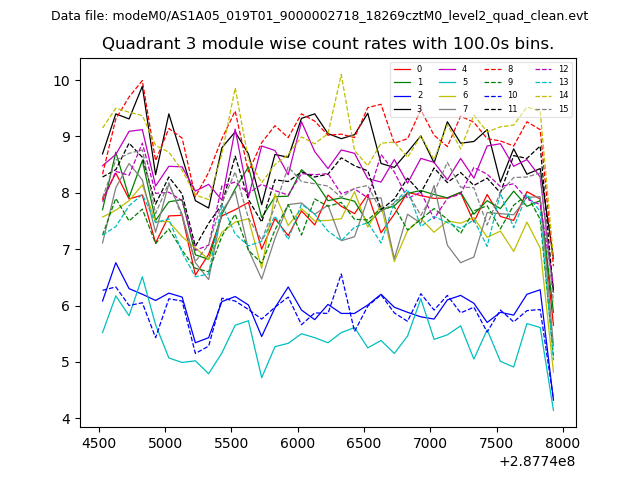 |
 |
| Parameter | Plot |
|---|---|
| CZT HV Monitor |  |
| D_VDD | 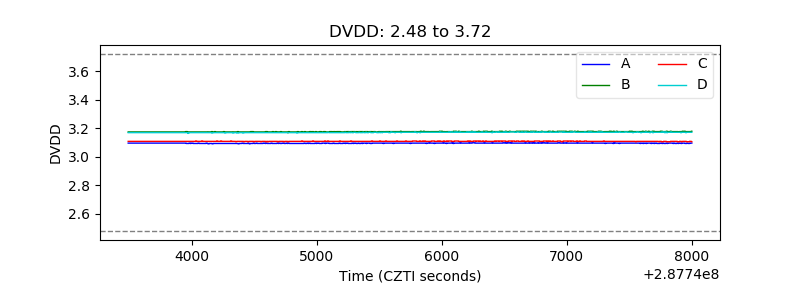 |
| Temperature 1 | 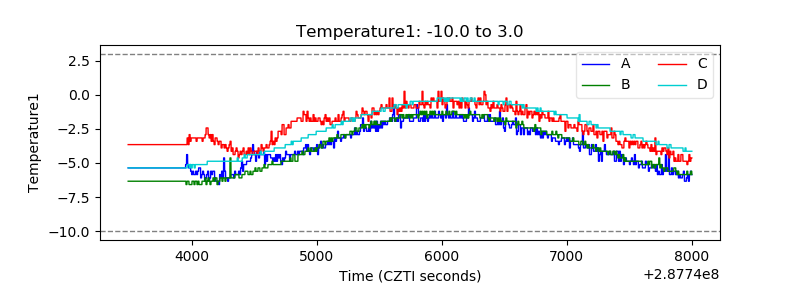 |
| Veto HV Monitor | 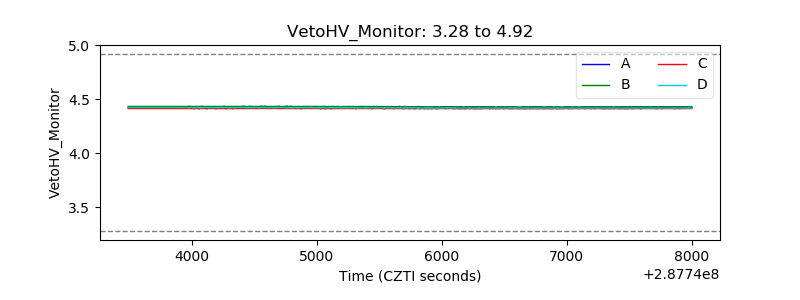 |
| Veto LLD | 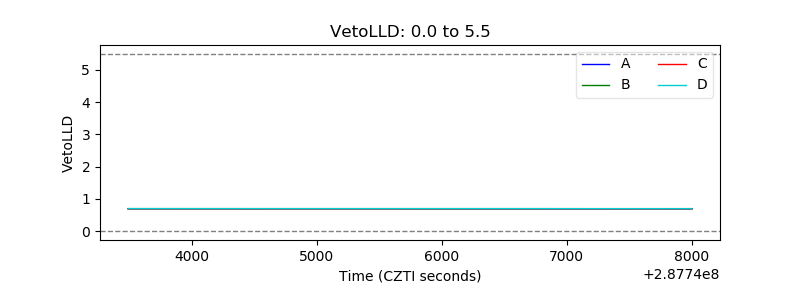 |
| Alpha Counter | 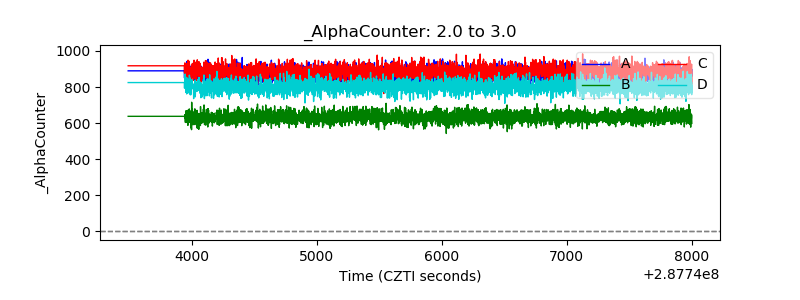 |
| _CPM_Rate | 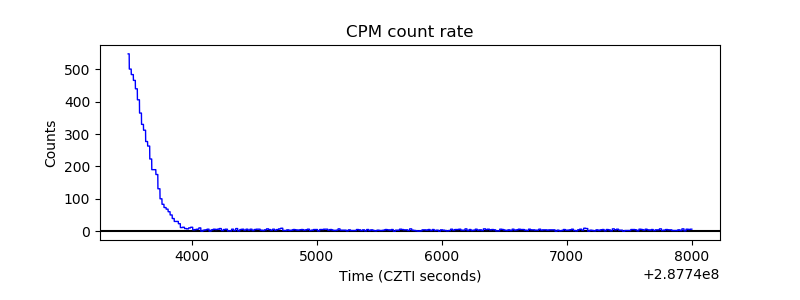 |
| CZT Counter |  |
| +2.5 Volts monitor |  |
| +5 Volts monitor |  |
| _ROLL_ROT |  |
| _Roll_DEC | 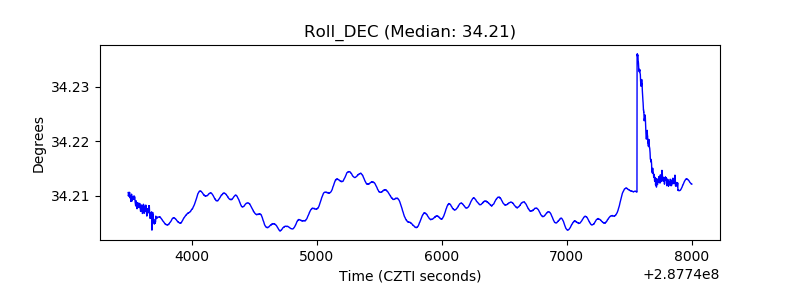 |
| _Roll_RA | 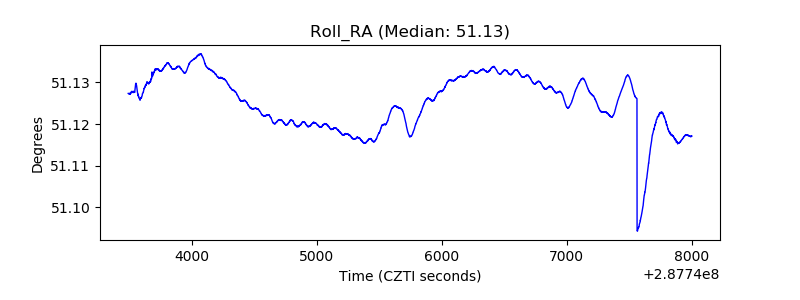 |
| Veto Counter | 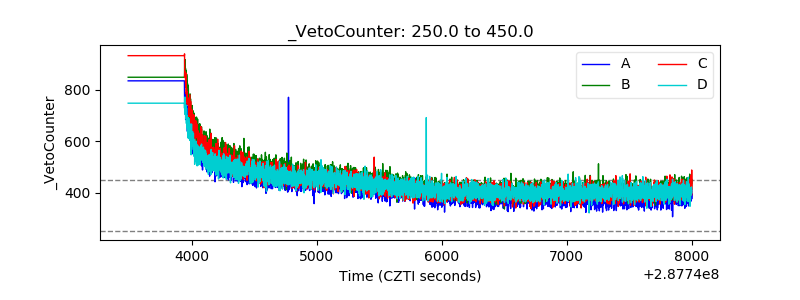 |