| Param | Original file | Final file |
|---|---|---|
| Filename | modeM0/AS1A06_006T01_9000002720cztM0_level2.fits | modeM0/AS1A06_006T01_9000002720cztM0_level2_quad_clean.evt |
| Size (bytes) | 4,724,475,840 | 4,433,040,000 |
| Size | 4.4 GB | 4.1 GB |
| Events in quadrant A | 29,252,234 | 26,771,262 |
| Events in quadrant B | 28,029,914 | 26,514,074 |
| Events in quadrant C | 28,669,582 | 25,846,448 |
| Events in quadrant D | 23,980,144 | 21,990,974 |
| Mode SS | |||
|---|---|---|---|
| Quadrant | BADHDUFLAG | Total packets | Discarded packets |
| A | 0 | 9862 | 0 |
| B | 0 | 9862 | 0 |
| C | 0 | 9862 | 0 |
| D | 0 | 9862 | 0 |
| Mode M9 | |||
|---|---|---|---|
| Quadrant | BADHDUFLAG | Total packets | Discarded packets |
| A | 0 | 769 | 0 |
| B | 0 | 769 | 0 |
| C | 0 | 769 | 0 |
| D | 0 | 769 | 0 |
| Mode M0 | |||
|---|---|---|---|
| Quadrant | BADHDUFLAG | Total packets | Discarded packets |
| A | 0 | 1020840 | 0 |
| B | 0 | 1055504 | 0 |
| C | 0 | 1032663 | 0 |
| D | 0 | 1527541 | 0 |
| Quadrant | Total seconds | Saturated seconds | Saturation percentage |
|---|---|---|---|
| A | 483893 | 6505 | 1.344305% |
| B | 483893 | 7694 | 1.590021% |
| C | 483892 | 8655 | 1.788622% |
| D | 483892 | 39531 | 8.169385% |
Noise dominated data is calculated using 1-second bins in cleaned event files. If a bin has >2000 counts, and if more than 50% of those come from <1% of pixels, then it is considered to be noise-dominated and hence unusable.
| Quadrant | # 1 sec bins | Bins with >0 counts | Bins with >2000 counts | High rate bins dominated by noise | Noise dominated (total time) | Noise dominated (detector-on time) | Marked lightcurve |
|---|---|---|---|---|---|---|---|
| A | 560544 | 483886 | 0 | 0 | 0.00% | 0.00% |  |
| B | 560544 | 483885 | 0 | 0 | 0.00% | 0.00% |  |
| C | 560544 | 483885 | 0 | 0 | 0.00% | 0.00% |  |
| D | 560544 | 483536 | 0 | 0 | 0.00% | 0.00% |  |
Top three noisy pixels from each quadrant. If the there are fewer than three noisy pixels in the level2.evt file, extra rows are filled as -1
| Pixel properties | Quadrant properties | ||||||
|---|---|---|---|---|---|---|---|
| Quadrant | DetID | PixID | Counts | Sigma | Mean | Median | Sigma |
| A | 0 | 29 | 28056 | 11.22 | 7620 | 7145 | 1863.5 |
| A | 7 | 110 | 23784 | 8.93 | 7620 | 7145 | 1863.5 |
| A | 0 | 30 | 22906 | 8.46 | 7620 | 7145 | 1863.5 |
| B | 2 | 9 | 22797 | 10.91 | 7425 | 7085 | 1440.5 |
| B | 2 | 8 | 18955 | 8.24 | 7425 | 7085 | 1440.5 |
| B | 5 | 232 | 18281 | 7.77 | 7425 | 7085 | 1440.5 |
| C | 1 | 80 | 21875 | 7.7 | 7566 | 7052 | 1925.5 |
| C | 1 | 81 | 21502 | 7.5 | 7566 | 7052 | 1925.5 |
| C | 12 | 241 | 19914 | 6.68 | 7566 | 7052 | 1925.5 |
| D | 10 | 190 | 18023 | 6.53 | 6858 | 6243 | 1804.9 |
| D | 3 | 14 | 17586 | 6.28 | 6858 | 6243 | 1804.9 |
| D | 6 | 231 | 17229 | 6.09 | 6858 | 6243 | 1804.9 |
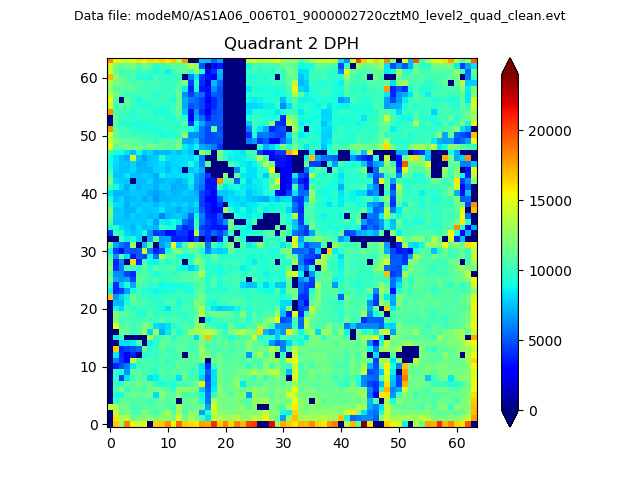
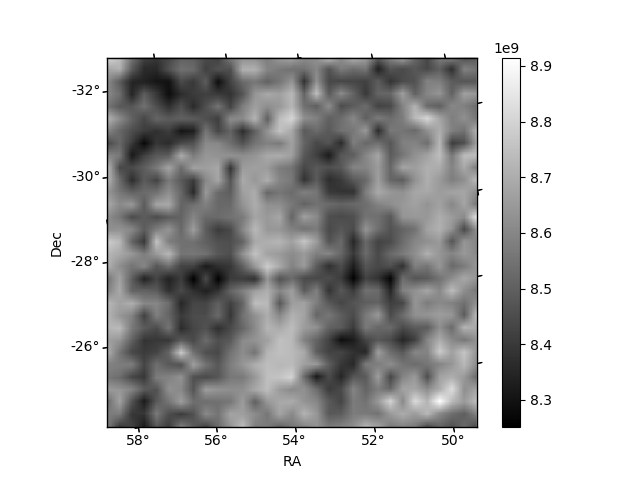
Histogram calculated using DETX and DETY for each event in the final _common_clean file
| Quadrant A |  |
 |
Quadrant B |
|---|---|---|---|
| Quadrant D |  |
 |
Quadrant C |
| Plot type | Count rate plots | Images |
|---|---|---|
| Comparison with Poisson distribution Blue bars denote a histogram of data divided into 1 sec bins. Red curve is a Poisson curve with rate = median count rate of data. |
 |
 |
| Quadrant-wise count rates Data is divided into 100 sec bins |
 |
|
| Module-wise count rates for Quadrant A Data is divided into 100 sec bins |
 |
 |
| Module-wise count rates for Quadrant B Data is divided into 100 sec bins |
 |
 |
| Module-wise count rates for Quadrant C Data is divided into 100 sec bins |
 |
 |
| Module-wise count rates for Quadrant D Data is divided into 100 sec bins |
 |
 |
| Parameter | Plot |
|---|---|
| CZT HV Monitor |  |
| D_VDD | 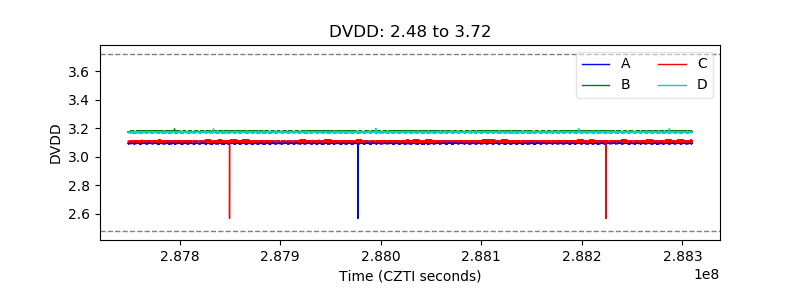 |
| Temperature 1 |  |
| Veto HV Monitor |  |
| Veto LLD | 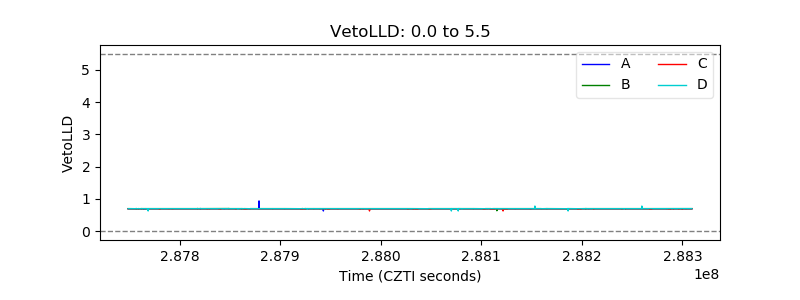 |
| Alpha Counter |  |
| _CPM_Rate |  |
| CZT Counter |  |
| +2.5 Volts monitor |  |
| +5 Volts monitor |  |
| _ROLL_ROT |  |
| _Roll_DEC |  |
| _Roll_RA | 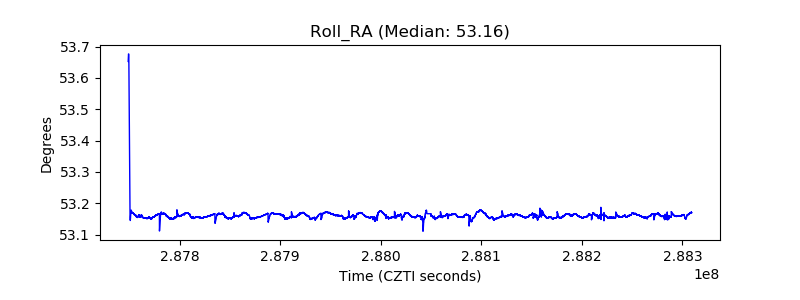 |
| Veto Counter | 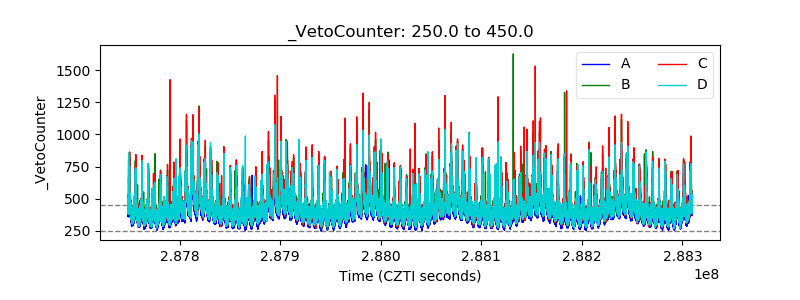 |