| Param | Original file | Final file |
|---|---|---|
| Filename | modeM0/AS1A06_006T01_9000002720_18269cztM0_level2.evt | modeM0/AS1A06_006T01_9000002720_18269cztM0_level2_quad_clean.evt |
| Size (bytes) | 169,277,760 | 22,855,680 |
| Size | 161.4 MB | 21.8 MB |
| Events in quadrant A | 1,068,629 | 139,639 |
| Events in quadrant B | 1,073,321 | 142,290 |
| Events in quadrant C | 1,049,811 | 136,781 |
| Events in quadrant D | 1,800,740 | 131,465 |
| Mode SS | |||
|---|---|---|---|
| Quadrant | BADHDUFLAG | Total packets | Discarded packets |
| A | 0 | 42 | 0 |
| B | 0 | 42 | 0 |
| C | 0 | 42 | 0 |
| D | 0 | 42 | 0 |
| Mode M9 | |||
|---|---|---|---|
| Quadrant | BADHDUFLAG | Total packets | Discarded packets |
| A | 0 | 9 | 0 |
| B | 0 | 9 | 0 |
| C | 0 | 9 | 0 |
| D | 0 | 9 | 0 |
| Mode M0 | |||
|---|---|---|---|
| Quadrant | BADHDUFLAG | Total packets | Discarded packets |
| A | 0 | 4259 | 1 |
| B | 0 | 4286 | 1 |
| C | 0 | 4227 | 1 |
| D | 0 | 6750 | 1 |
| Quadrant | Total seconds | Saturated seconds | Saturation percentage |
|---|---|---|---|
| A | 1935 | 130 | 6.718346% |
| B | 1935 | 127 | 6.563307% |
| C | 1934 | 139 | 7.187177% |
| D | 1934 | 185 | 9.565667% |
Noise dominated data is calculated using 1-second bins in cleaned event files. If a bin has >2000 counts, and if more than 50% of those come from <1% of pixels, then it is considered to be noise-dominated and hence unusable.
| Quadrant | # 1 sec bins | Bins with >0 counts | Bins with >2000 counts | High rate bins dominated by noise | Noise dominated (total time) | Noise dominated (detector-on time) | Marked lightcurve |
|---|---|---|---|---|---|---|---|
| A | 2840 | 1936 | 0 | 0 | 0.00% | 0.00% | 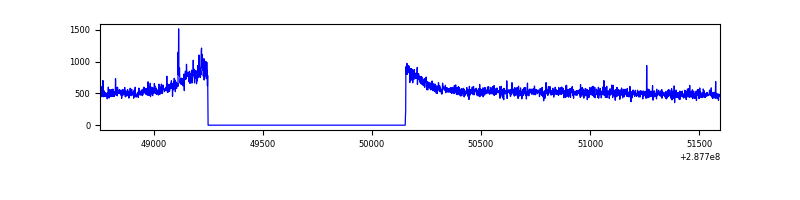 |
| B | 2840 | 1936 | 1 | 1 | 0.04% | 0.05% | 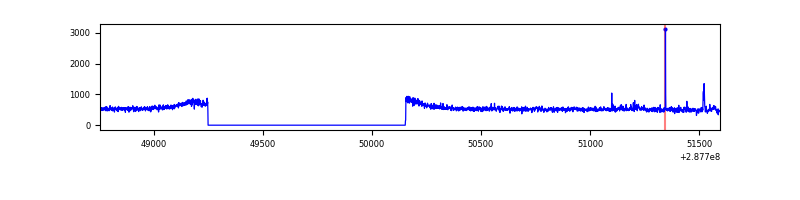 |
| C | 2839 | 1935 | 0 | 0 | 0.00% | 0.00% | 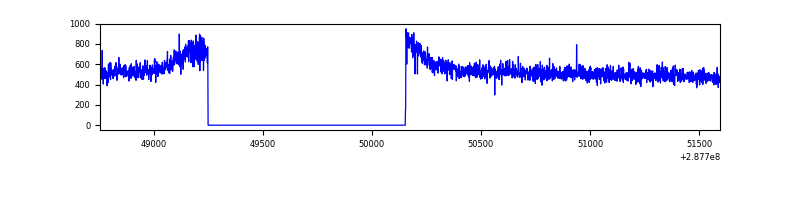 |
| D | 2839 | 1935 | 9 | 9 | 0.32% | 0.47% | 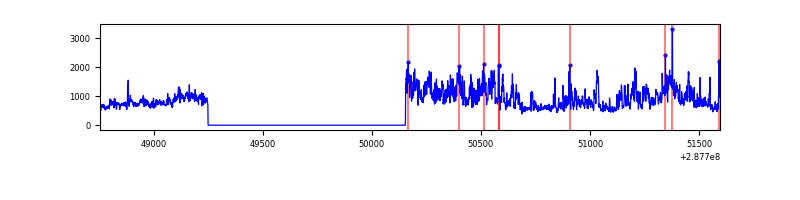 |
Top three noisy pixels from each quadrant. If the there are fewer than three noisy pixels in the level2.evt file, extra rows are filled as -1
| Pixel properties | Quadrant properties | ||||||
|---|---|---|---|---|---|---|---|
| Quadrant | DetID | PixID | Counts | Sigma | Mean | Median | Sigma |
| A | 15 | 174 | 14708 | 252.25 | 272 | 265 | 57.3 |
| A | 4 | 2 | 5445 | 90.47 | 272 | 265 | 57.3 |
| A | 0 | 226 | 2408 | 37.43 | 272 | 265 | 57.3 |
| B | 7 | 220 | 6853 | 121.25 | 268 | 261 | 54.4 |
| B | 12 | 111 | 6410 | 113.1 | 268 | 261 | 54.4 |
| B | 11 | 111 | 5777 | 101.46 | 268 | 261 | 54.4 |
| C | 14 | 238 | 39565 | 637.47 | 258 | 258 | 61.7 |
| C | 13 | 61 | 1889 | 26.45 | 258 | 258 | 61.7 |
| C | 3 | 233 | 981 | 11.73 | 258 | 258 | 61.7 |
| D | 7 | 238 | 519228 | 7894.84 | 262 | 253 | 65.7 |
| D | 1 | 52 | 238050 | 3617.46 | 262 | 253 | 65.7 |
| D | 13 | 168 | 33693 | 508.7 | 262 | 253 | 65.7 |
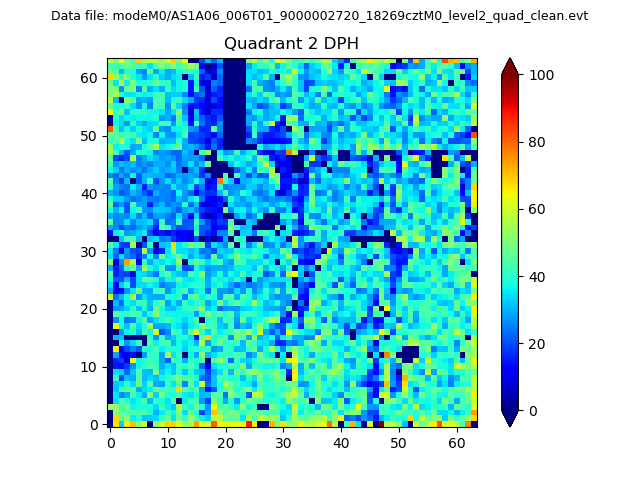
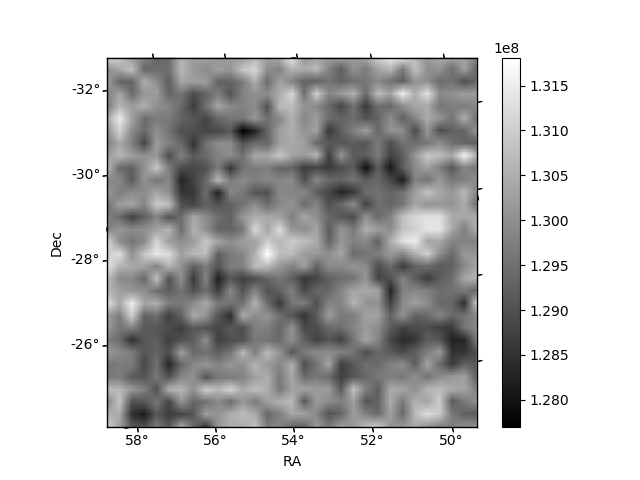
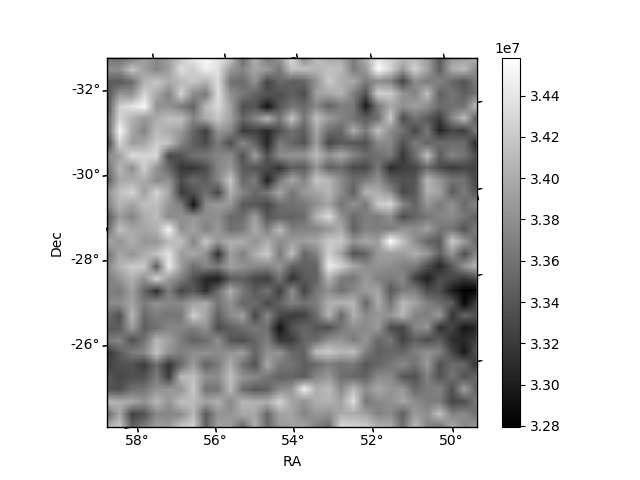
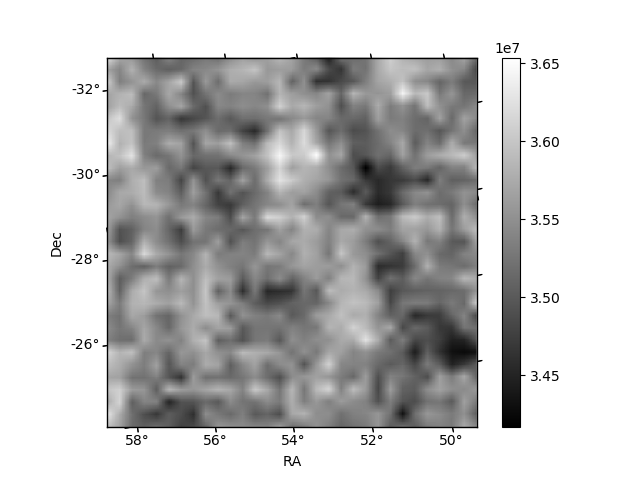
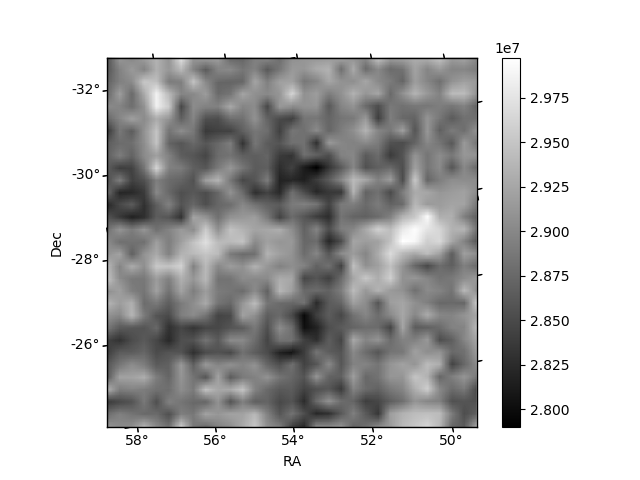
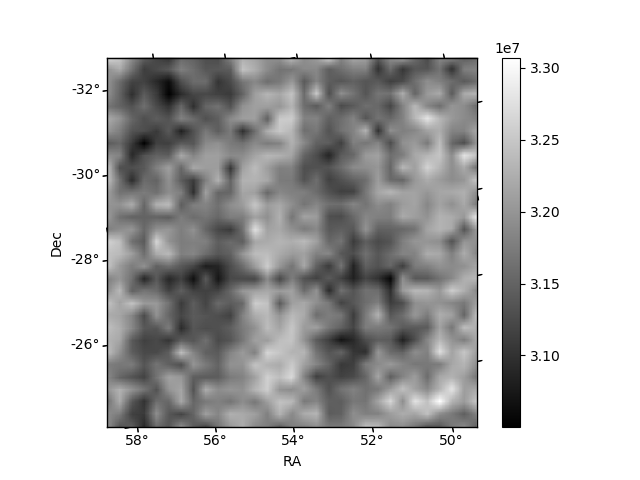
Histogram calculated using DETX and DETY for each event in the final _common_clean file
| Quadrant A | 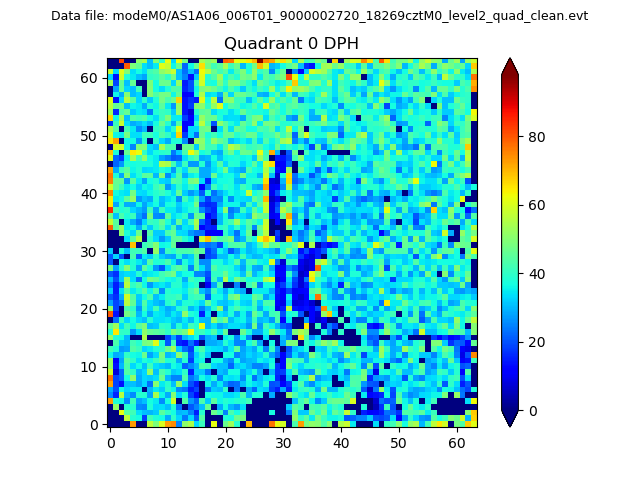 |
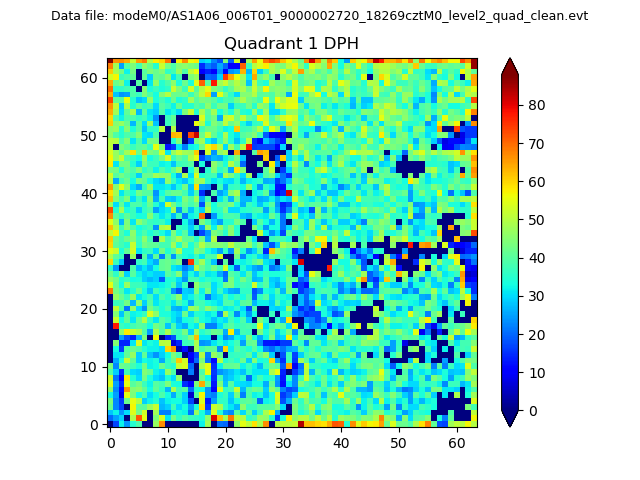 |
Quadrant B |
|---|---|---|---|
| Quadrant D | 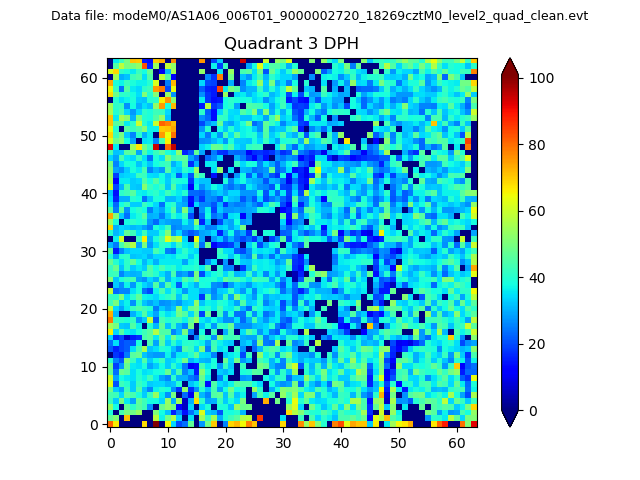 |
 |
Quadrant C |
| Plot type | Count rate plots | Images |
|---|---|---|
| Comparison with Poisson distribution Blue bars denote a histogram of data divided into 1 sec bins. Red curve is a Poisson curve with rate = median count rate of data. |
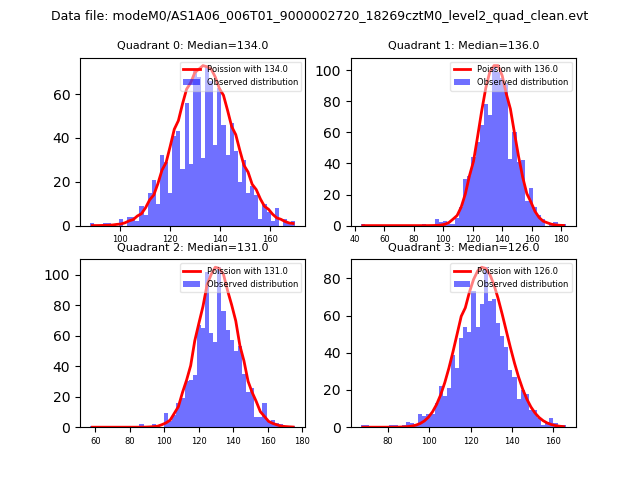 |
 |
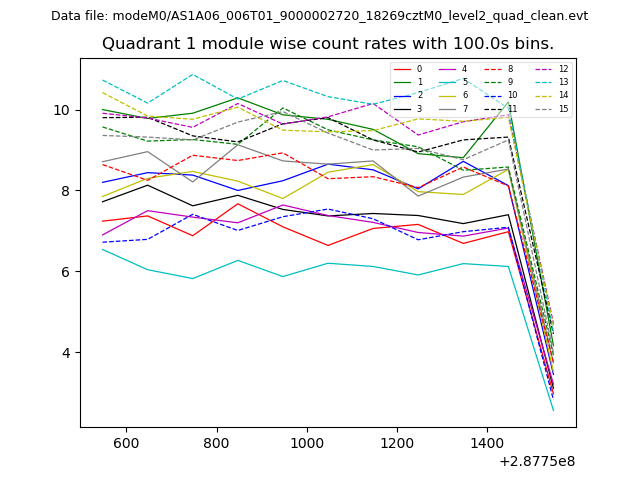
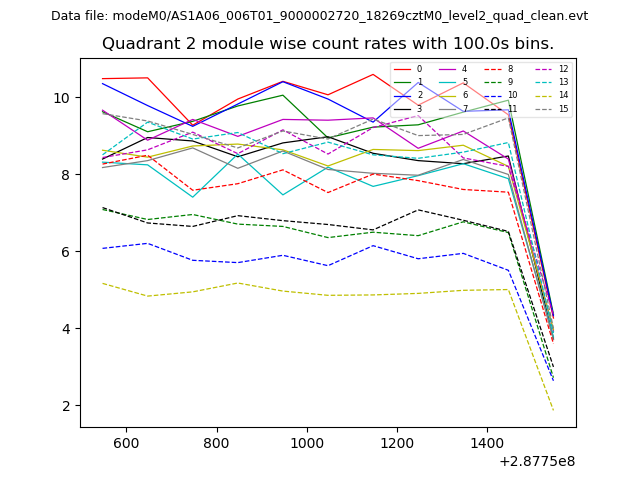
| Quadrant-wise count rates Data is divided into 100 sec bins |
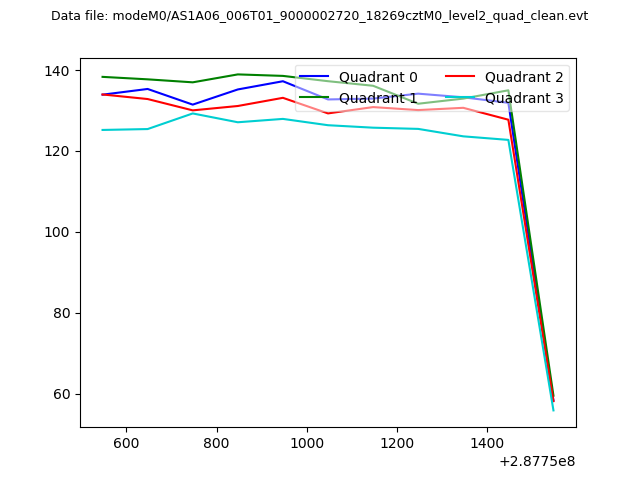 |
|
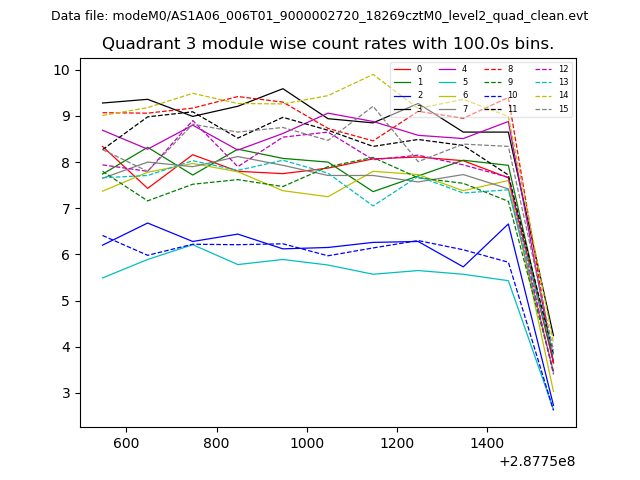
| Module-wise count rates for Quadrant A Data is divided into 100 sec bins |
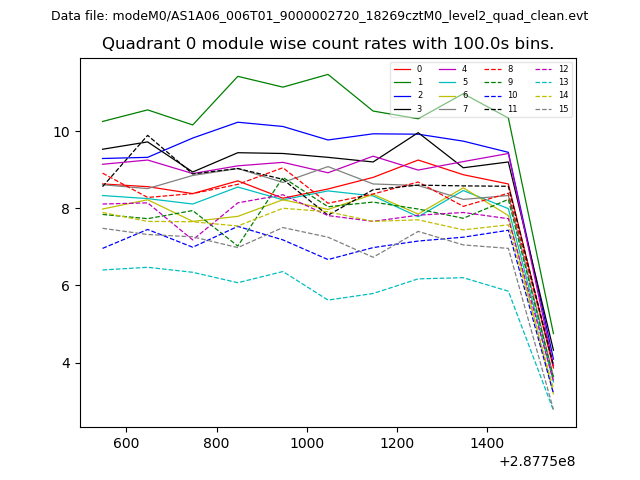 |
 |
| Module-wise count rates for Quadrant B Data is divided into 100 sec bins |
 |
 |
| Module-wise count rates for Quadrant C Data is divided into 100 sec bins |
 |
 |
| Module-wise count rates for Quadrant D Data is divided into 100 sec bins |
 |
 |
| Parameter | Plot |
|---|---|
| CZT HV Monitor |  |
| D_VDD | 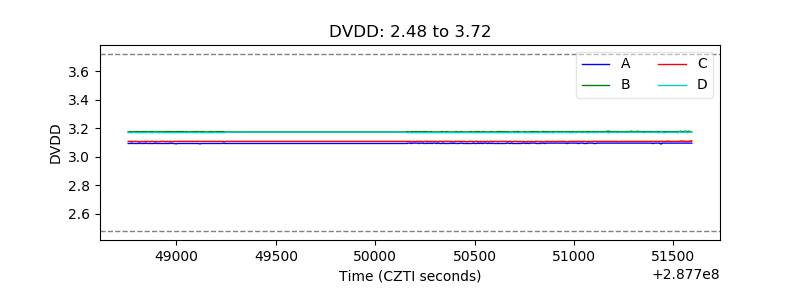 |
| Temperature 1 | 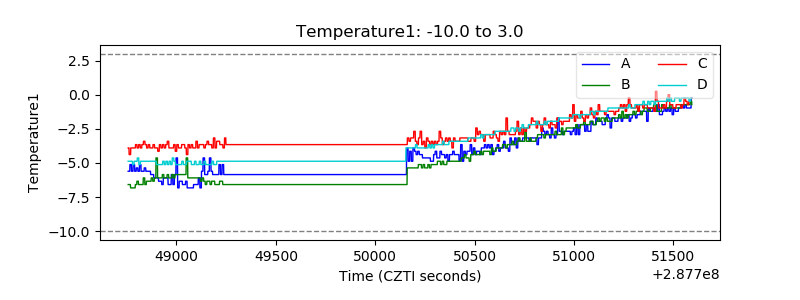 |
| Veto HV Monitor | 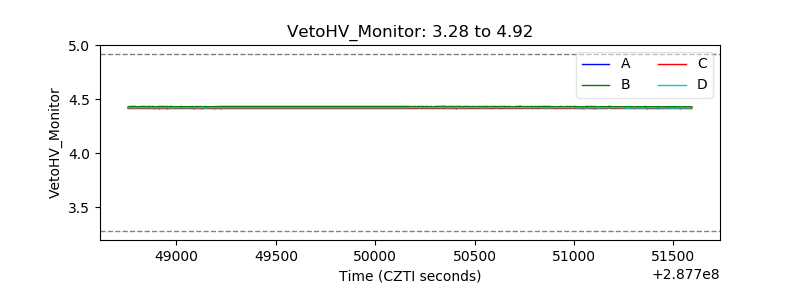 |
| Veto LLD |  |
| Alpha Counter | 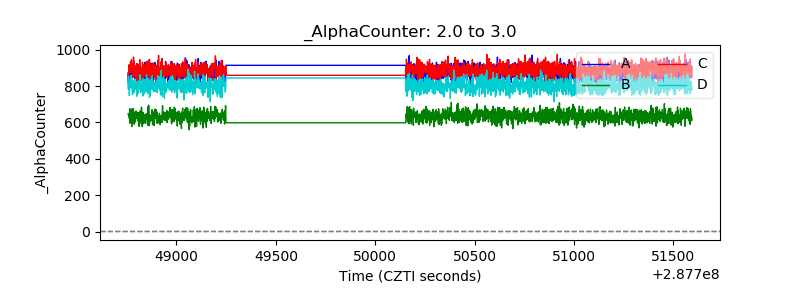 |
| _CPM_Rate | 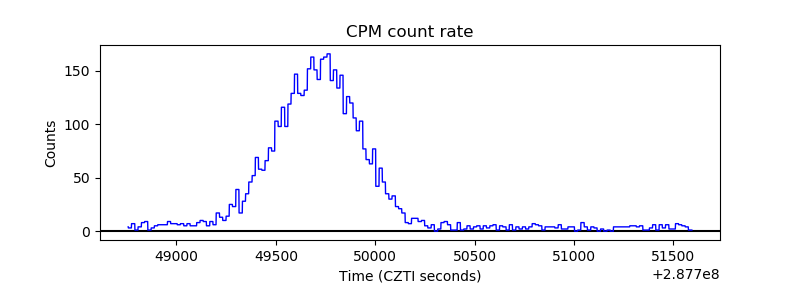 |
| CZT Counter | 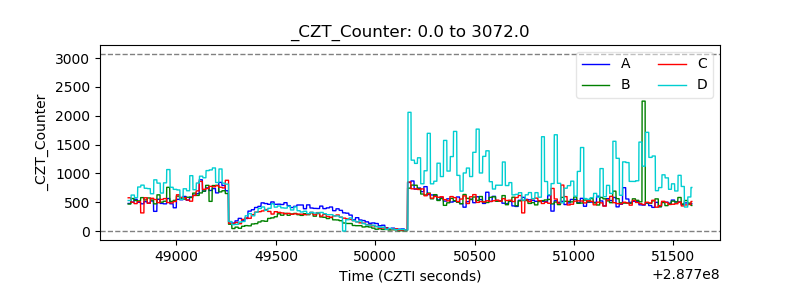 |
| +2.5 Volts monitor |  |
| +5 Volts monitor |  |
| _ROLL_ROT |  |
| _Roll_DEC | 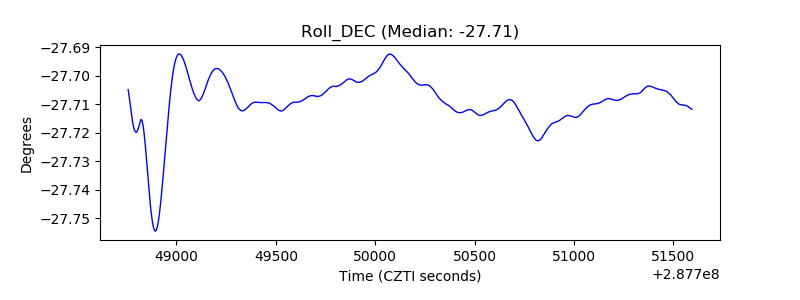 |
| _Roll_RA | 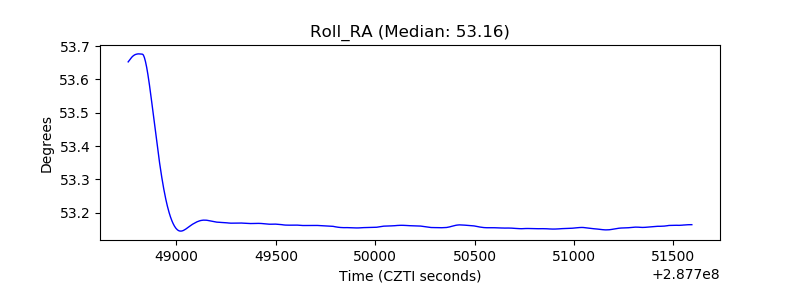 |
| Veto Counter |  |