| Param | Original file | Final file |
|---|---|---|
| Filename | modeM0/AS1A06_006T01_9000002720_18272cztM0_level2.evt | modeM0/AS1A06_006T01_9000002720_18272cztM0_level2_quad_clean.evt |
| Size (bytes) | 638,844,480 | 103,746,240 |
| Size | 609.2 MB | 98.9 MB |
| Events in quadrant A | 3,608,092 | 676,920 |
| Events in quadrant B | 3,988,436 | 671,815 |
| Events in quadrant C | 3,587,388 | 654,478 |
| Events in quadrant D | 7,650,942 | 611,380 |
| Mode SS | |||
|---|---|---|---|
| Quadrant | BADHDUFLAG | Total packets | Discarded packets |
| A | 0 | 154 | 0 |
| B | 0 | 154 | 0 |
| C | 0 | 154 | 0 |
| D | 0 | 154 | 0 |
| Mode M9 | |||
|---|---|---|---|
| Quadrant | BADHDUFLAG | Total packets | Discarded packets |
| A | 0 | 3 | 0 |
| B | 0 | 3 | 0 |
| C | 0 | 3 | 0 |
| D | 0 | 3 | 0 |
| Mode M0 | |||
|---|---|---|---|
| Quadrant | BADHDUFLAG | Total packets | Discarded packets |
| A | 0 | 15743 | 1 |
| B | 0 | 16740 | 1 |
| C | 0 | 15640 | 1 |
| D | 0 | 28102 | 1 |
| Quadrant | Total seconds | Saturated seconds | Saturation percentage |
|---|---|---|---|
| A | 7573 | 49 | 0.647036% |
| B | 7573 | 145 | 1.914697% |
| C | 7574 | 80 | 1.056245% |
| D | 7574 | 525 | 6.931608% |
Noise dominated data is calculated using 1-second bins in cleaned event files. If a bin has >2000 counts, and if more than 50% of those come from <1% of pixels, then it is considered to be noise-dominated and hence unusable.
| Quadrant | # 1 sec bins | Bins with >0 counts | Bins with >2000 counts | High rate bins dominated by noise | Noise dominated (total time) | Noise dominated (detector-on time) | Marked lightcurve |
|---|---|---|---|---|---|---|---|
| A | 7853 | 7574 | 1 | 1 | 0.01% | 0.01% | 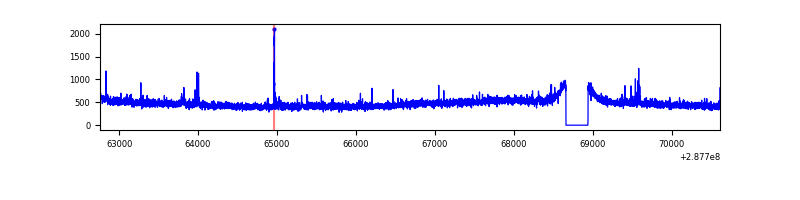 |
| B | 7853 | 7574 | 27 | 27 | 0.34% | 0.36% | 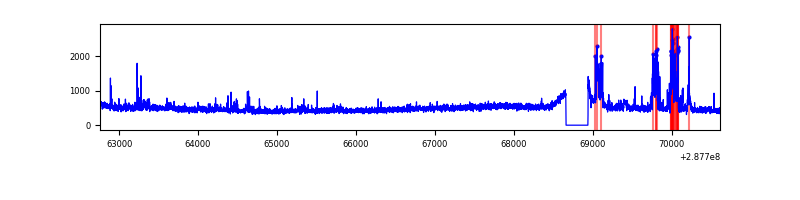 |
| C | 7854 | 7575 | 0 | 0 | 0.00% | 0.00% | 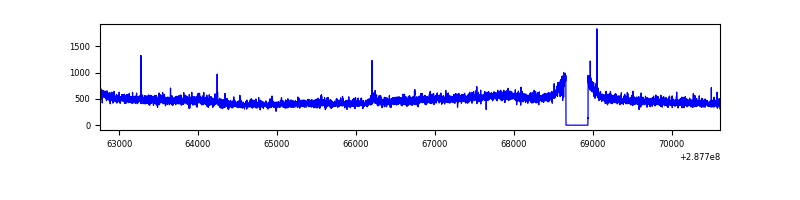 |
| D | 7854 | 7575 | 437 | 437 | 5.56% | 5.77% | 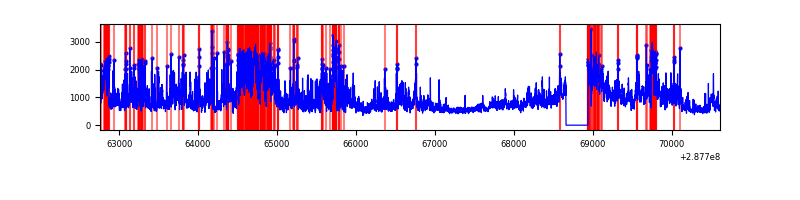 |
Top three noisy pixels from each quadrant. If the there are fewer than three noisy pixels in the level2.evt file, extra rows are filled as -1
| Pixel properties | Quadrant properties | ||||||
|---|---|---|---|---|---|---|---|
| Quadrant | DetID | PixID | Counts | Sigma | Mean | Median | Sigma |
| A | 15 | 174 | 58897 | 309.15 | 923 | 903 | 187.6 |
| A | 0 | 226 | 8092 | 38.32 | 923 | 903 | 187.6 |
| A | 12 | 194 | 6996 | 32.48 | 923 | 903 | 187.6 |
| B | 0 | 190 | 234424 | 1313.24 | 915 | 894 | 177.8 |
| B | 6 | 36 | 75297 | 418.4 | 915 | 894 | 177.8 |
| B | 0 | 198 | 20181 | 108.46 | 915 | 894 | 177.8 |
| C | 14 | 238 | 132426 | 636.19 | 872 | 874 | 206.8 |
| C | 3 | 233 | 44031 | 208.71 | 872 | 874 | 206.8 |
| C | 0 | 207 | 11661 | 52.17 | 872 | 874 | 206.8 |
| D | 7 | 238 | 2300288 | 10608.23 | 873 | 844 | 216.8 |
| D | 13 | 168 | 1296083 | 5975.44 | 873 | 844 | 216.8 |
| D | 8 | 195 | 382137 | 1759.05 | 873 | 844 | 216.8 |
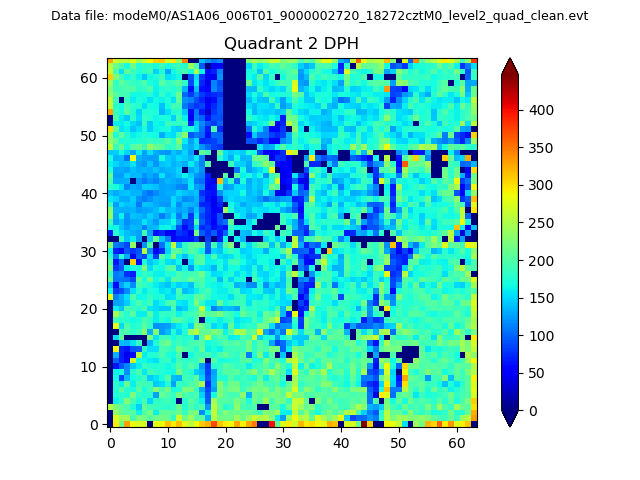
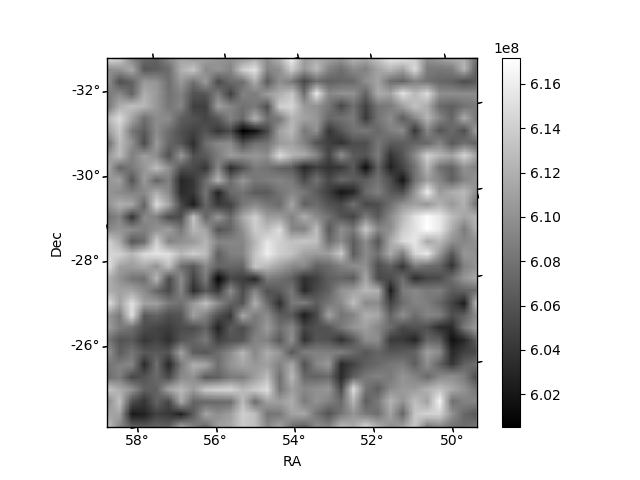
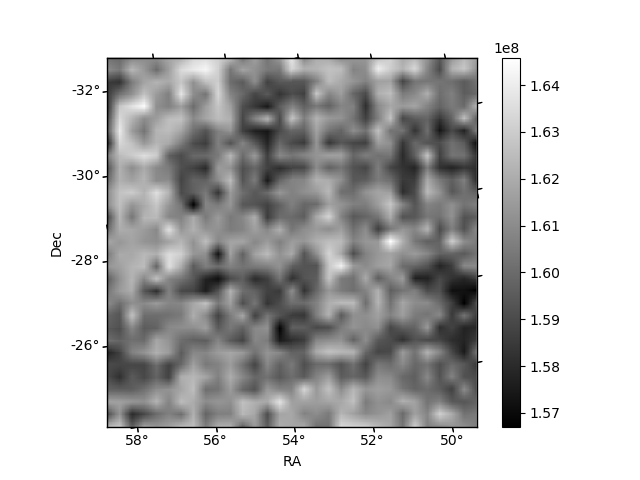
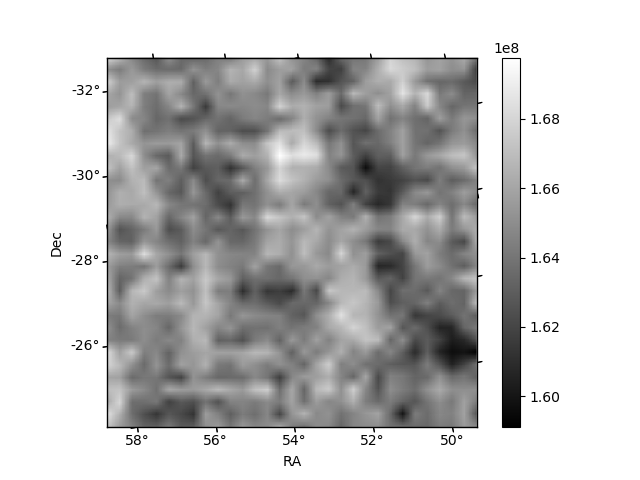
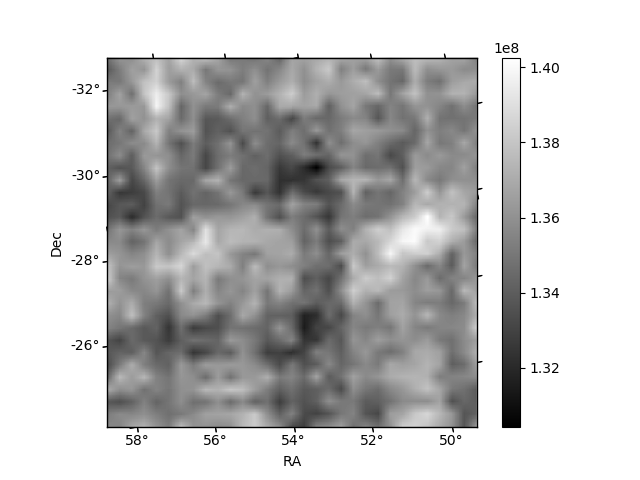
Histogram calculated using DETX and DETY for each event in the final _common_clean file
| Quadrant A | 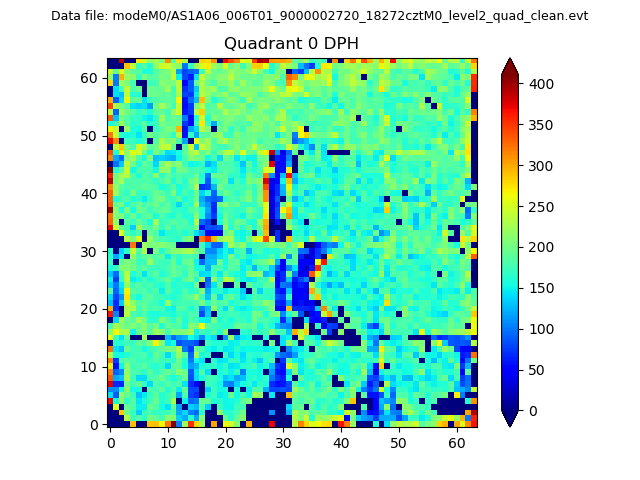 |
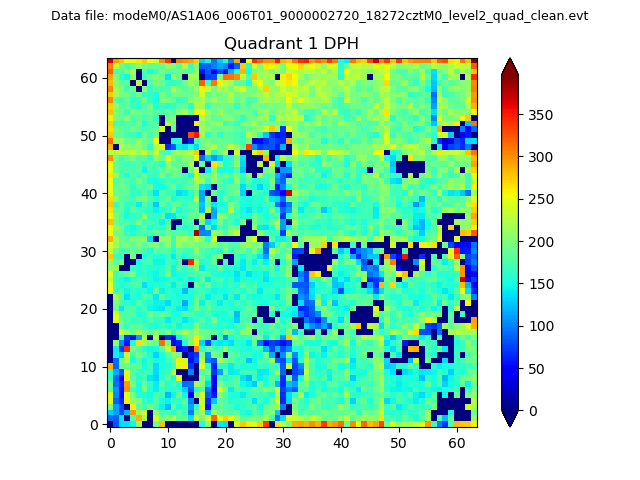 |
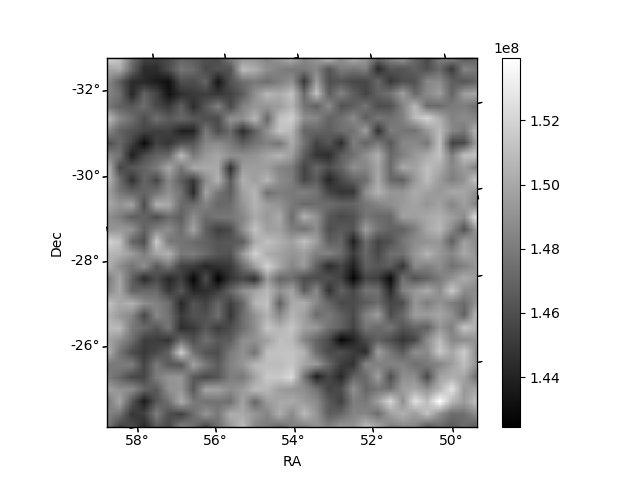
Quadrant B |
|---|---|---|---|
| Quadrant D | 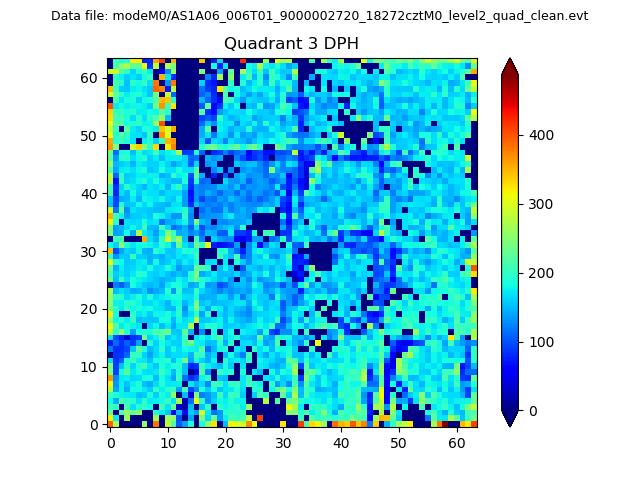 |
 |
Quadrant C |
| Plot type | Count rate plots | Images |
|---|---|---|
| Comparison with Poisson distribution Blue bars denote a histogram of data divided into 1 sec bins. Red curve is a Poisson curve with rate = median count rate of data. |
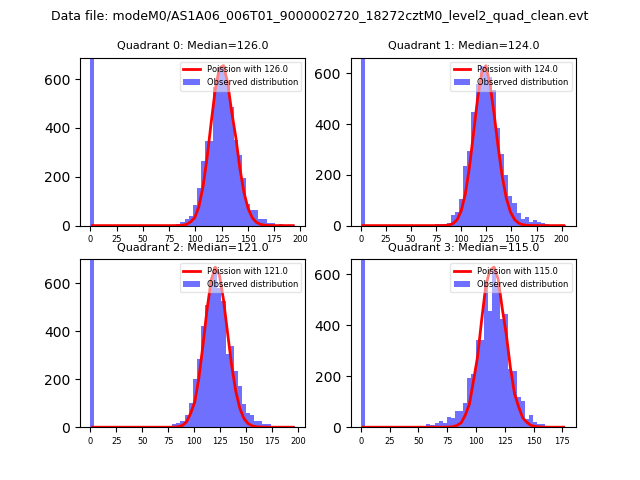 |
 |
| Quadrant-wise count rates Data is divided into 100 sec bins |
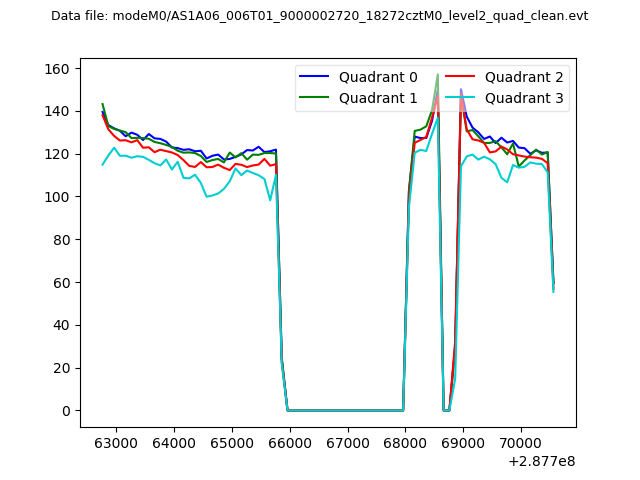 |
|
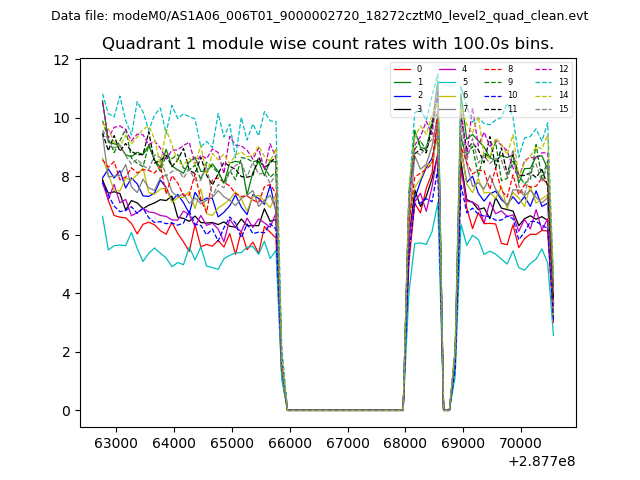
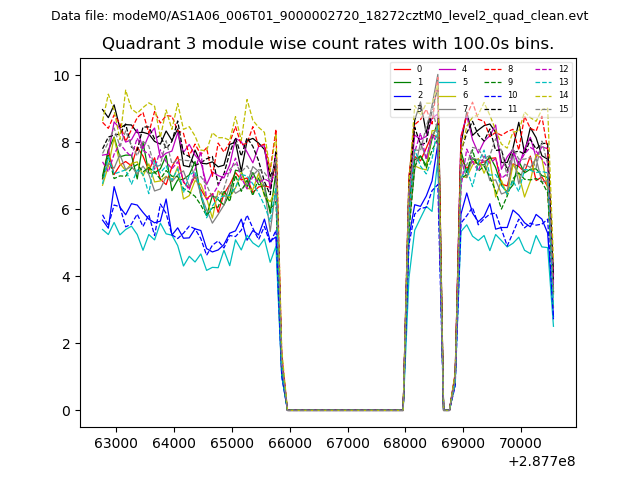
| Module-wise count rates for Quadrant A Data is divided into 100 sec bins |
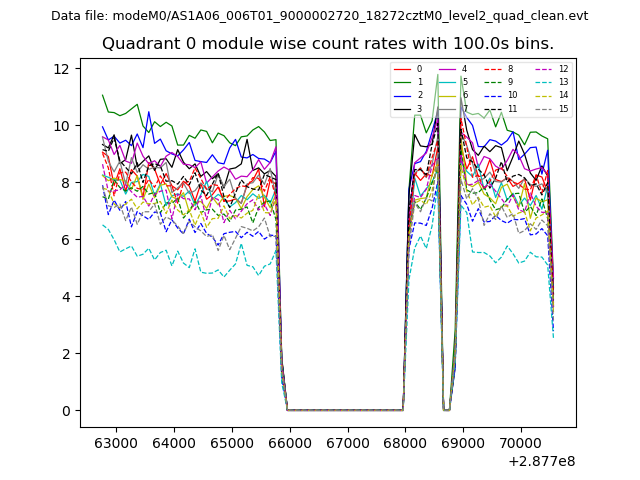 |
 |
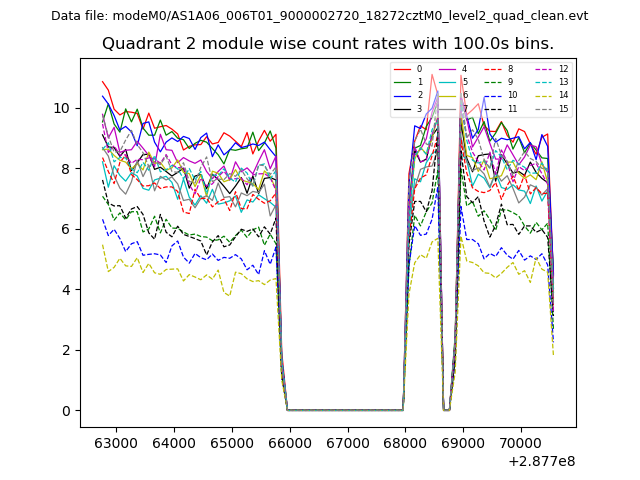
| Module-wise count rates for Quadrant B Data is divided into 100 sec bins |
 |
 |
| Module-wise count rates for Quadrant C Data is divided into 100 sec bins |
 |
 |
| Module-wise count rates for Quadrant D Data is divided into 100 sec bins |
 |
 |
| Parameter | Plot |
|---|---|
| CZT HV Monitor | 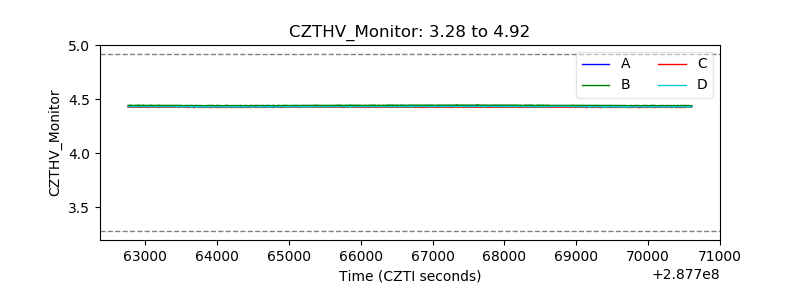 |
| D_VDD | 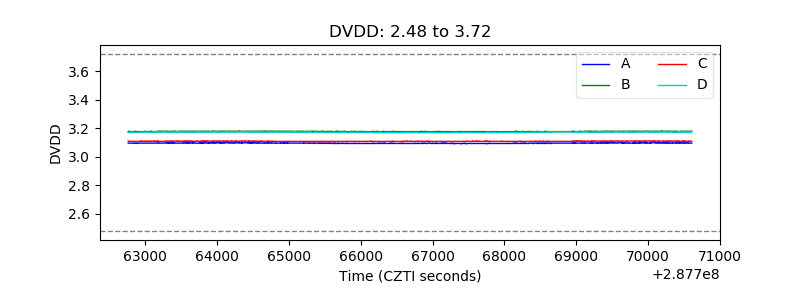 |
| Temperature 1 | 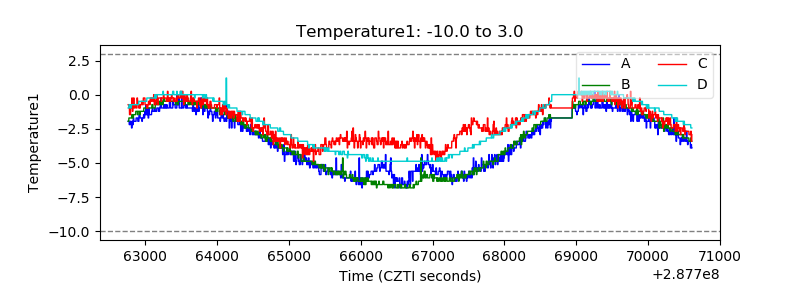 |
| Veto HV Monitor | 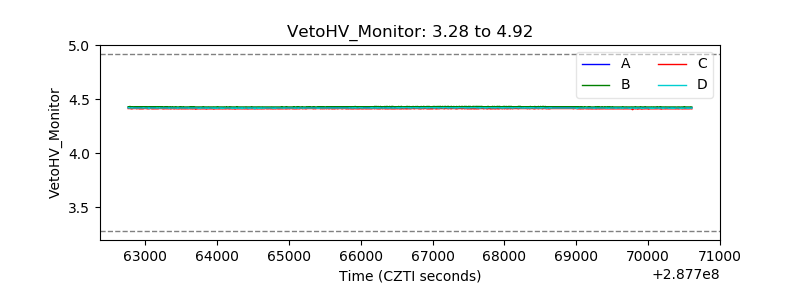 |
| Veto LLD | 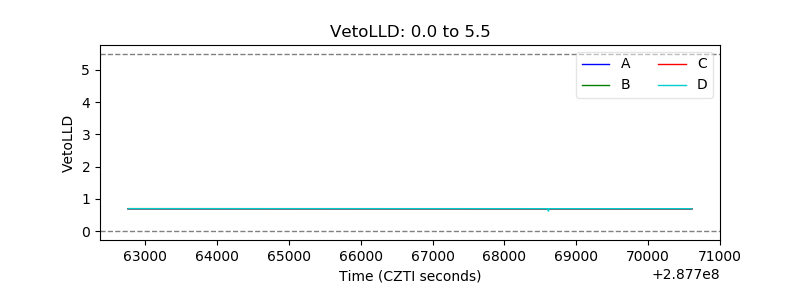 |
| Alpha Counter | 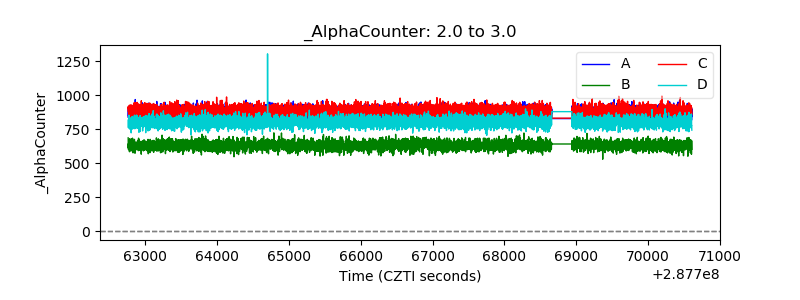 |
| _CPM_Rate | 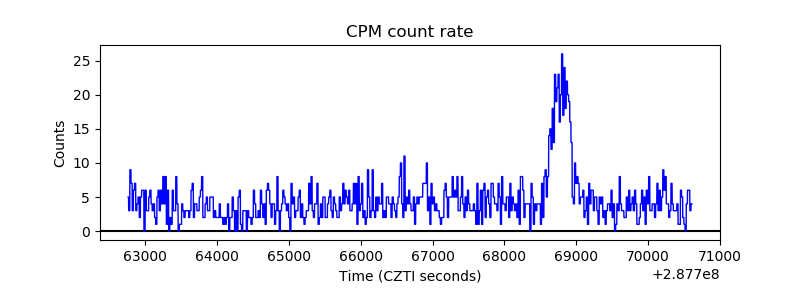 |
| CZT Counter | 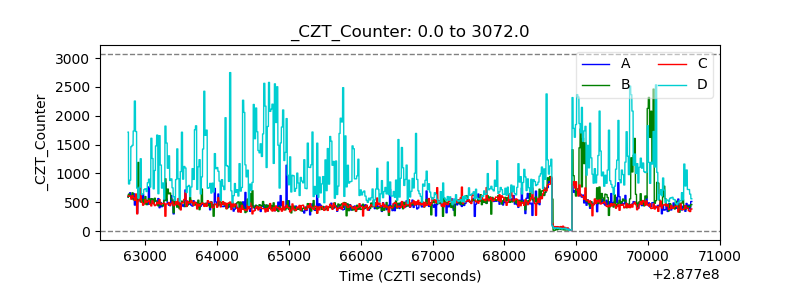 |
| +2.5 Volts monitor | 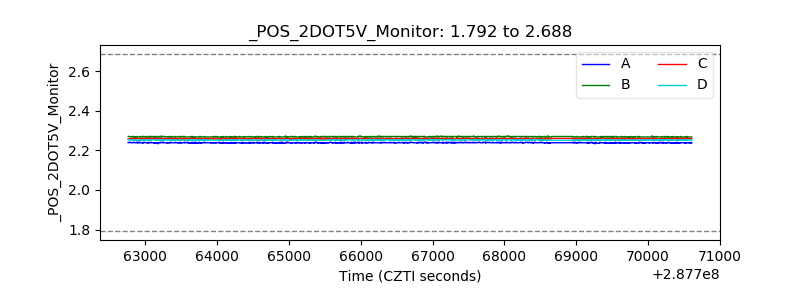 |
| +5 Volts monitor |  |
| _ROLL_ROT | 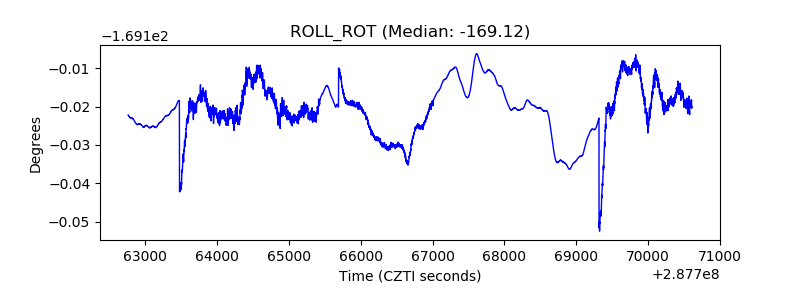 |
| _Roll_DEC | 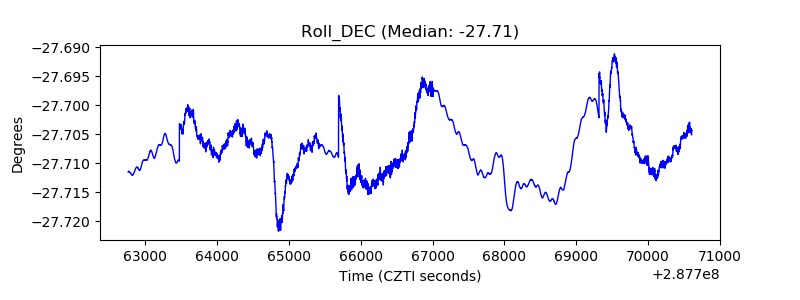 |
| _Roll_RA | 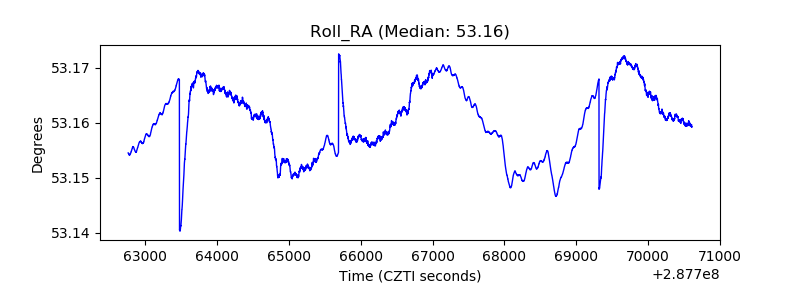 |
| Veto Counter | 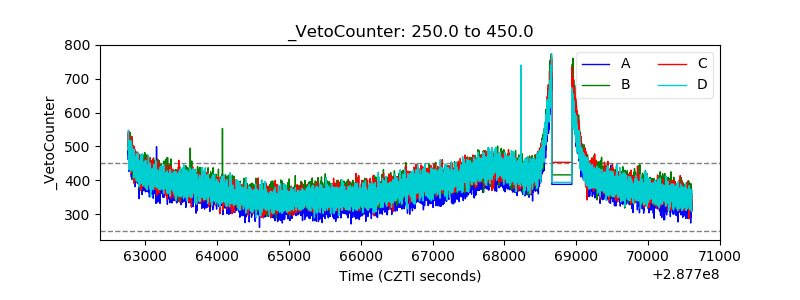 |