| Param | Original file | Final file |
|---|---|---|
| Filename | modeM0/AS1A06_006T01_9000002720_18276cztM0_level2.evt | modeM0/AS1A06_006T01_9000002720_18276cztM0_level2_quad_clean.evt |
| Size (bytes) | 546,935,040 | 84,188,160 |
| Size | 521.6 MB | 80.3 MB |
| Events in quadrant A | 3,147,637 | 532,485 |
| Events in quadrant B | 3,466,585 | 535,534 |
| Events in quadrant C | 3,206,969 | 518,118 |
| Events in quadrant D | 6,282,524 | 489,860 |
| Mode SS | |||
|---|---|---|---|
| Quadrant | BADHDUFLAG | Total packets | Discarded packets |
| A | 0 | 140 | 0 |
| B | 0 | 140 | 0 |
| C | 0 | 140 | 0 |
| D | 0 | 140 | 0 |
| Mode M9 | |||
|---|---|---|---|
| Quadrant | BADHDUFLAG | Total packets | Discarded packets |
| A | 0 | 18 | 0 |
| B | 0 | 18 | 0 |
| C | 0 | 18 | 0 |
| D | 0 | 18 | 0 |
| Mode M0 | |||
|---|---|---|---|
| Quadrant | BADHDUFLAG | Total packets | Discarded packets |
| A | 0 | 13817 | 2 |
| B | 0 | 14692 | 2 |
| C | 0 | 13875 | 2 |
| D | 0 | 23445 | 2 |
| Quadrant | Total seconds | Saturated seconds | Saturation percentage |
|---|---|---|---|
| A | 6790 | 10 | 0.147275% |
| B | 6790 | 41 | 0.603829% |
| C | 6791 | 56 | 0.824621% |
| D | 6791 | 330 | 4.859373% |
Noise dominated data is calculated using 1-second bins in cleaned event files. If a bin has >2000 counts, and if more than 50% of those come from <1% of pixels, then it is considered to be noise-dominated and hence unusable.
| Quadrant | # 1 sec bins | Bins with >0 counts | Bins with >2000 counts | High rate bins dominated by noise | Noise dominated (total time) | Noise dominated (detector-on time) | Marked lightcurve |
|---|---|---|---|---|---|---|---|
| A | 8575 | 6792 | 0 | 0 | 0.00% | 0.00% |  |
| B | 8575 | 6792 | 4 | 4 | 0.05% | 0.06% |  |
| C | 8576 | 6793 | 6 | 6 | 0.07% | 0.09% |  |
| D | 8576 | 6793 | 443 | 443 | 5.17% | 6.52% | 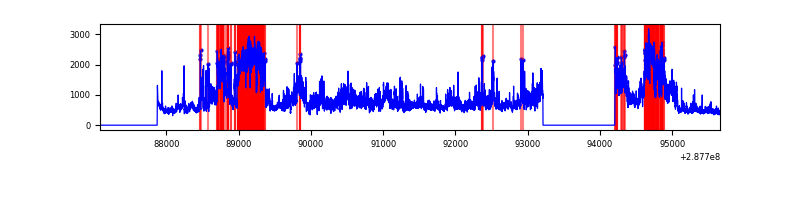 |
Top three noisy pixels from each quadrant. If the there are fewer than three noisy pixels in the level2.evt file, extra rows are filled as -1
| Pixel properties | Quadrant properties | ||||||
|---|---|---|---|---|---|---|---|
| Quadrant | DetID | PixID | Counts | Sigma | Mean | Median | Sigma |
| A | 15 | 174 | 26226 | 155.73 | 809 | 792 | 163.3 |
| A | 0 | 226 | 7000 | 38.01 | 809 | 792 | 163.3 |
| A | 3 | 137 | 6117 | 32.6 | 809 | 792 | 163.3 |
| B | 7 | 220 | 110908 | 701.18 | 816 | 796 | 157.0 |
| B | 4 | 171 | 102355 | 646.71 | 816 | 796 | 157.0 |
| B | 4 | 216 | 19221 | 117.33 | 816 | 796 | 157.0 |
| C | 14 | 238 | 119101 | 647.23 | 779 | 784 | 182.8 |
| C | 0 | 207 | 42082 | 225.91 | 779 | 784 | 182.8 |
| C | 3 | 233 | 6491 | 31.22 | 779 | 784 | 182.8 |
| D | 7 | 238 | 2706802 | 14113.86 | 777 | 754 | 191.7 |
| D | 1 | 52 | 337904 | 1758.46 | 777 | 754 | 191.7 |
| D | 13 | 168 | 231527 | 1203.64 | 777 | 754 | 191.7 |
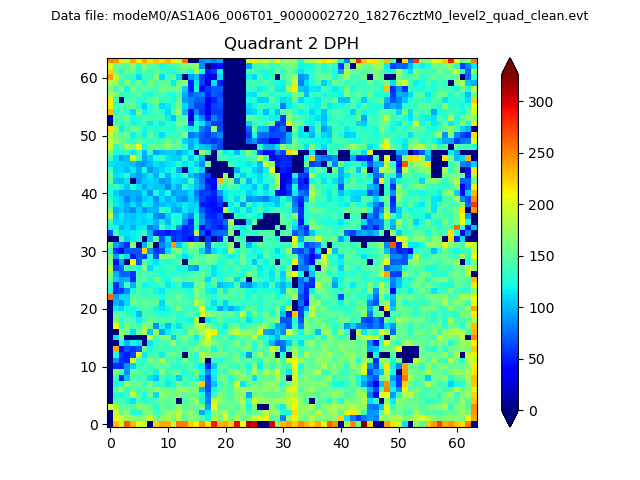
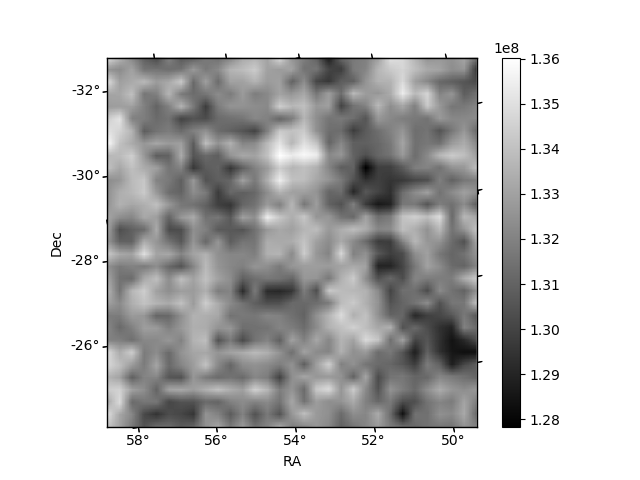
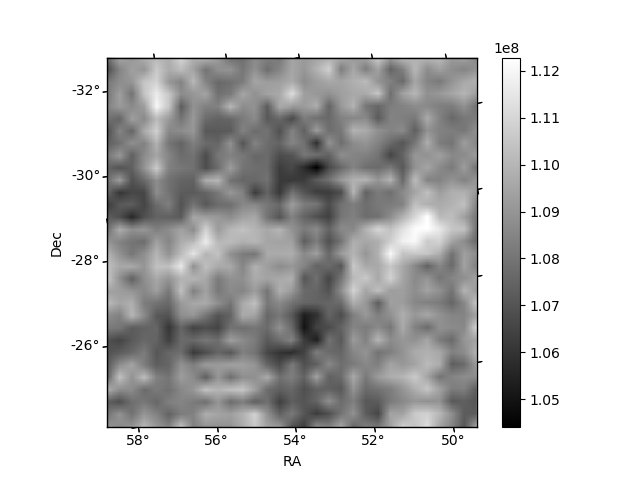
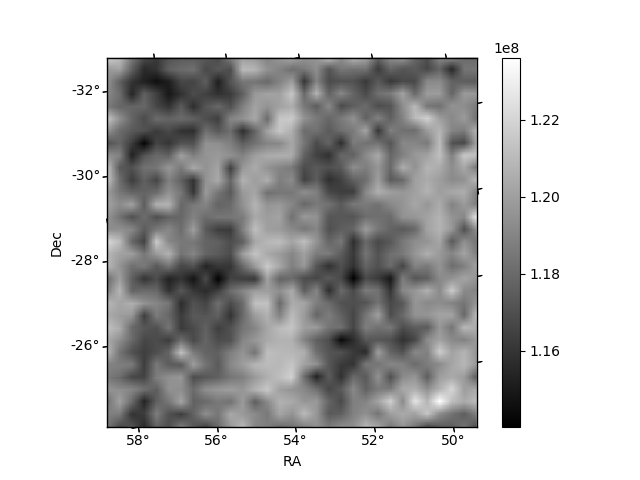
Histogram calculated using DETX and DETY for each event in the final _common_clean file
| Quadrant A |  |
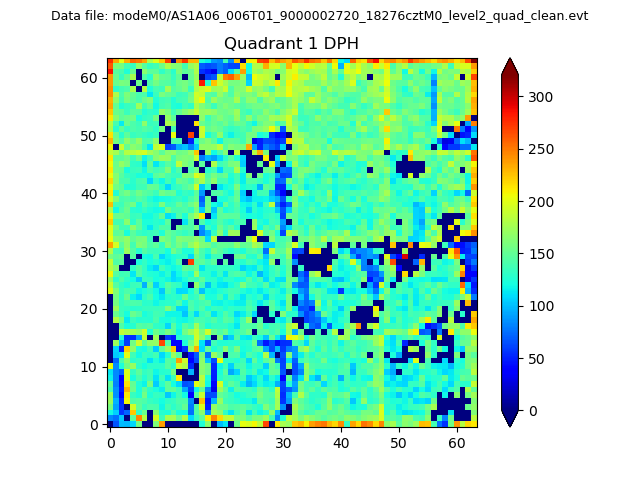 |
Quadrant B |
|---|---|---|---|
| Quadrant D | 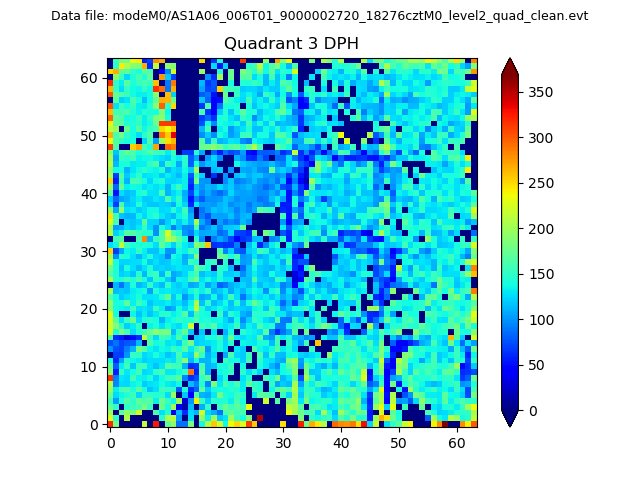 |
 |
Quadrant C |
| Plot type | Count rate plots | Images |
|---|---|---|
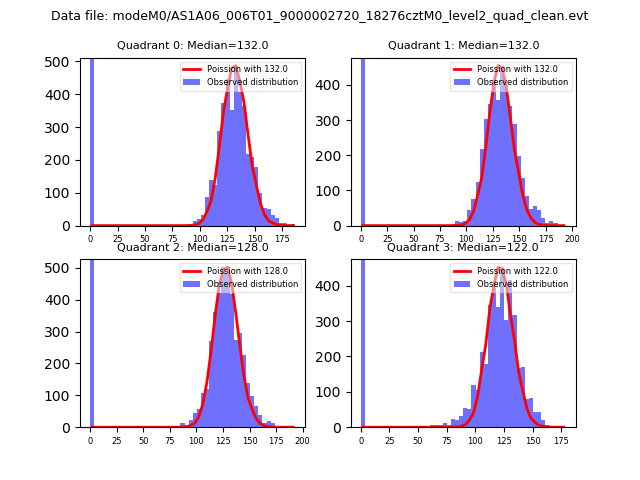
| Comparison with Poisson distribution Blue bars denote a histogram of data divided into 1 sec bins. Red curve is a Poisson curve with rate = median count rate of data. |
 |
 |
| Quadrant-wise count rates Data is divided into 100 sec bins |
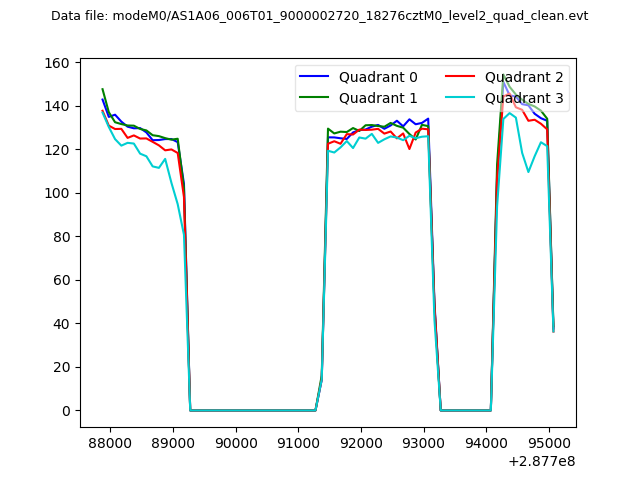 |
|
| Module-wise count rates for Quadrant A Data is divided into 100 sec bins |
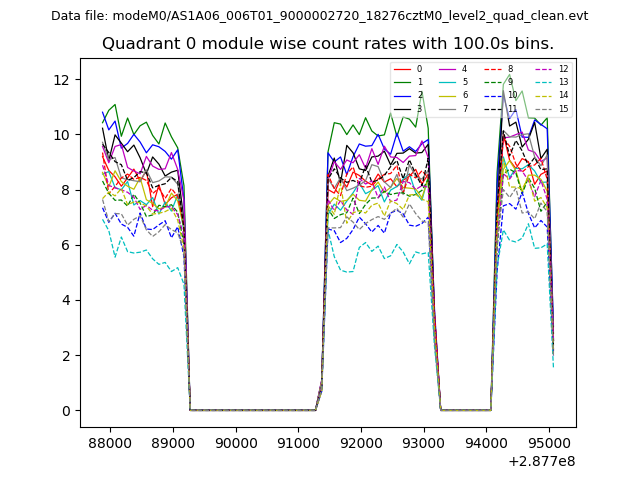 |
 |
| Module-wise count rates for Quadrant B Data is divided into 100 sec bins |
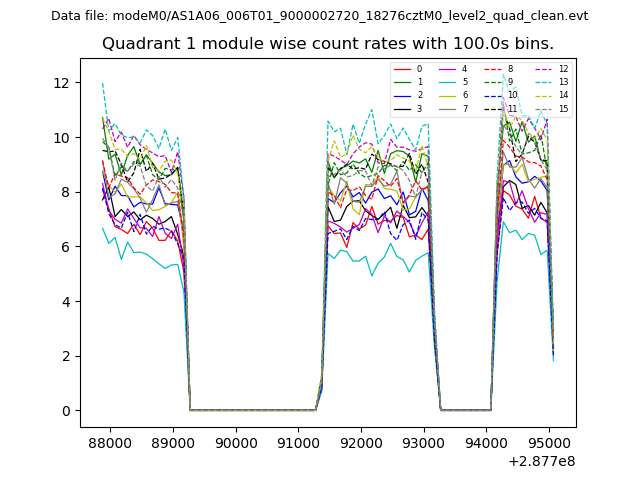 |
 |
| Module-wise count rates for Quadrant C Data is divided into 100 sec bins |
 |
 |
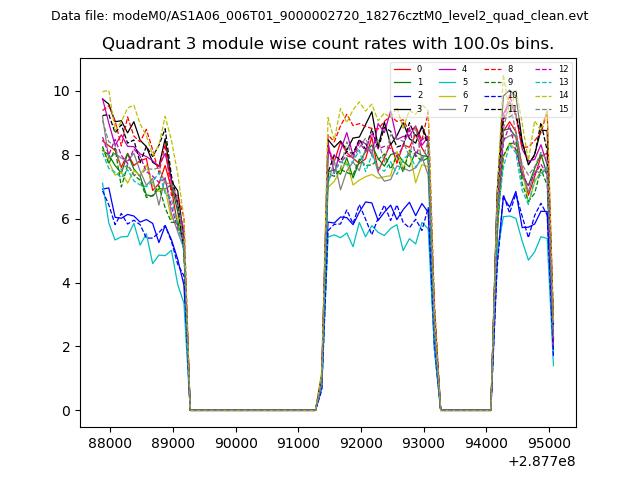
| Module-wise count rates for Quadrant D Data is divided into 100 sec bins |
 |
 |
| Parameter | Plot |
|---|---|
| CZT HV Monitor |  |
| D_VDD | 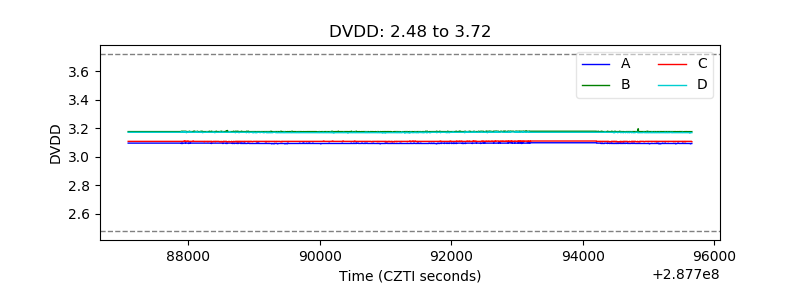 |
| Temperature 1 | 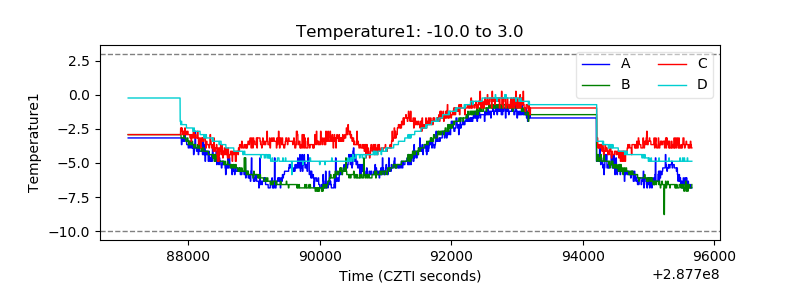 |
| Veto HV Monitor | 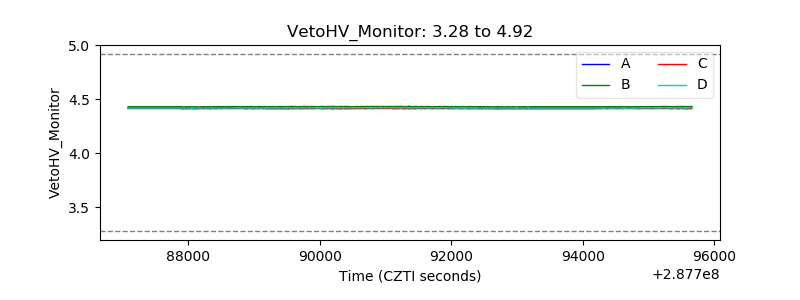 |
| Veto LLD | 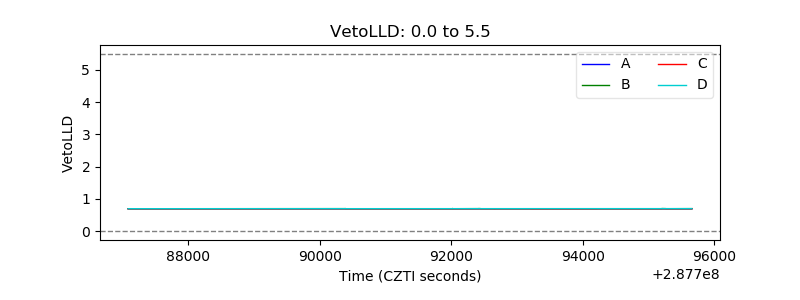 |
| Alpha Counter | 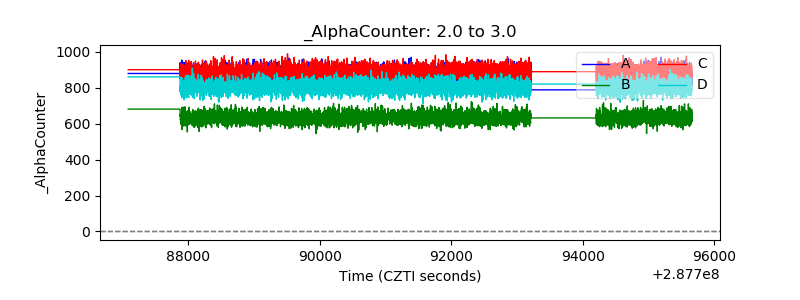 |
| _CPM_Rate | 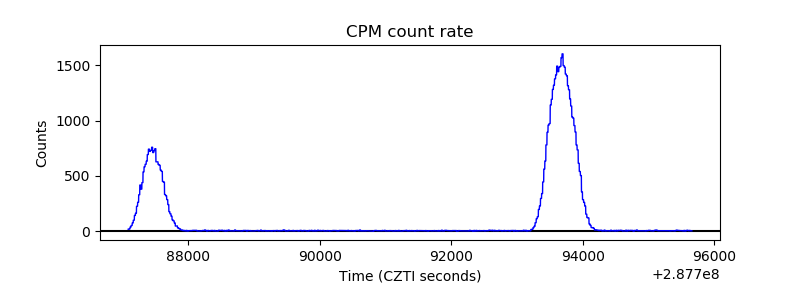 |
| CZT Counter | 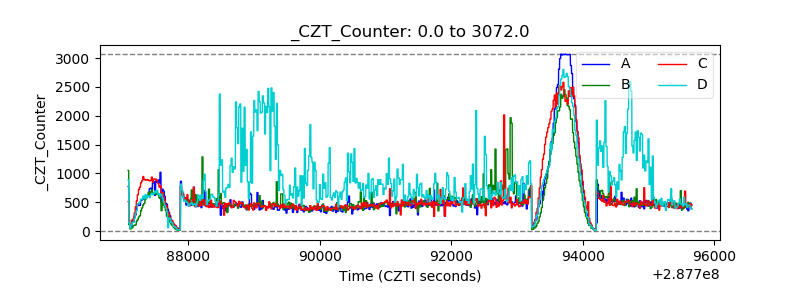 |
| +2.5 Volts monitor |  |
| +5 Volts monitor |  |
| _ROLL_ROT | 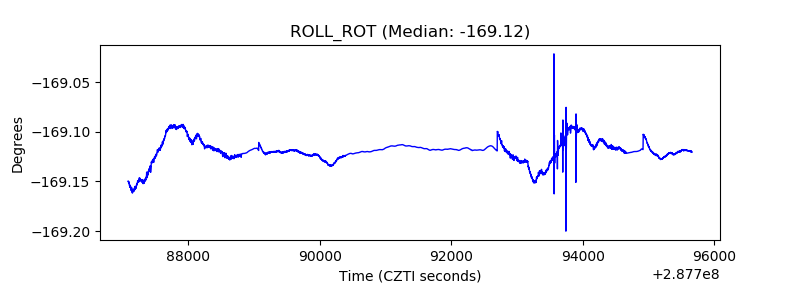 |
| _Roll_DEC | 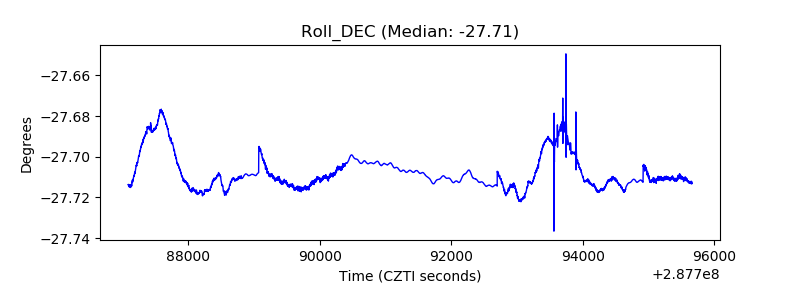 |
| _Roll_RA | 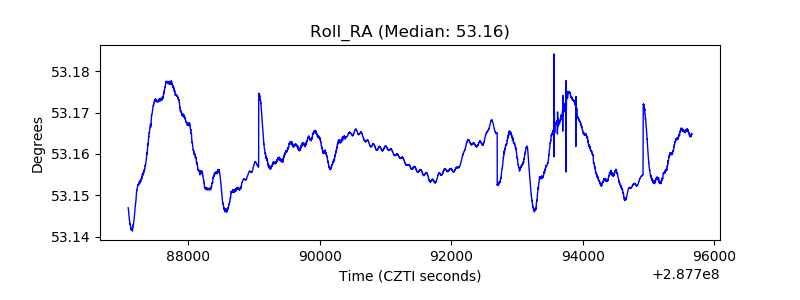 |
| Veto Counter | 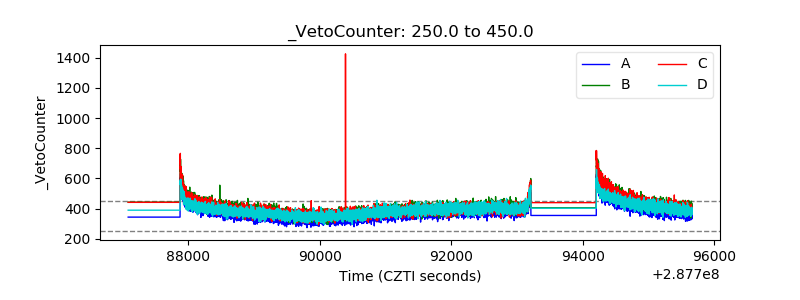 |