| Param | Original file | Final file |
|---|---|---|
| Filename | modeM0/AS1A06_006T01_9000002720_18280cztM0_level2.evt | modeM0/AS1A06_006T01_9000002720_18280cztM0_level2_quad_clean.evt |
| Size (bytes) | 543,237,120 | 64,126,080 |
| Size | 518.1 MB | 61.2 MB |
| Events in quadrant A | 4,050,314 | 377,333 |
| Events in quadrant B | 3,416,465 | 390,778 |
| Events in quadrant C | 3,373,900 | 379,210 |
| Events in quadrant D | 5,185,906 | 355,620 |
| Mode SS | |||
|---|---|---|---|
| Quadrant | BADHDUFLAG | Total packets | Discarded packets |
| A | 0 | 128 | 0 |
| B | 0 | 128 | 0 |
| C | 0 | 128 | 0 |
| D | 0 | 128 | 0 |
| Mode M9 | |||
|---|---|---|---|
| Quadrant | BADHDUFLAG | Total packets | Discarded packets |
| A | 0 | 13 | 0 |
| B | 0 | 14 | 0 |
| C | 0 | 14 | 0 |
| D | 0 | 14 | 0 |
| Mode M0 | |||
|---|---|---|---|
| Quadrant | BADHDUFLAG | Total packets | Discarded packets |
| A | 0 | 15884 | 3 |
| B | 0 | 13898 | 2 |
| C | 0 | 13844 | 2 |
| D | 0 | 19735 | 2 |
| Quadrant | Total seconds | Saturated seconds | Saturation percentage |
|---|---|---|---|
| A | 6279 | 240 | 3.822265% |
| B | 6279 | 82 | 1.305940% |
| C | 6279 | 108 | 1.720019% |
| D | 6279 | 357 | 5.685619% |
Noise dominated data is calculated using 1-second bins in cleaned event files. If a bin has >2000 counts, and if more than 50% of those come from <1% of pixels, then it is considered to be noise-dominated and hence unusable.
| Quadrant | # 1 sec bins | Bins with >0 counts | Bins with >2000 counts | High rate bins dominated by noise | Noise dominated (total time) | Noise dominated (detector-on time) | Marked lightcurve |
|---|---|---|---|---|---|---|---|
| A | 7574 | 6280 | 162 | 162 | 2.14% | 2.58% | 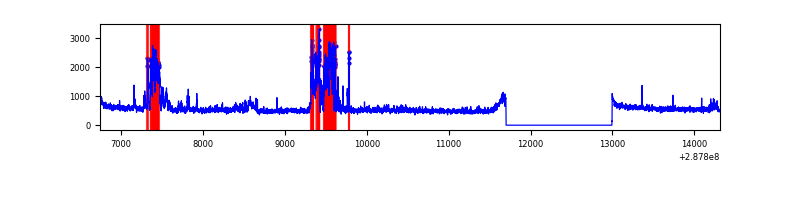 |
| B | 7574 | 6280 | 2 | 2 | 0.03% | 0.03% | 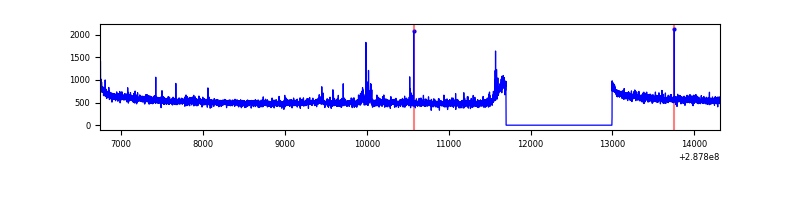 |
| C | 7574 | 6280 | 0 | 0 | 0.00% | 0.00% | 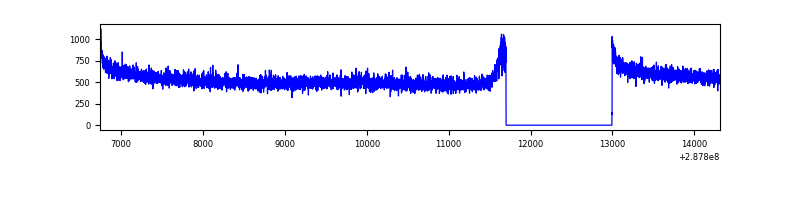 |
| D | 7574 | 6280 | 300 | 300 | 3.96% | 4.78% | 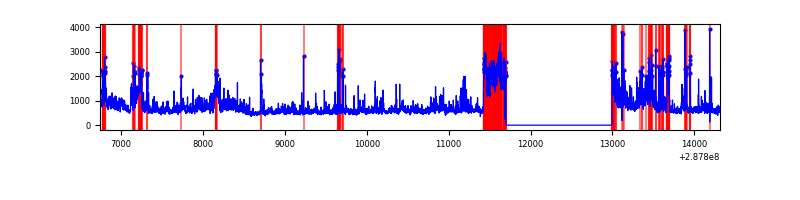 |
Top three noisy pixels from each quadrant. If the there are fewer than three noisy pixels in the level2.evt file, extra rows are filled as -1
| Pixel properties | Quadrant properties | ||||||
|---|---|---|---|---|---|---|---|
| Quadrant | DetID | PixID | Counts | Sigma | Mean | Median | Sigma |
| A | 15 | 174 | 776706 | 4590.62 | 851 | 834 | 169.0 |
| A | 0 | 226 | 7418 | 38.96 | 851 | 834 | 169.0 |
| A | 12 | 194 | 6066 | 30.96 | 851 | 834 | 169.0 |
| B | 0 | 244 | 19676 | 117.65 | 863 | 849 | 160.0 |
| B | 12 | 111 | 17727 | 105.47 | 863 | 849 | 160.0 |
| B | 7 | 220 | 15416 | 91.03 | 863 | 849 | 160.0 |
| C | 14 | 238 | 130411 | 683.93 | 828 | 838 | 189.5 |
| C | 3 | 233 | 11544 | 56.51 | 828 | 838 | 189.5 |
| C | 13 | 61 | 5851 | 26.46 | 828 | 838 | 189.5 |
| D | 7 | 238 | 1505029 | 7673.56 | 814 | 796 | 196.0 |
| D | 1 | 52 | 405578 | 2064.92 | 814 | 796 | 196.0 |
| D | 13 | 168 | 84643 | 427.73 | 814 | 796 | 196.0 |
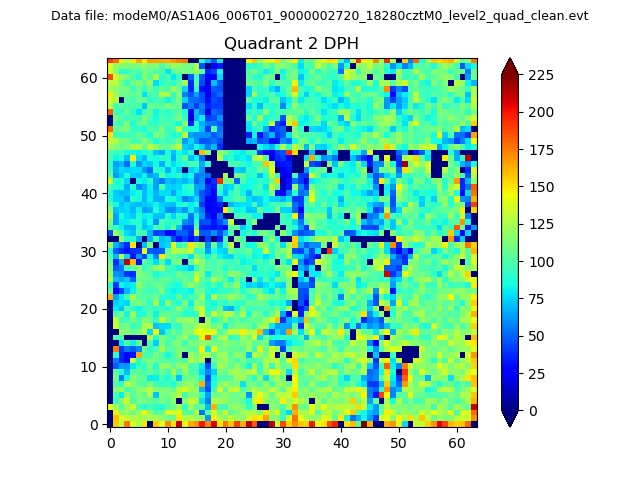
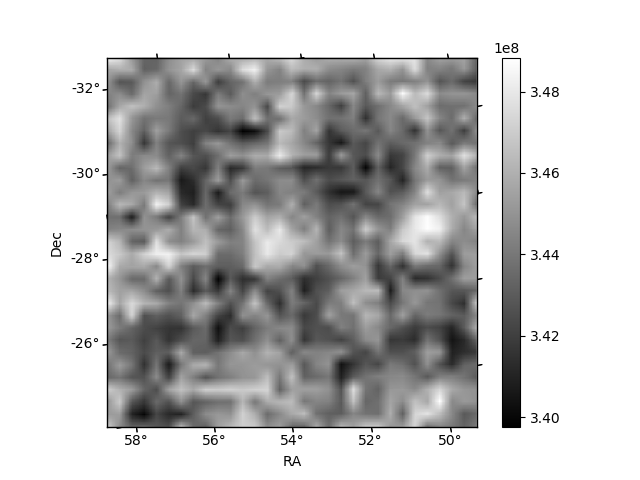
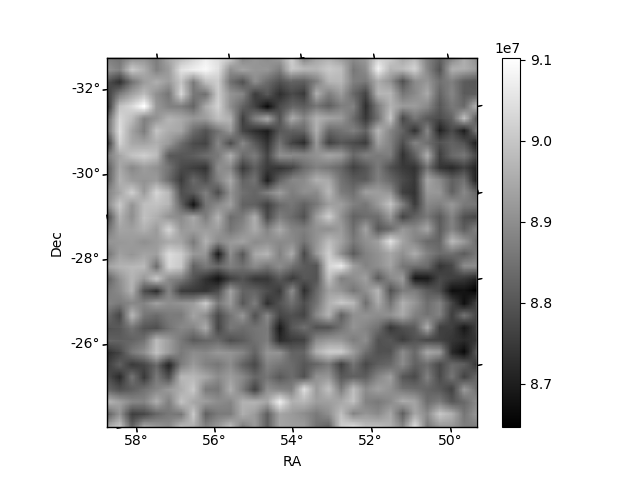
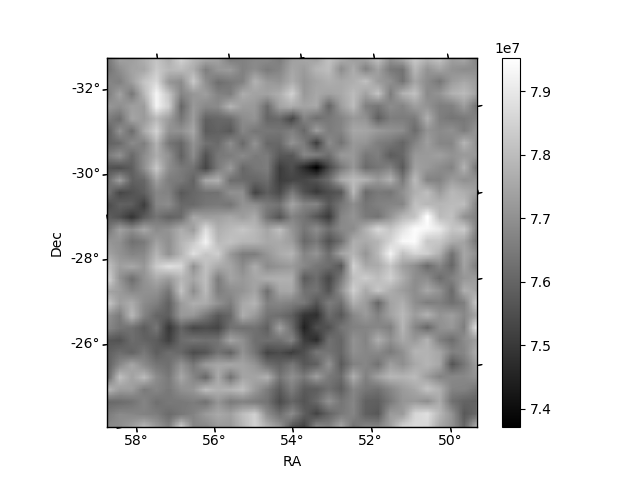
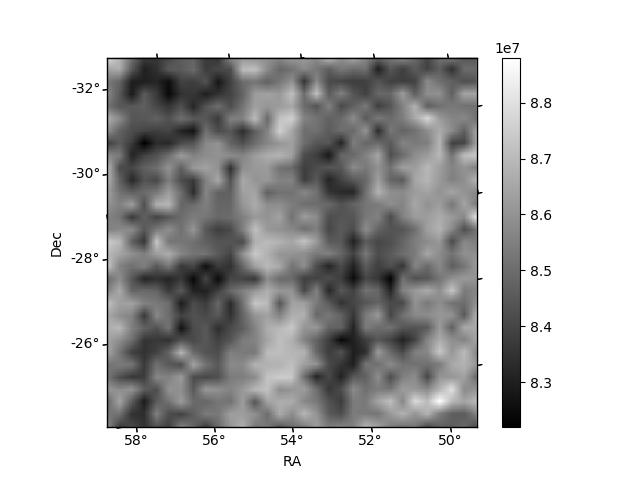
Histogram calculated using DETX and DETY for each event in the final _common_clean file
| Quadrant A | 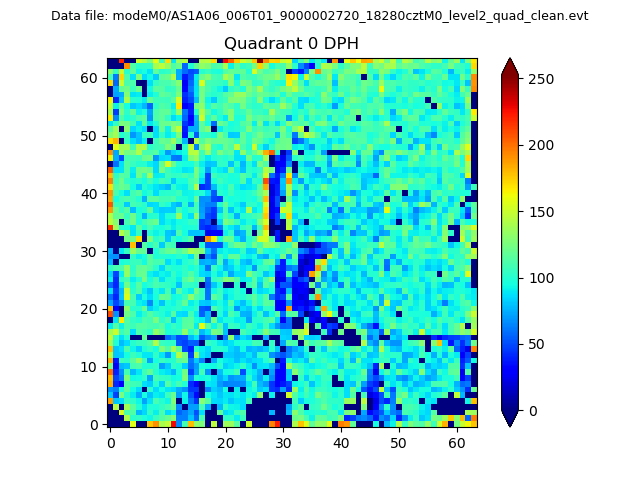 |
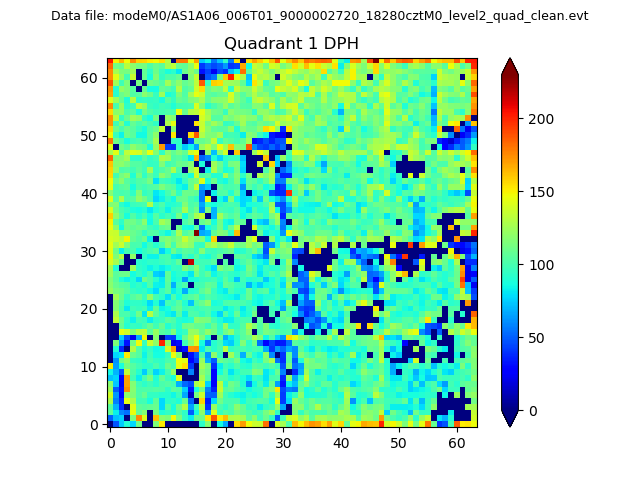 |
Quadrant B |
|---|---|---|---|
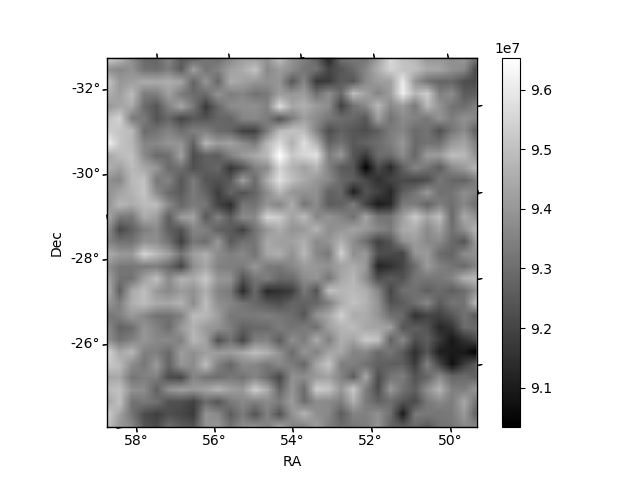
| Quadrant D | 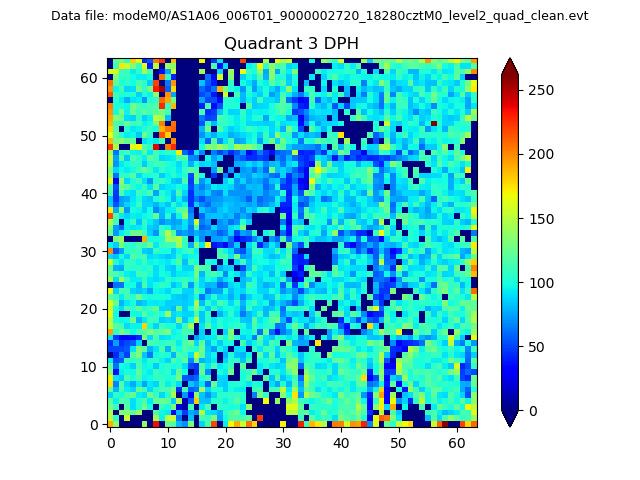 |
 |
Quadrant C |
| Plot type | Count rate plots | Images |
|---|---|---|
| Comparison with Poisson distribution Blue bars denote a histogram of data divided into 1 sec bins. Red curve is a Poisson curve with rate = median count rate of data. |
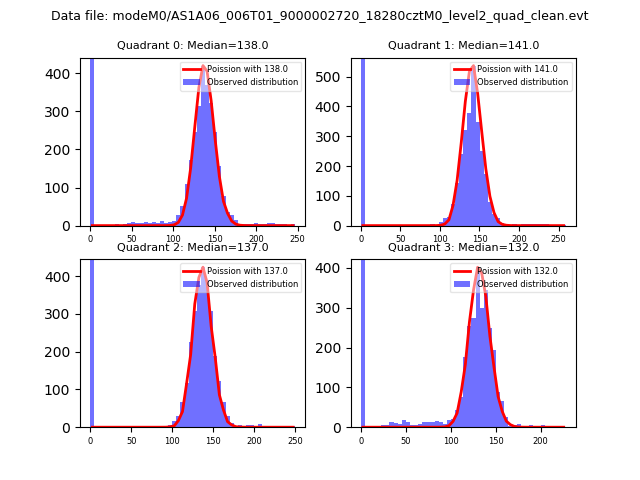 |
 |
| Quadrant-wise count rates Data is divided into 100 sec bins |
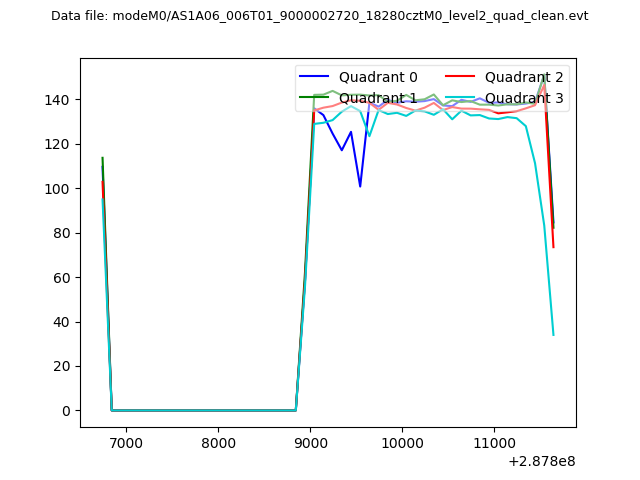 |
|
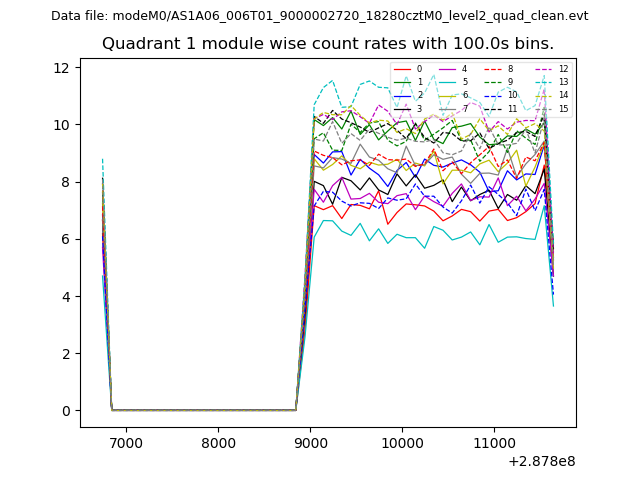
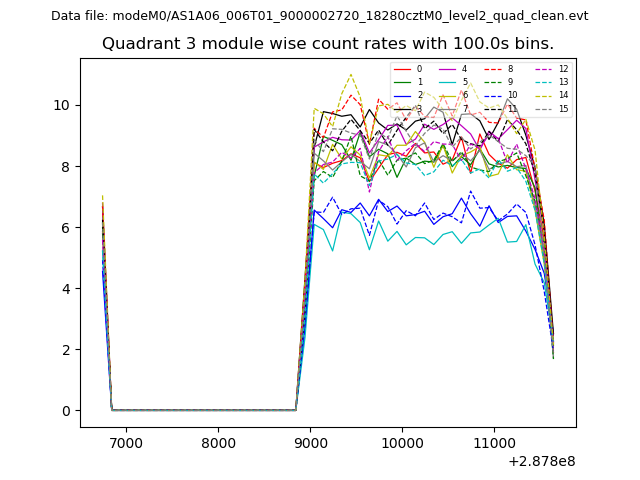
| Module-wise count rates for Quadrant A Data is divided into 100 sec bins |
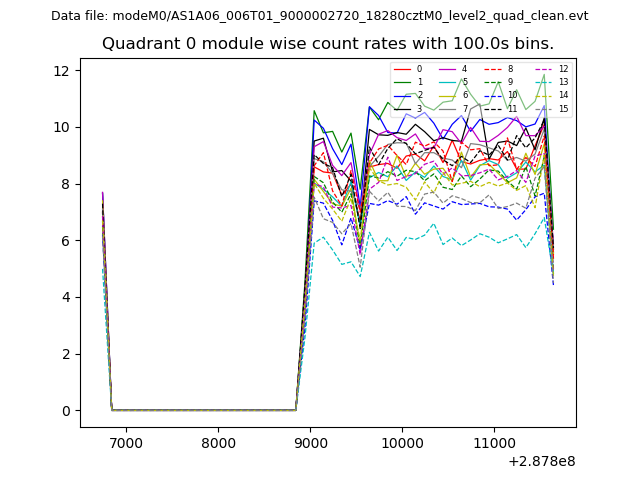 |
 |
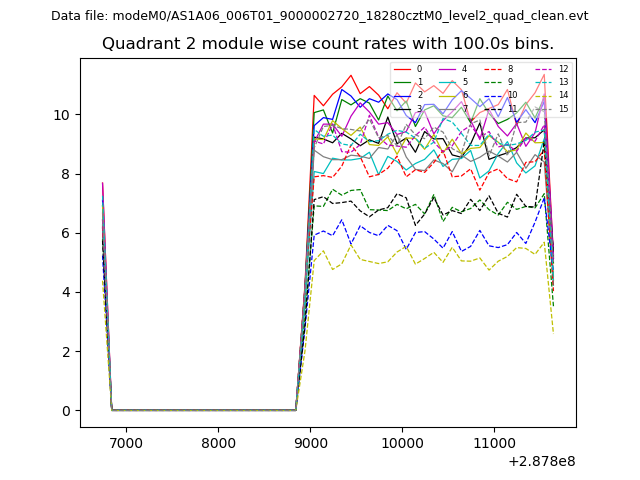
| Module-wise count rates for Quadrant B Data is divided into 100 sec bins |
 |
 |
| Module-wise count rates for Quadrant C Data is divided into 100 sec bins |
 |
 |
| Module-wise count rates for Quadrant D Data is divided into 100 sec bins |
 |
 |
| Parameter | Plot |
|---|---|
| CZT HV Monitor | 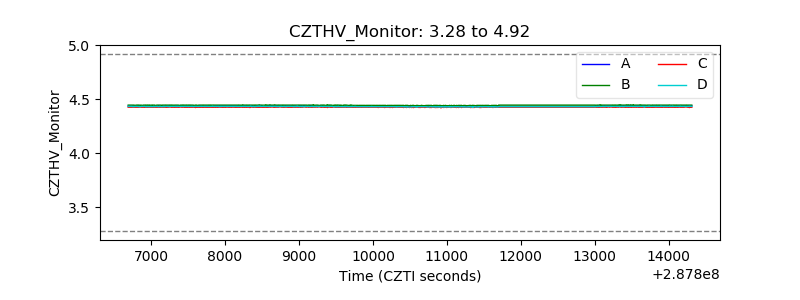 |
| D_VDD | 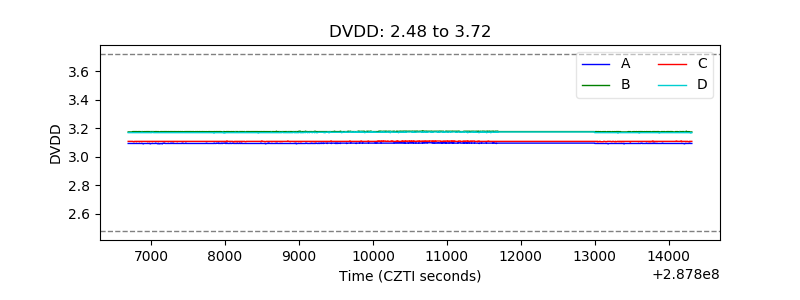 |
| Temperature 1 | 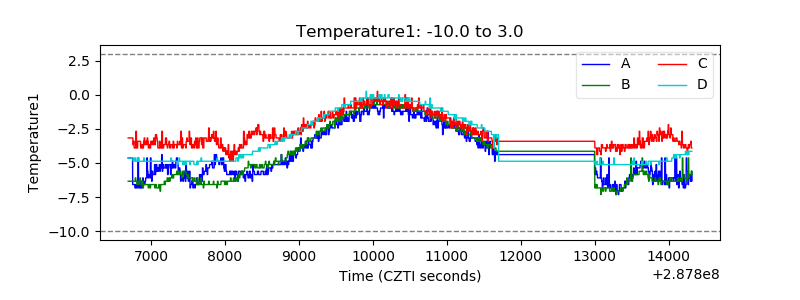 |
| Veto HV Monitor | 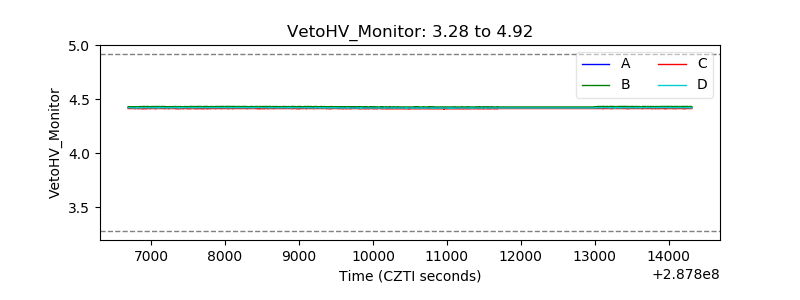 |
| Veto LLD |  |
| Alpha Counter | 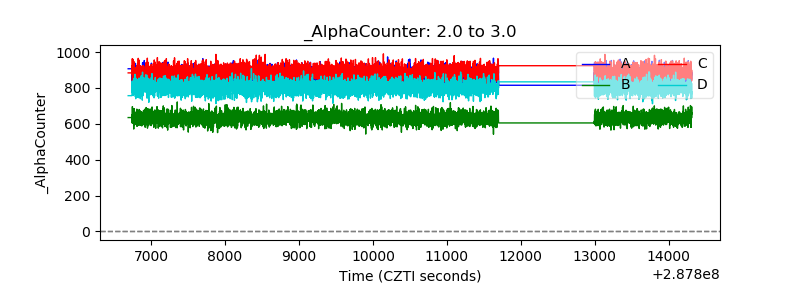 |
| _CPM_Rate | 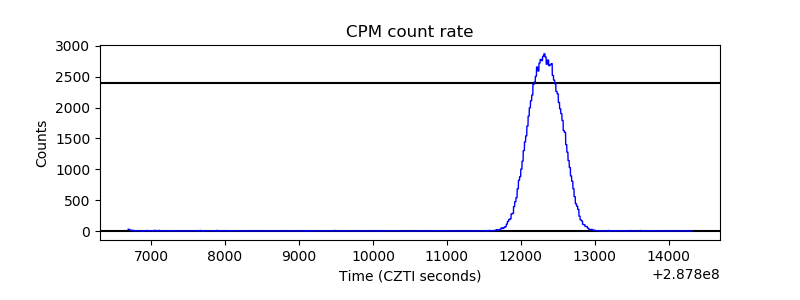 |
| CZT Counter | 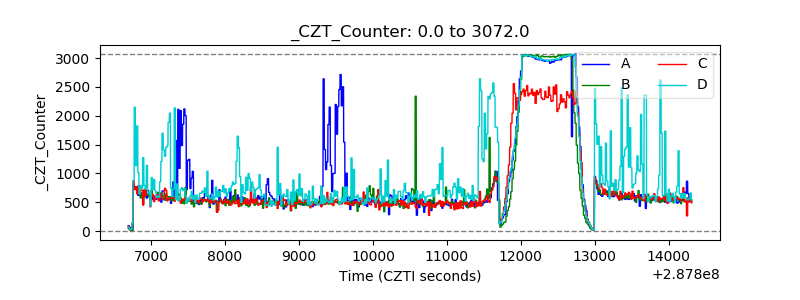 |
| +2.5 Volts monitor |  |
| +5 Volts monitor |  |
| _ROLL_ROT | 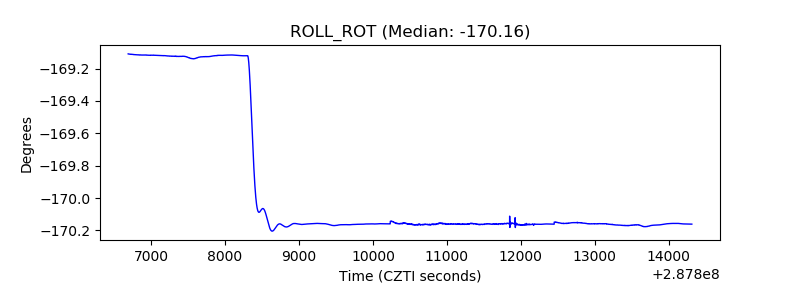 |
| _Roll_DEC | 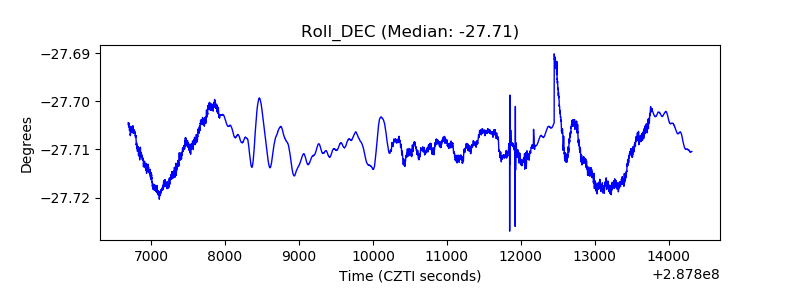 |
| _Roll_RA | 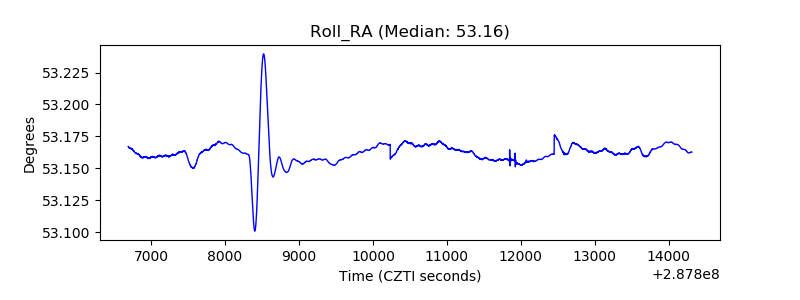 |
| Veto Counter |  |