| Param | Original file | Final file |
|---|---|---|
| Filename | modeM0/AS1A06_006T01_9000002720_18281cztM0_level2.evt | modeM0/AS1A06_006T01_9000002720_18281cztM0_level2_quad_clean.evt |
| Size (bytes) | 521,841,600 | 71,015,040 |
| Size | 497.7 MB | 67.7 MB |
| Events in quadrant A | 3,310,039 | 440,182 |
| Events in quadrant B | 3,412,547 | 444,031 |
| Events in quadrant C | 3,358,998 | 431,674 |
| Events in quadrant D | 5,311,697 | 411,074 |
| Mode SS | |||
|---|---|---|---|
| Quadrant | BADHDUFLAG | Total packets | Discarded packets |
| A | 0 | 122 | 0 |
| B | 0 | 122 | 0 |
| C | 0 | 122 | 0 |
| D | 0 | 122 | 0 |
| Mode M9 | |||
|---|---|---|---|
| Quadrant | BADHDUFLAG | Total packets | Discarded packets |
| A | 0 | 21 | 0 |
| B | 0 | 22 | 0 |
| C | 0 | 22 | 0 |
| D | 0 | 22 | 0 |
| Mode M0 | |||
|---|---|---|---|
| Quadrant | BADHDUFLAG | Total packets | Discarded packets |
| A | 0 | 13412 | 2 |
| B | 0 | 13799 | 2 |
| C | 0 | 13659 | 2 |
| D | 0 | 19959 | 2 |
| Quadrant | Total seconds | Saturated seconds | Saturation percentage |
|---|---|---|---|
| A | 6064 | 103 | 1.698549% |
| B | 6064 | 120 | 1.978892% |
| C | 6064 | 155 | 2.556069% |
| D | 6064 | 423 | 6.975594% |
Noise dominated data is calculated using 1-second bins in cleaned event files. If a bin has >2000 counts, and if more than 50% of those come from <1% of pixels, then it is considered to be noise-dominated and hence unusable.
| Quadrant | # 1 sec bins | Bins with >0 counts | Bins with >2000 counts | High rate bins dominated by noise | Noise dominated (total time) | Noise dominated (detector-on time) | Marked lightcurve |
|---|---|---|---|---|---|---|---|
| A | 7374 | 6065 | 0 | 0 | 0.00% | 0.00% | 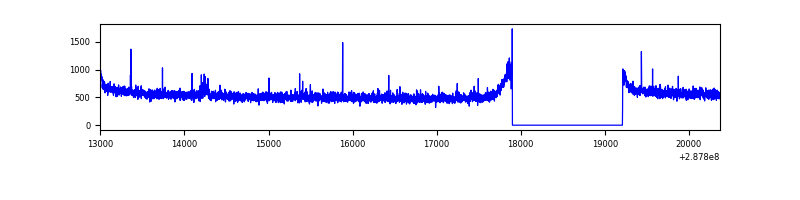 |
| B | 7374 | 6065 | 5 | 5 | 0.07% | 0.08% | 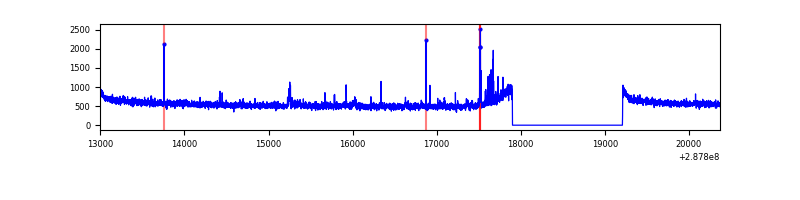 |
| C | 7374 | 6065 | 0 | 0 | 0.00% | 0.00% | 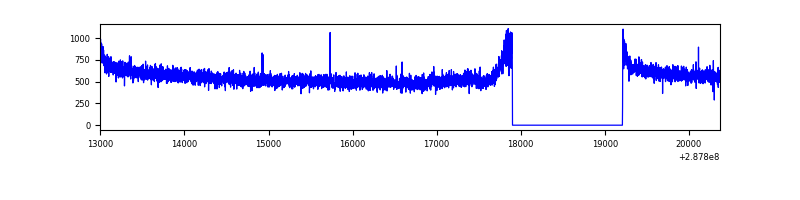 |
| D | 7374 | 6065 | 228 | 228 | 3.09% | 3.76% | 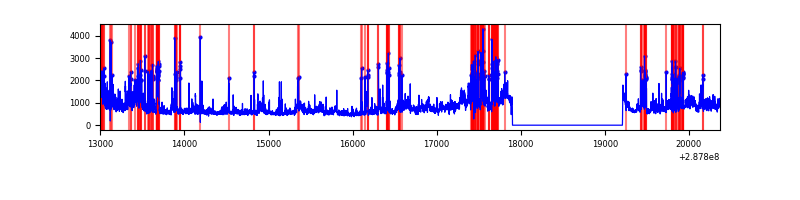 |
Top three noisy pixels from each quadrant. If the there are fewer than three noisy pixels in the level2.evt file, extra rows are filled as -1
| Pixel properties | Quadrant properties | ||||||
|---|---|---|---|---|---|---|---|
| Quadrant | DetID | PixID | Counts | Sigma | Mean | Median | Sigma |
| A | 15 | 174 | 21248 | 121.76 | 850 | 833 | 167.7 |
| A | 8 | 34 | 10476 | 57.51 | 850 | 833 | 167.7 |
| A | 13 | 210 | 8873 | 47.95 | 850 | 833 | 167.7 |
| B | 0 | 197 | 28834 | 176.48 | 850 | 831 | 158.7 |
| B | 4 | 171 | 22041 | 133.67 | 850 | 831 | 158.7 |
| B | 12 | 111 | 17610 | 105.74 | 850 | 831 | 158.7 |
| C | 14 | 238 | 128884 | 684.86 | 817 | 827 | 187.0 |
| C | 3 | 233 | 40625 | 212.84 | 817 | 827 | 187.0 |
| C | 13 | 61 | 5743 | 26.29 | 817 | 827 | 187.0 |
| D | 7 | 238 | 965591 | 4922.35 | 816 | 795 | 196.0 |
| D | 1 | 52 | 784320 | 3997.51 | 816 | 795 | 196.0 |
| D | 13 | 168 | 431130 | 2195.55 | 816 | 795 | 196.0 |
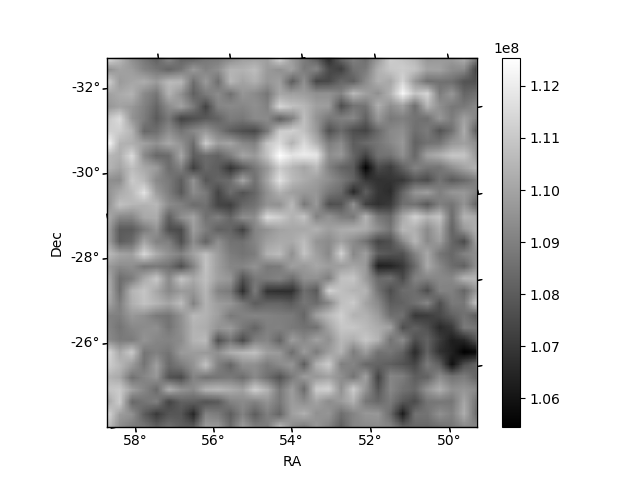
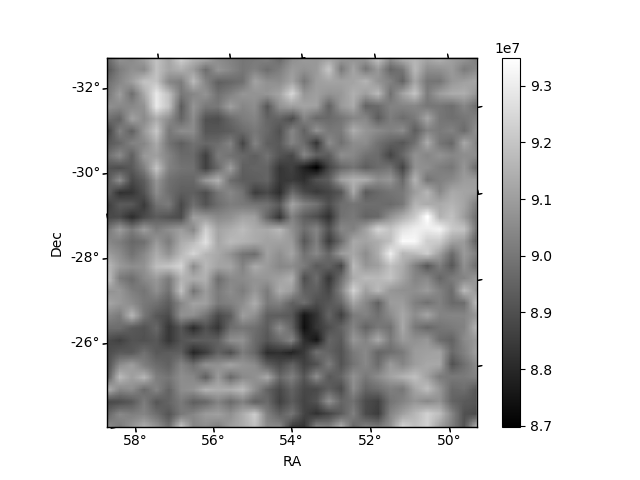
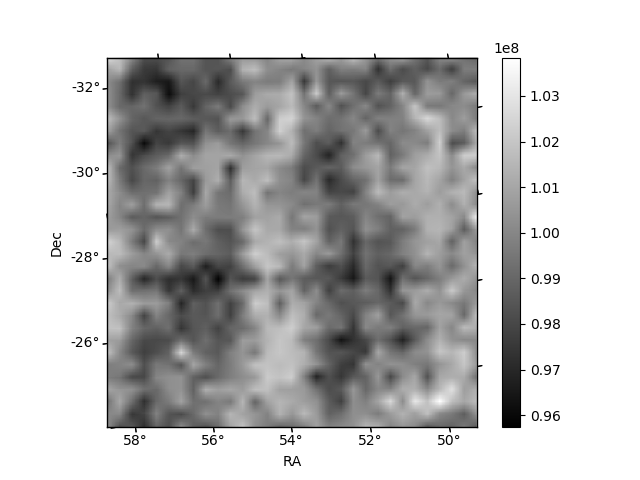
Histogram calculated using DETX and DETY for each event in the final _common_clean file
| Quadrant A |  |
 |
Quadrant B |
|---|---|---|---|
| Quadrant D |  |
 |
Quadrant C |
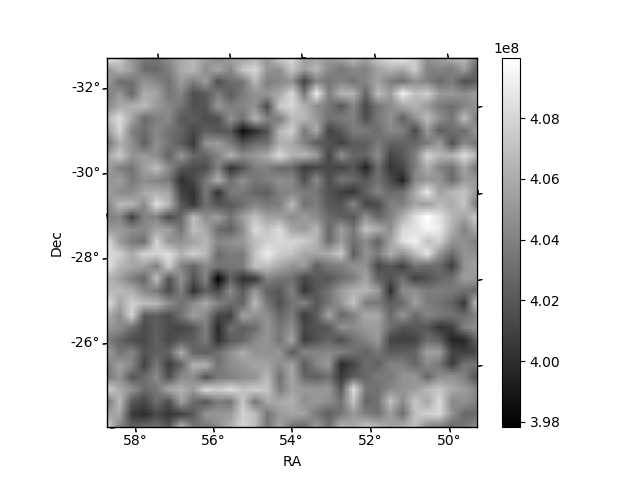
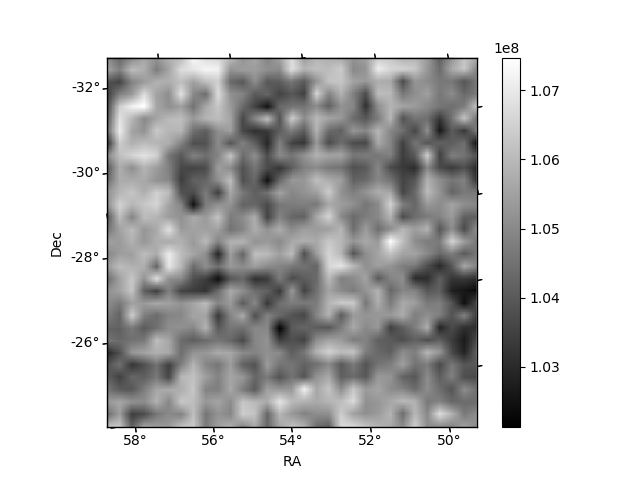
| Plot type | Count rate plots | Images |
|---|---|---|
| Comparison with Poisson distribution Blue bars denote a histogram of data divided into 1 sec bins. Red curve is a Poisson curve with rate = median count rate of data. |
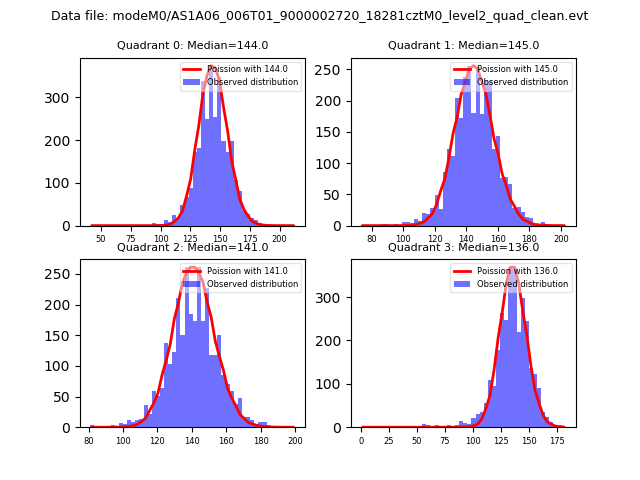 |
 |
| Quadrant-wise count rates Data is divided into 100 sec bins |
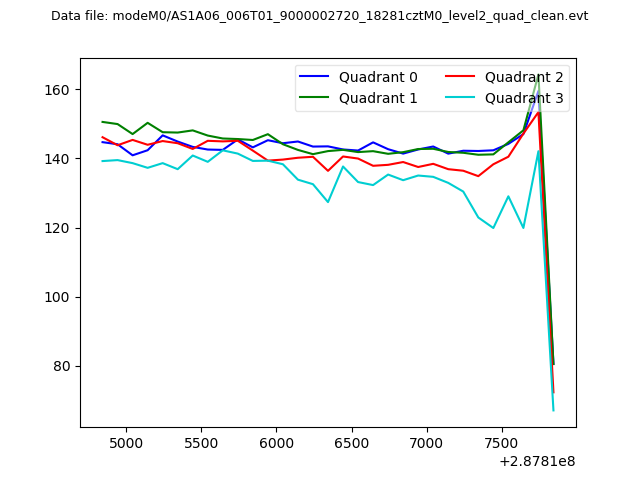 |
|
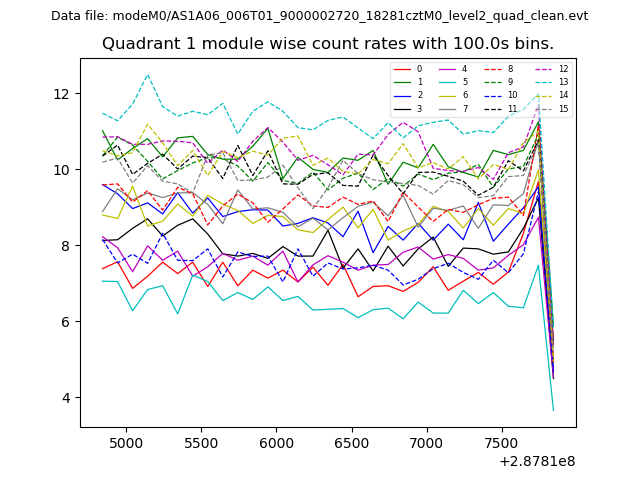
| Module-wise count rates for Quadrant A Data is divided into 100 sec bins |
 |
 |
| Module-wise count rates for Quadrant B Data is divided into 100 sec bins |
 |
 |
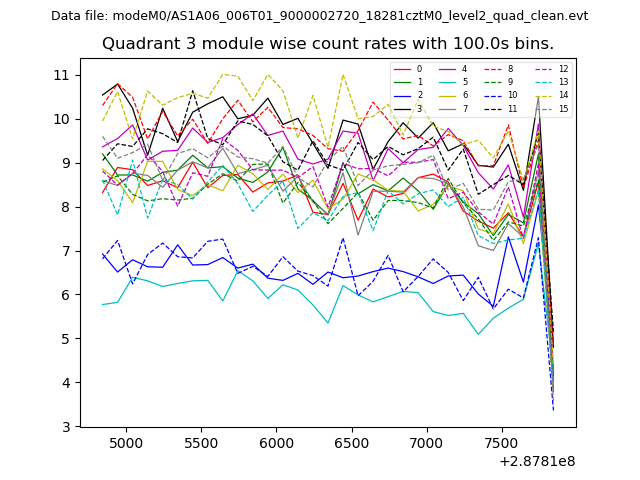
| Module-wise count rates for Quadrant C Data is divided into 100 sec bins |
 |
 |
| Module-wise count rates for Quadrant D Data is divided into 100 sec bins |
 |
 |
| Parameter | Plot |
|---|---|
| CZT HV Monitor |  |
| D_VDD | 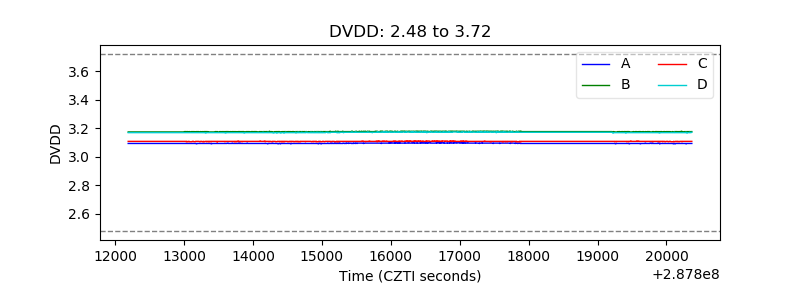 |
| Temperature 1 | 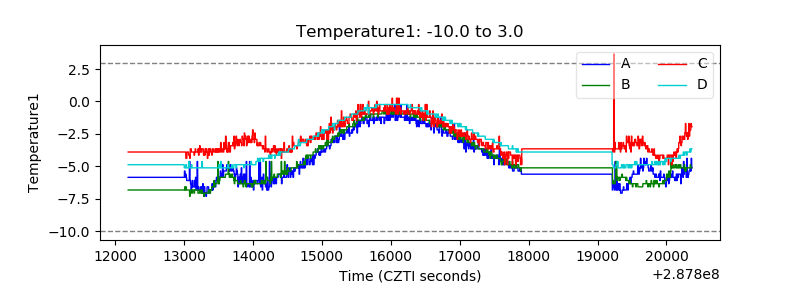 |
| Veto HV Monitor | 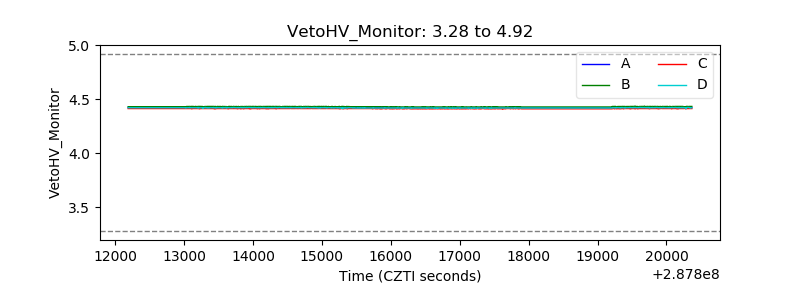 |
| Veto LLD | 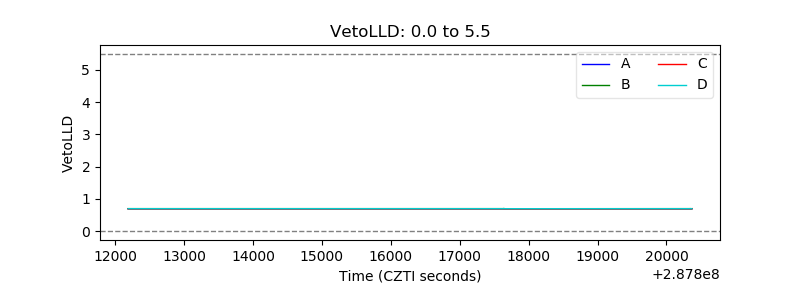 |
| Alpha Counter | 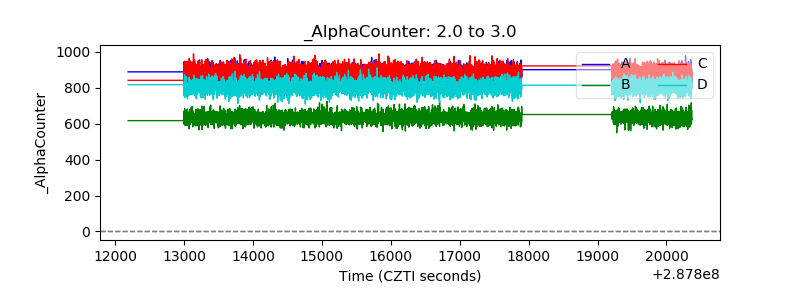 |
| _CPM_Rate | 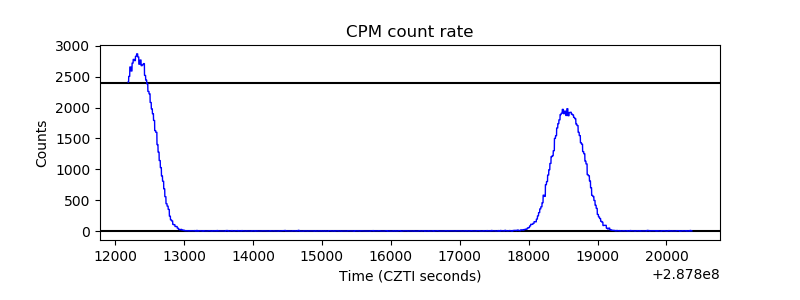 |
| CZT Counter | 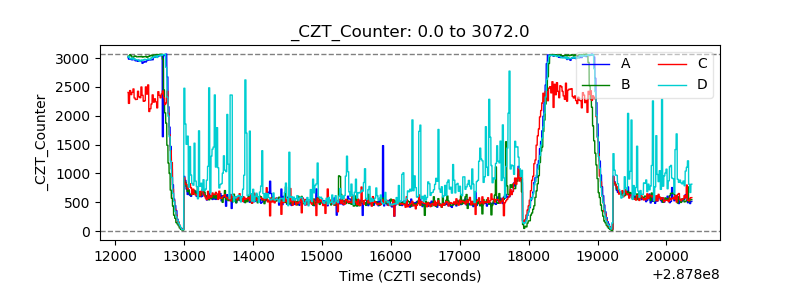 |
| +2.5 Volts monitor |  |
| +5 Volts monitor |  |
| _ROLL_ROT | 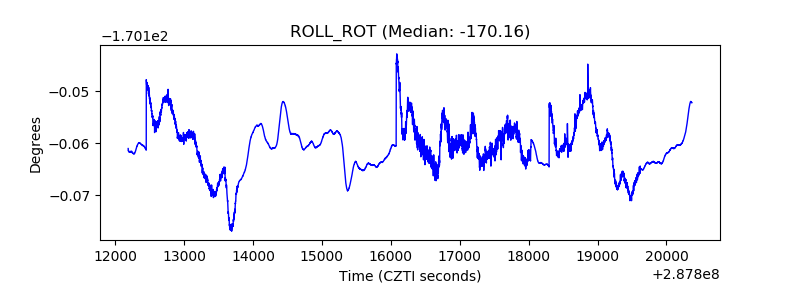 |
| _Roll_DEC | 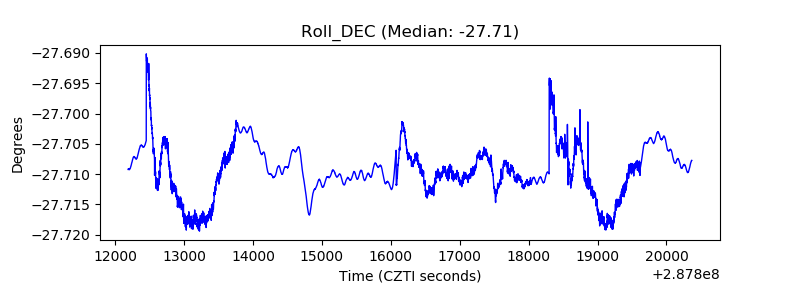 |
| _Roll_RA | 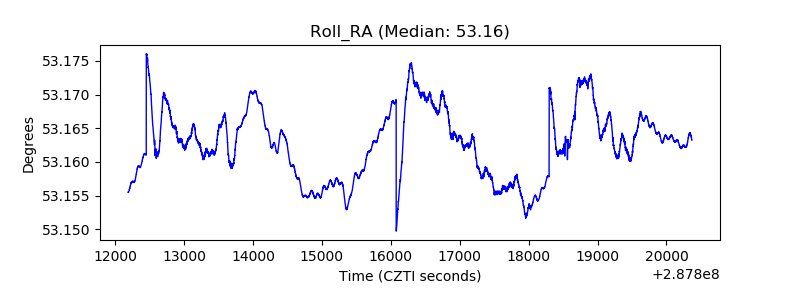 |
| Veto Counter | 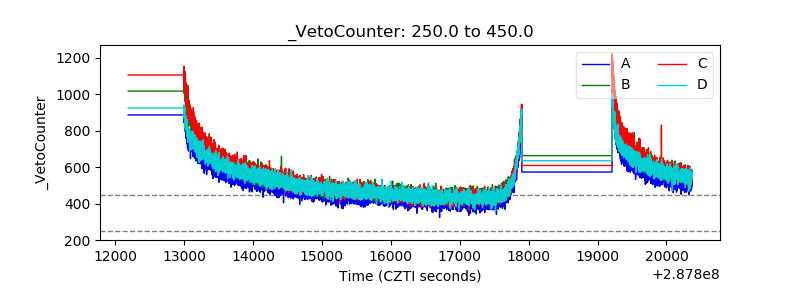 |