| Param | Original file | Final file |
|---|---|---|
| Filename | modeM0/AS1A06_006T01_9000002720_18283cztM0_level2.evt | modeM0/AS1A06_006T01_9000002720_18283cztM0_level2_quad_clean.evt |
| Size (bytes) | 652,665,600 | 91,730,880 |
| Size | 622.4 MB | 87.5 MB |
| Events in quadrant A | 3,875,297 | 599,881 |
| Events in quadrant B | 3,547,409 | 606,905 |
| Events in quadrant C | 3,416,052 | 589,107 |
| Events in quadrant D | 8,483,093 | 523,708 |
| Mode SS | |||
|---|---|---|---|
| Quadrant | BADHDUFLAG | Total packets | Discarded packets |
| A | 0 | 134 | 0 |
| B | 0 | 134 | 0 |
| C | 0 | 134 | 0 |
| D | 0 | 134 | 0 |
| Mode M9 | |||
|---|---|---|---|
| Quadrant | BADHDUFLAG | Total packets | Discarded packets |
| A | 0 | 13 | 0 |
| B | 0 | 14 | 0 |
| C | 0 | 14 | 0 |
| D | 0 | 14 | 0 |
| Mode M0 | |||
|---|---|---|---|
| Quadrant | BADHDUFLAG | Total packets | Discarded packets |
| A | 0 | 15444 | 2 |
| B | 0 | 14403 | 2 |
| C | 0 | 14107 | 2 |
| D | 0 | 29769 | 2 |
| Quadrant | Total seconds | Saturated seconds | Saturation percentage |
|---|---|---|---|
| A | 6565 | 363 | 5.529322% |
| B | 6565 | 136 | 2.071592% |
| C | 6565 | 181 | 2.757045% |
| D | 6565 | 1051 | 16.009139% |
Noise dominated data is calculated using 1-second bins in cleaned event files. If a bin has >2000 counts, and if more than 50% of those come from <1% of pixels, then it is considered to be noise-dominated and hence unusable.
| Quadrant | # 1 sec bins | Bins with >0 counts | Bins with >2000 counts | High rate bins dominated by noise | Noise dominated (total time) | Noise dominated (detector-on time) | Marked lightcurve |
|---|---|---|---|---|---|---|---|
| A | 7645 | 6566 | 218 | 218 | 2.85% | 3.32% | 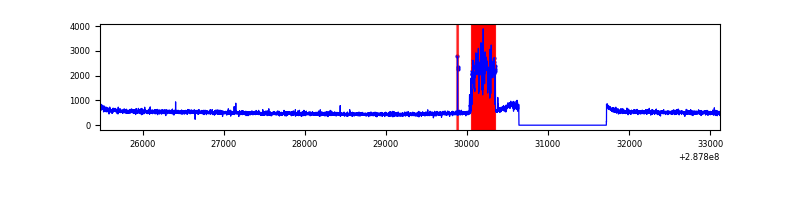 |
| B | 7645 | 6566 | 4 | 4 | 0.05% | 0.06% | 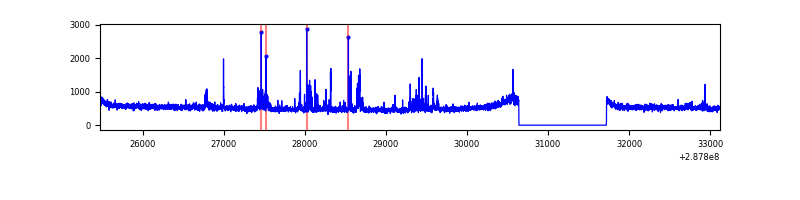 |
| C | 7645 | 6566 | 8 | 8 | 0.10% | 0.12% | 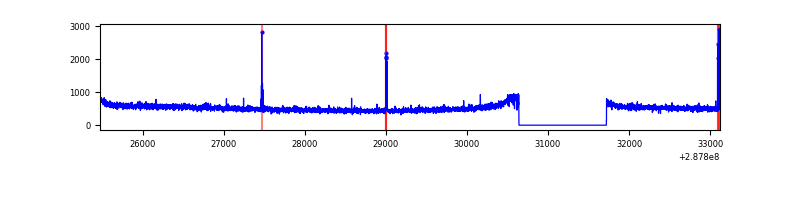 |
| D | 7645 | 6566 | 972 | 972 | 12.71% | 14.80% | 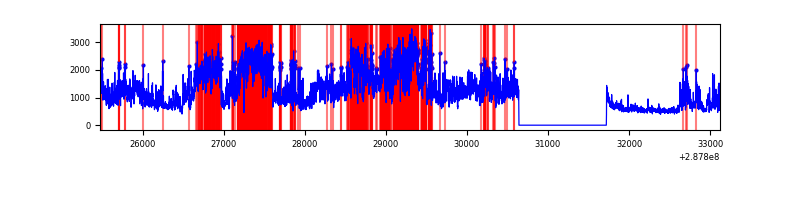 |
Top three noisy pixels from each quadrant. If the there are fewer than three noisy pixels in the level2.evt file, extra rows are filled as -1
| Pixel properties | Quadrant properties | ||||||
|---|---|---|---|---|---|---|---|
| Quadrant | DetID | PixID | Counts | Sigma | Mean | Median | Sigma |
| A | 15 | 174 | 580363 | 3359.21 | 856 | 835 | 172.5 |
| A | 0 | 226 | 7643 | 39.46 | 856 | 835 | 172.5 |
| A | 12 | 194 | 6369 | 32.08 | 856 | 835 | 172.5 |
| B | 7 | 220 | 54538 | 330.2 | 859 | 840 | 162.6 |
| B | 0 | 190 | 43491 | 262.27 | 859 | 840 | 162.6 |
| B | 0 | 244 | 21743 | 128.54 | 859 | 840 | 162.6 |
| C | 14 | 238 | 127407 | 657.83 | 825 | 831 | 192.4 |
| C | 0 | 207 | 49739 | 254.18 | 825 | 831 | 192.4 |
| C | 8 | 128 | 9269 | 43.85 | 825 | 831 | 192.4 |
| D | 7 | 238 | 3916290 | 20101.77 | 808 | 786 | 194.8 |
| D | 13 | 168 | 1075018 | 5514.99 | 808 | 786 | 194.8 |
| D | 1 | 52 | 329671 | 1688.46 | 808 | 786 | 194.8 |
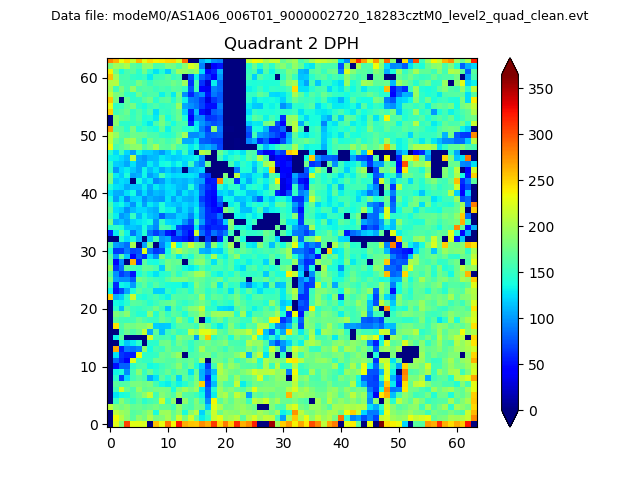
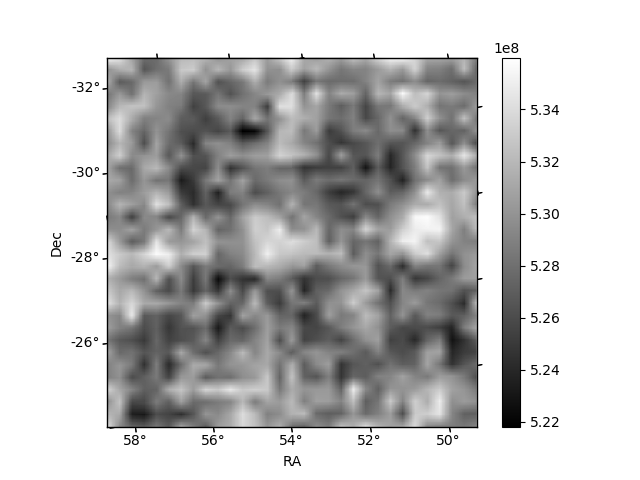
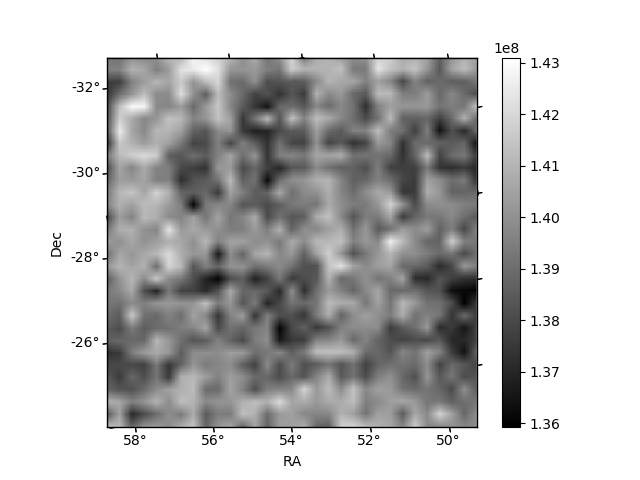
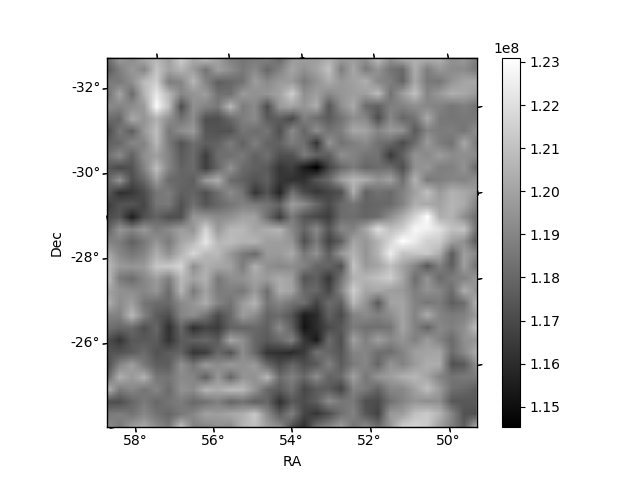
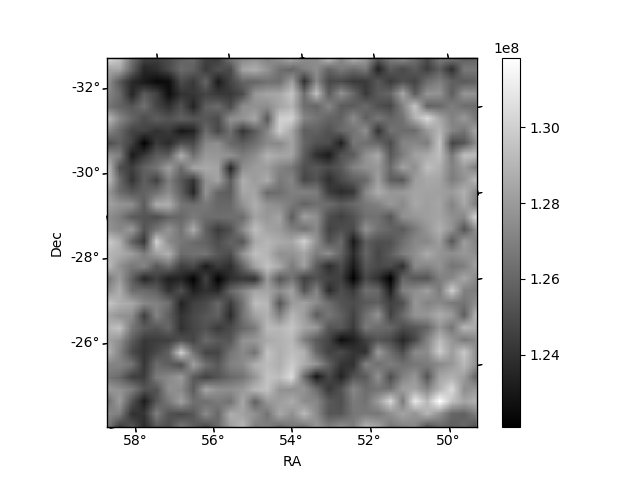
Histogram calculated using DETX and DETY for each event in the final _common_clean file
| Quadrant A | 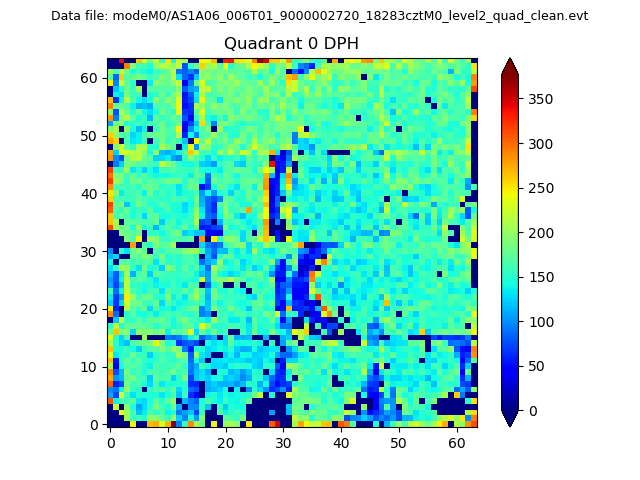 |
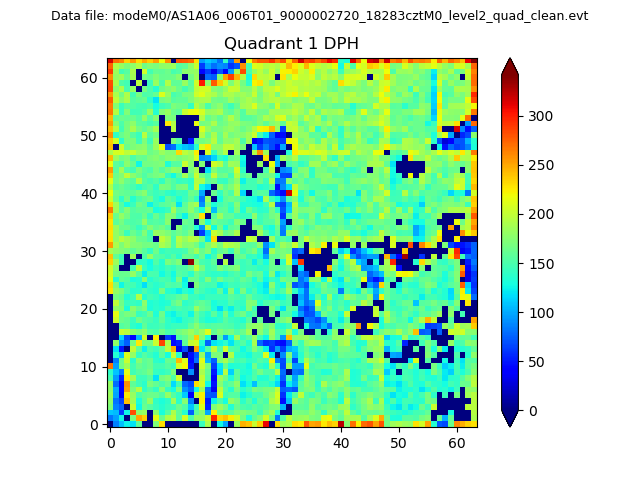 |
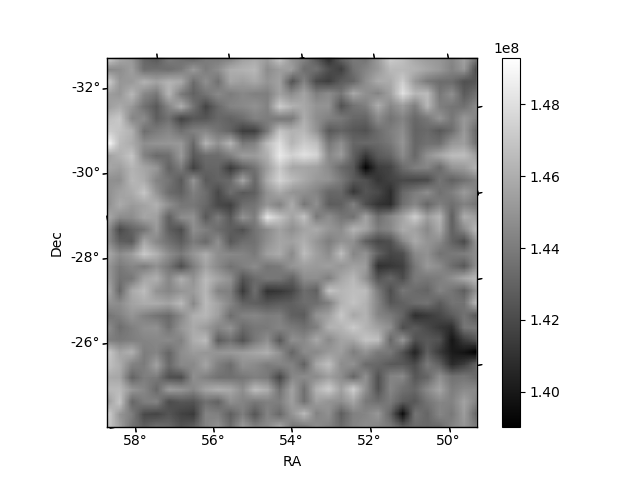
Quadrant B |
|---|---|---|---|
| Quadrant D | 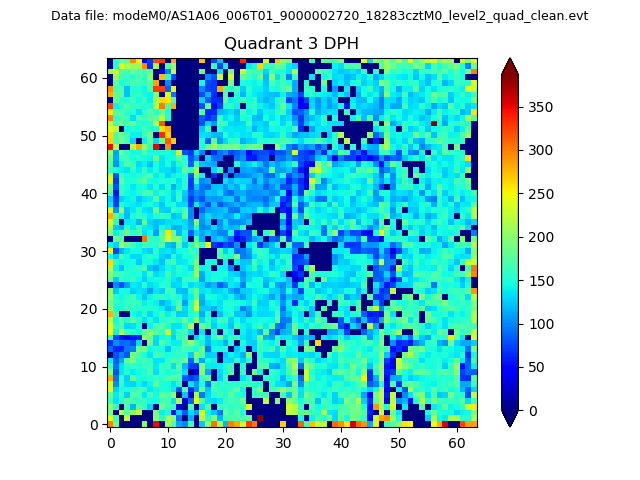 |
 |
Quadrant C |
| Plot type | Count rate plots | Images |
|---|---|---|
| Comparison with Poisson distribution Blue bars denote a histogram of data divided into 1 sec bins. Red curve is a Poisson curve with rate = median count rate of data. |
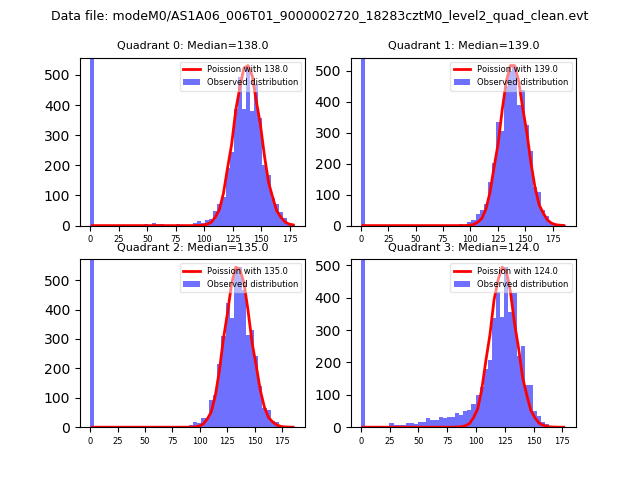 |
 |
| Quadrant-wise count rates Data is divided into 100 sec bins |
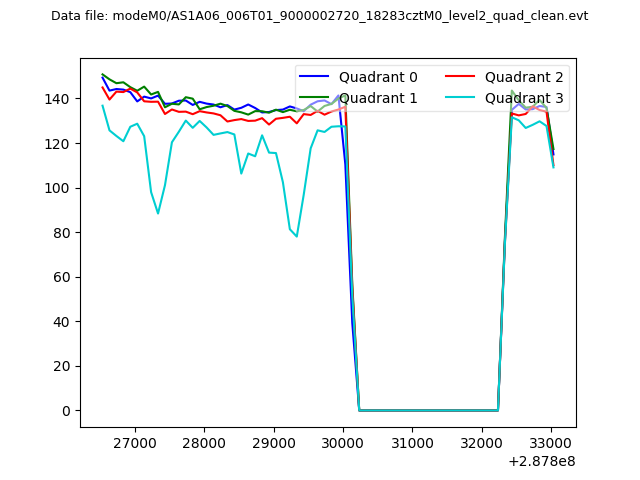 |
|
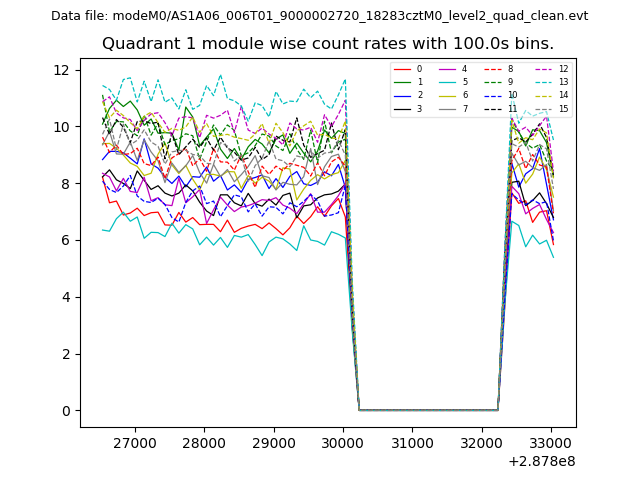
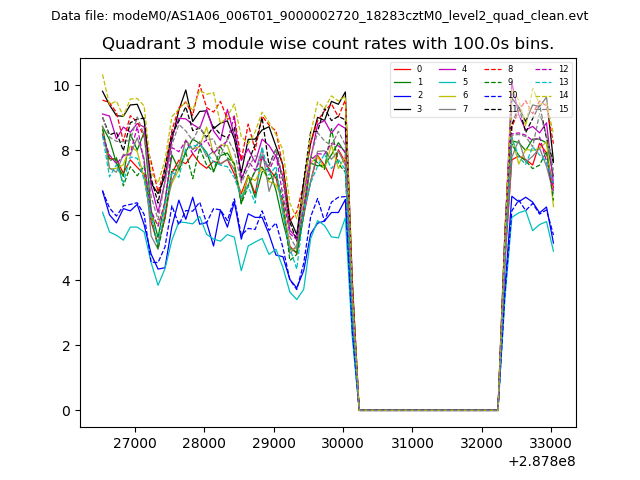
| Module-wise count rates for Quadrant A Data is divided into 100 sec bins |
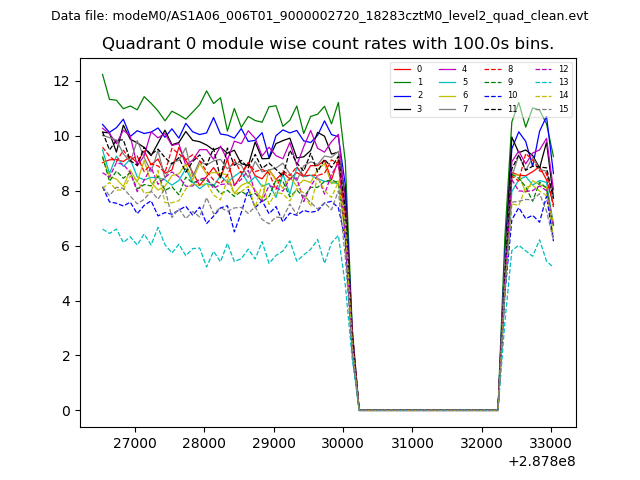 |
 |
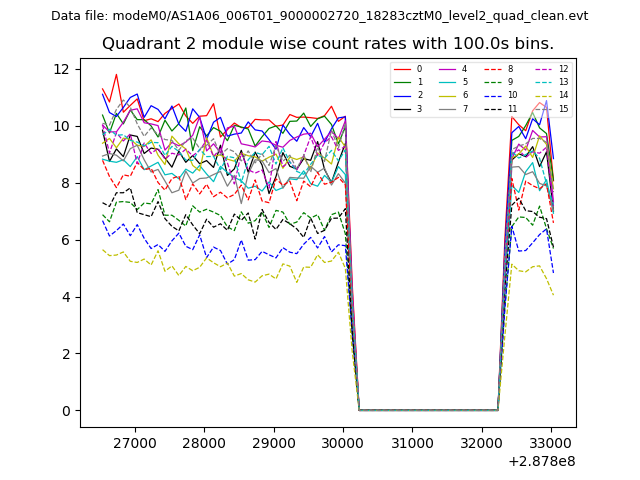
| Module-wise count rates for Quadrant B Data is divided into 100 sec bins |
 |
 |
| Module-wise count rates for Quadrant C Data is divided into 100 sec bins |
 |
 |
| Module-wise count rates for Quadrant D Data is divided into 100 sec bins |
 |
 |
| Parameter | Plot |
|---|---|
| CZT HV Monitor | 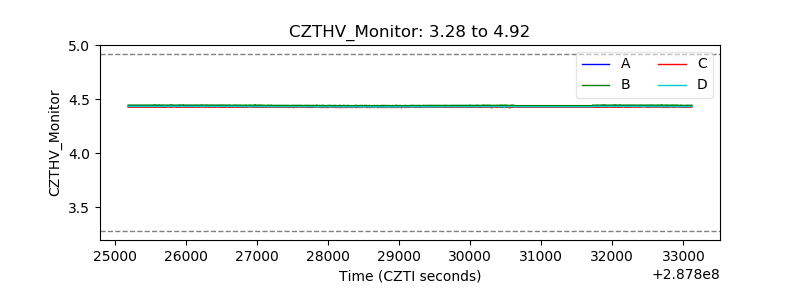 |
| D_VDD | 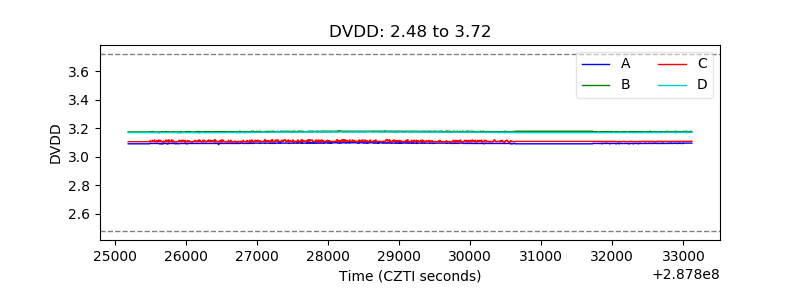 |
| Temperature 1 | 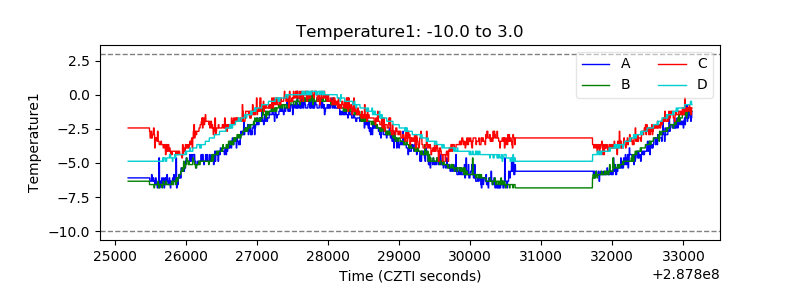 |
| Veto HV Monitor |  |
| Veto LLD | 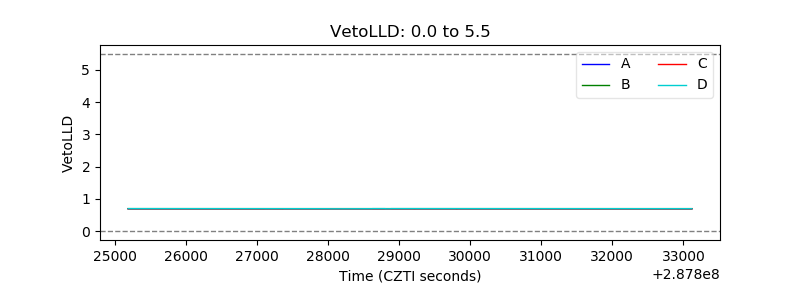 |
| Alpha Counter | 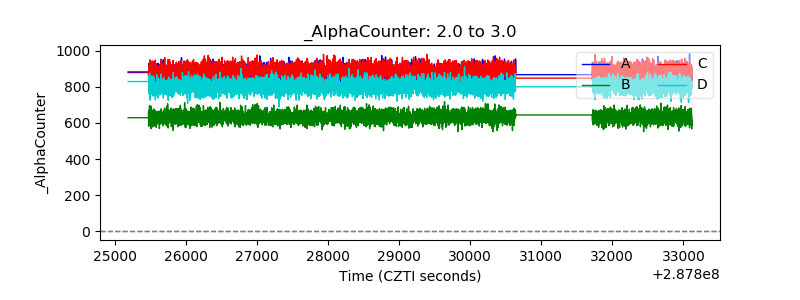 |
| _CPM_Rate | 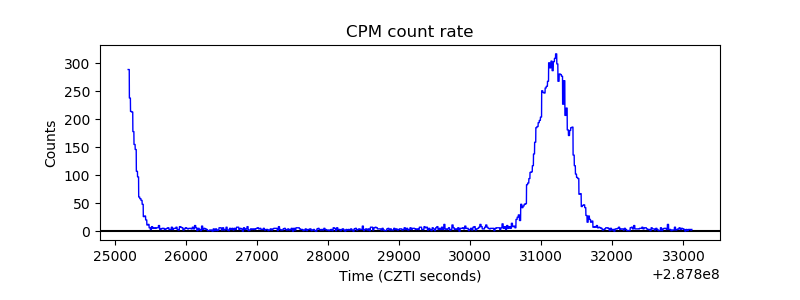 |
| CZT Counter | 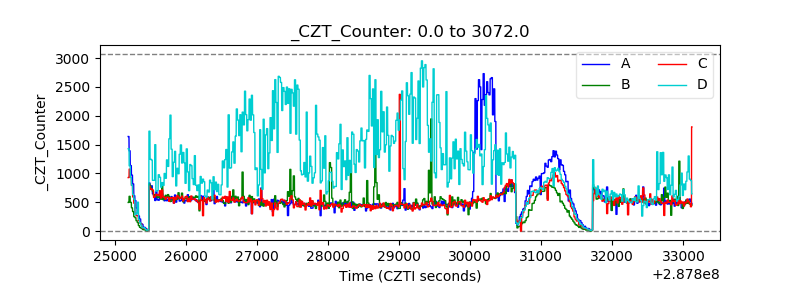 |
| +2.5 Volts monitor | 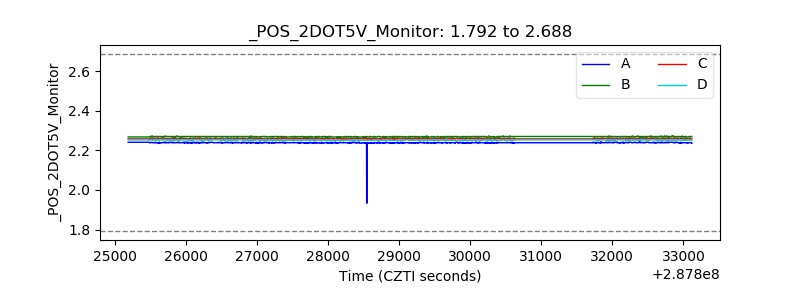 |
| +5 Volts monitor |  |
| _ROLL_ROT | 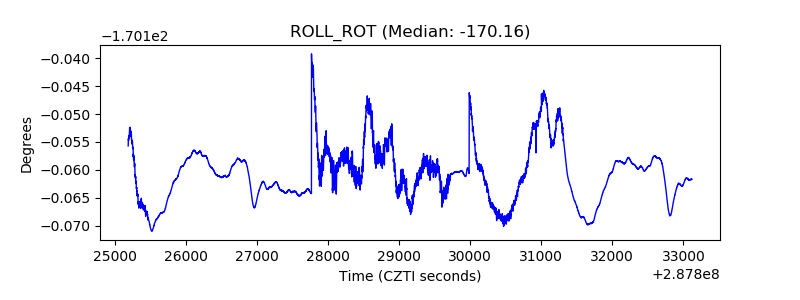 |
| _Roll_DEC | 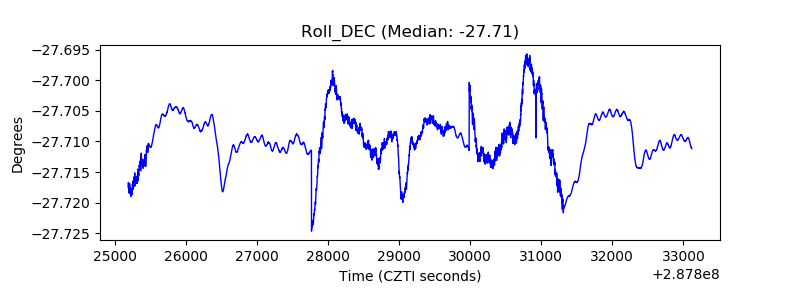 |
| _Roll_RA | 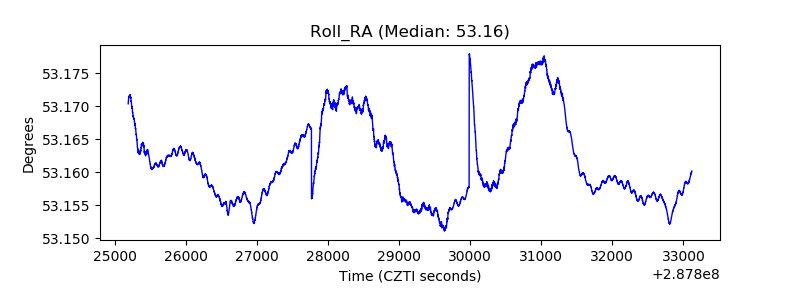 |
| Veto Counter | 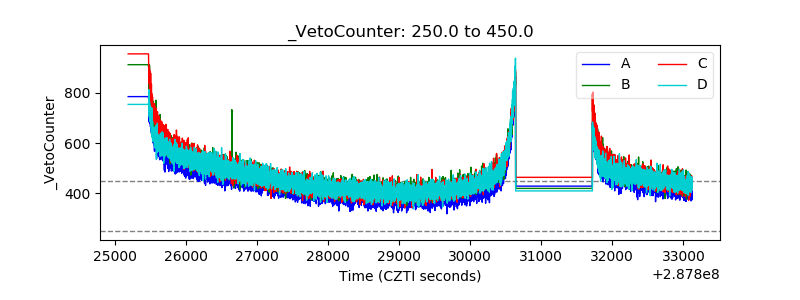 |