| Param | Original file | Final file |
|---|---|---|
| Filename | modeM0/AS1A06_006T01_9000002720_18284cztM0_level2.evt | modeM0/AS1A06_006T01_9000002720_18284cztM0_level2_quad_clean.evt |
| Size (bytes) | 668,442,240 | 92,678,400 |
| Size | 637.5 MB | 88.4 MB |
| Events in quadrant A | 3,242,340 | 626,849 |
| Events in quadrant B | 3,672,421 | 623,430 |
| Events in quadrant C | 3,409,018 | 611,208 |
| Events in quadrant D | 9,468,693 | 479,720 |
| Mode SS | |||
|---|---|---|---|
| Quadrant | BADHDUFLAG | Total packets | Discarded packets |
| A | 0 | 134 | 0 |
| B | 0 | 134 | 0 |
| C | 0 | 134 | 0 |
| D | 0 | 134 | 0 |
| Mode M9 | |||
|---|---|---|---|
| Quadrant | BADHDUFLAG | Total packets | Discarded packets |
| A | 0 | 8 | 0 |
| B | 0 | 8 | 0 |
| C | 0 | 8 | 0 |
| D | 0 | 8 | 0 |
| Mode M0 | |||
|---|---|---|---|
| Quadrant | BADHDUFLAG | Total packets | Discarded packets |
| A | 0 | 13778 | 1 |
| B | 0 | 14937 | 1 |
| C | 0 | 14305 | 1 |
| D | 0 | 32713 | 1 |
| Quadrant | Total seconds | Saturated seconds | Saturation percentage |
|---|---|---|---|
| A | 6670 | 68 | 1.019490% |
| B | 6671 | 177 | 2.653275% |
| C | 6671 | 152 | 2.278519% |
| D | 6671 | 2125 | 31.854295% |
Noise dominated data is calculated using 1-second bins in cleaned event files. If a bin has >2000 counts, and if more than 50% of those come from <1% of pixels, then it is considered to be noise-dominated and hence unusable.
| Quadrant | # 1 sec bins | Bins with >0 counts | Bins with >2000 counts | High rate bins dominated by noise | Noise dominated (total time) | Noise dominated (detector-on time) | Marked lightcurve |
|---|---|---|---|---|---|---|---|
| A | 7445 | 6671 | 4 | 4 | 0.05% | 0.06% | 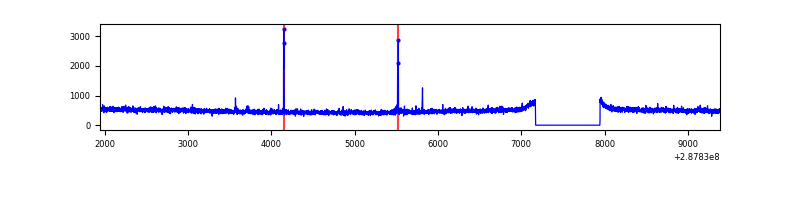 |
| B | 7446 | 6672 | 79 | 79 | 1.06% | 1.18% | 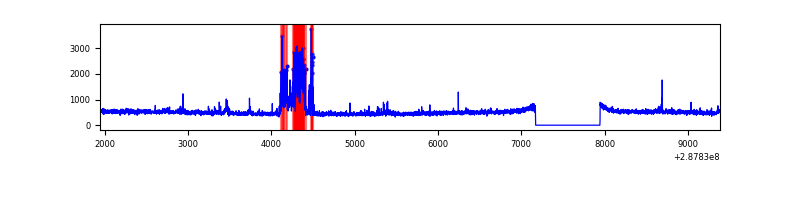 |
| C | 7446 | 6672 | 39 | 39 | 0.52% | 0.58% | 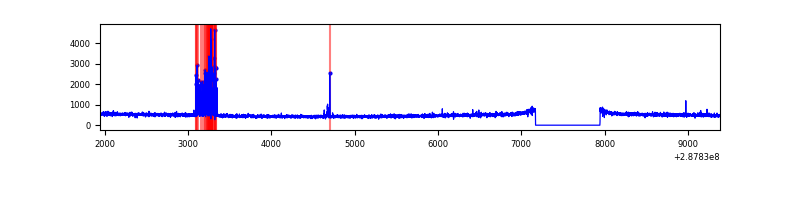 |
| D | 7446 | 6672 | 1749 | 1749 | 23.49% | 26.21% | 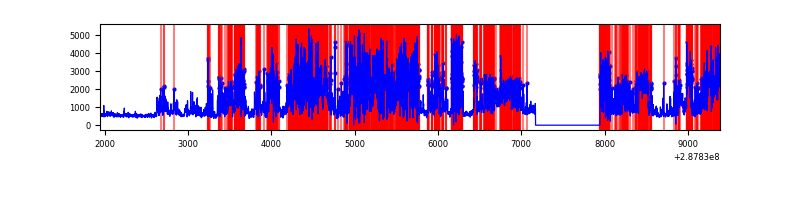 |
Top three noisy pixels from each quadrant. If the there are fewer than three noisy pixels in the level2.evt file, extra rows are filled as -1
| Pixel properties | Quadrant properties | ||||||
|---|---|---|---|---|---|---|---|
| Quadrant | DetID | PixID | Counts | Sigma | Mean | Median | Sigma |
| A | 15 | 174 | 42433 | 246.41 | 831 | 813 | 168.9 |
| A | 0 | 226 | 7382 | 38.89 | 831 | 813 | 168.9 |
| A | 12 | 194 | 6194 | 31.86 | 831 | 813 | 168.9 |
| B | 0 | 190 | 383891 | 2414.11 | 822 | 804 | 158.7 |
| B | 12 | 111 | 17835 | 107.32 | 822 | 804 | 158.7 |
| B | 7 | 220 | 15525 | 92.77 | 822 | 804 | 158.7 |
| C | 0 | 207 | 207740 | 1127.63 | 788 | 792 | 183.5 |
| C | 14 | 238 | 121852 | 659.64 | 788 | 792 | 183.5 |
| C | 13 | 61 | 5466 | 25.47 | 788 | 792 | 183.5 |
| D | 1 | 52 | 3728722 | 22311.02 | 683 | 664 | 167.1 |
| D | 7 | 238 | 2116543 | 12662.74 | 683 | 664 | 167.1 |
| D | 13 | 168 | 865817 | 5177.62 | 683 | 664 | 167.1 |
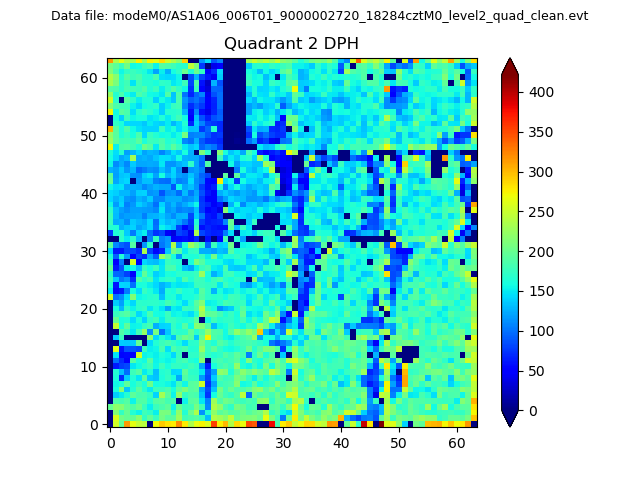
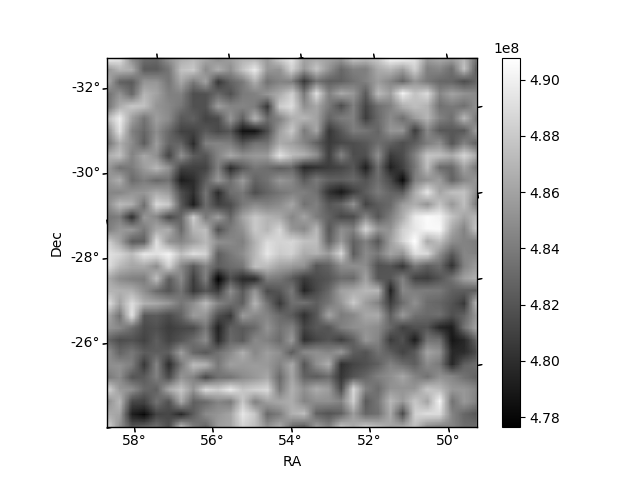
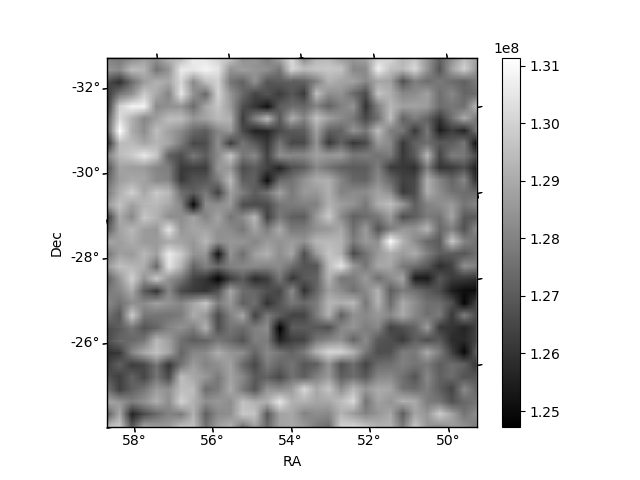
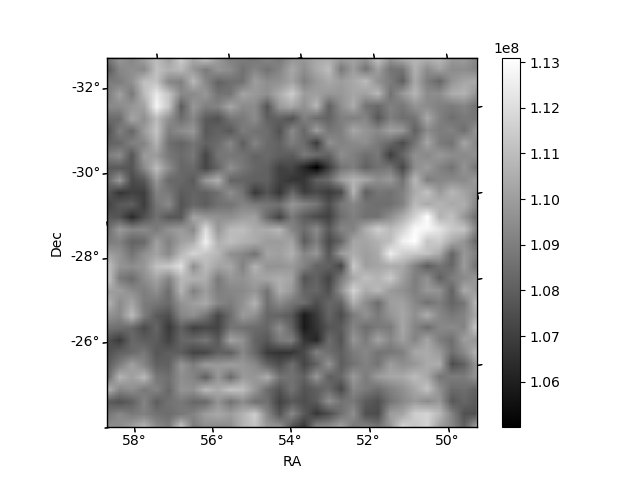
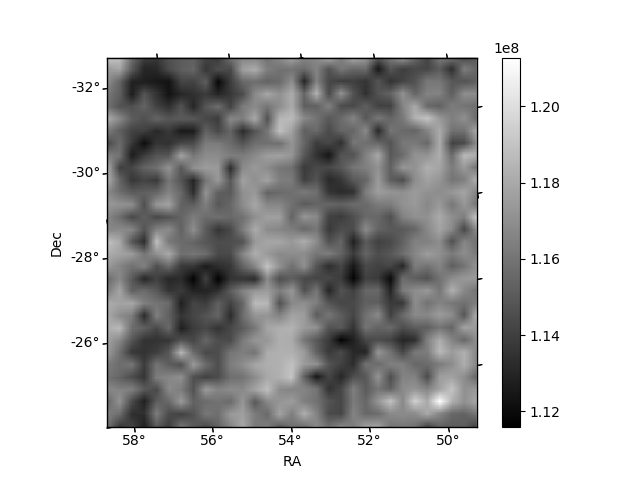
Histogram calculated using DETX and DETY for each event in the final _common_clean file
| Quadrant A | 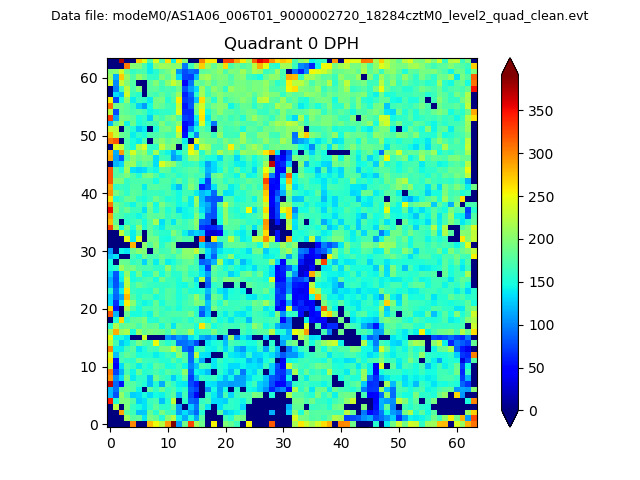 |
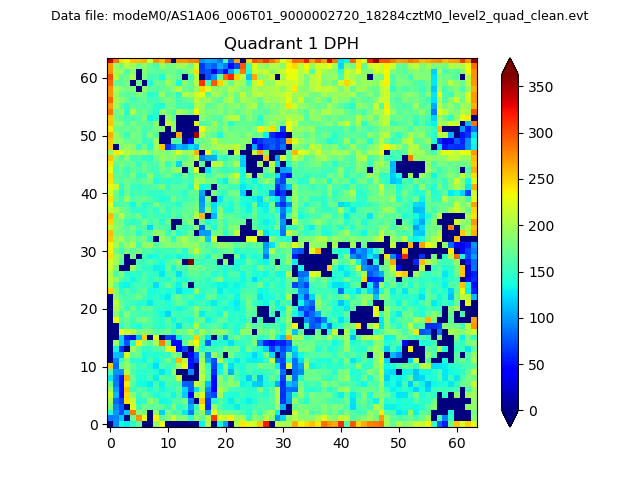 |
Quadrant B |
|---|---|---|---|
| Quadrant D | 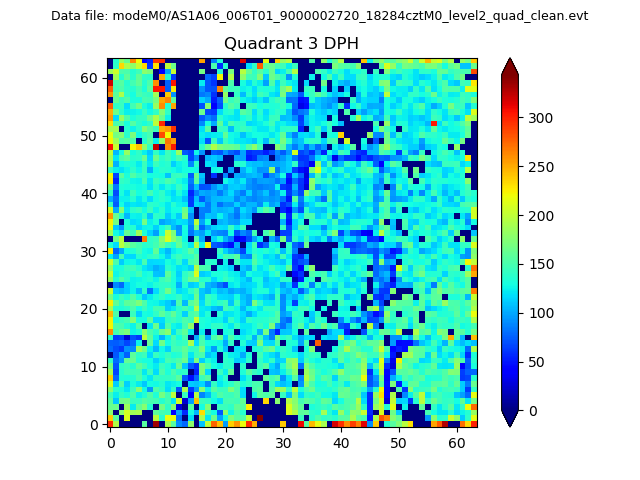 |
 |
Quadrant C |
| Plot type | Count rate plots | Images |
|---|---|---|
| Comparison with Poisson distribution Blue bars denote a histogram of data divided into 1 sec bins. Red curve is a Poisson curve with rate = median count rate of data. |
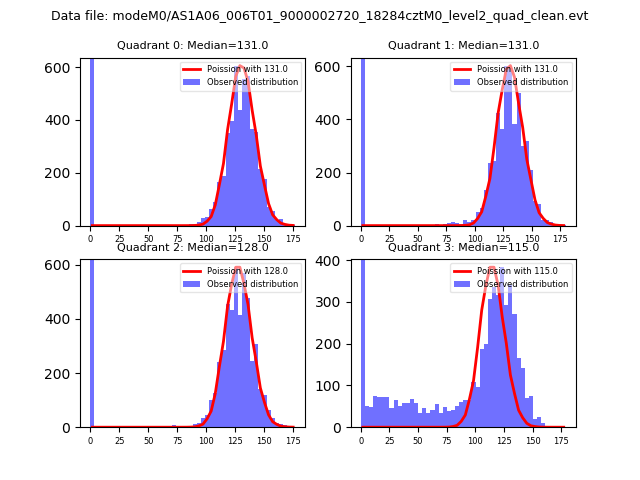 |
 |
| Quadrant-wise count rates Data is divided into 100 sec bins |
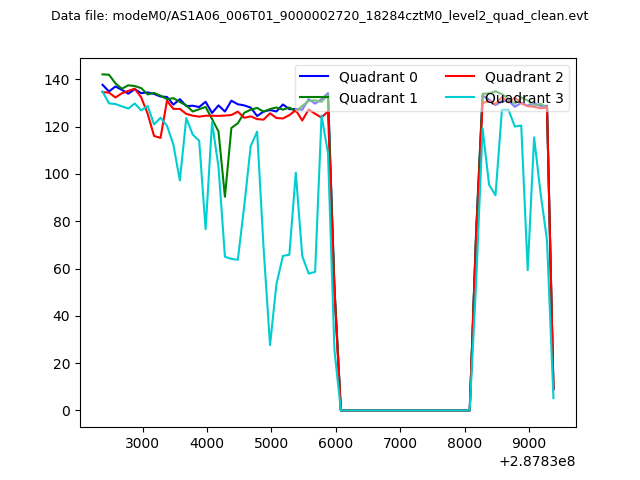 |
|
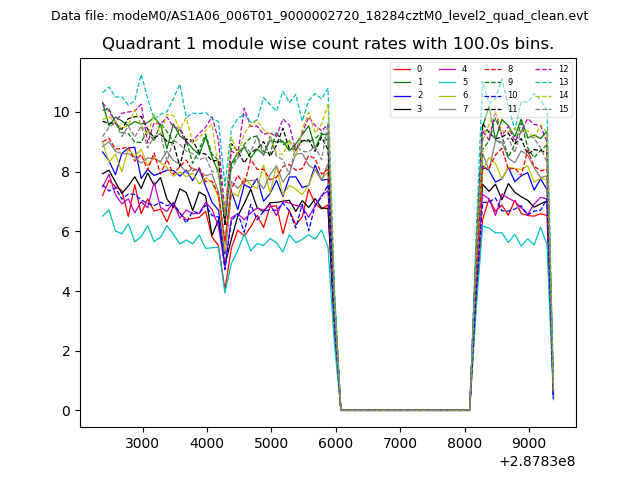
| Module-wise count rates for Quadrant A Data is divided into 100 sec bins |
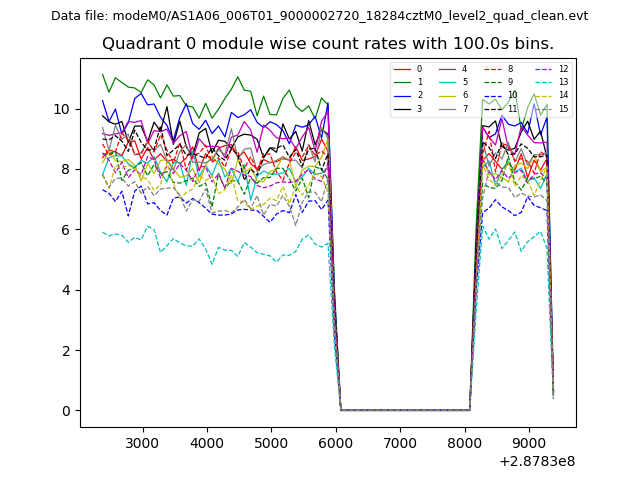 |
 |
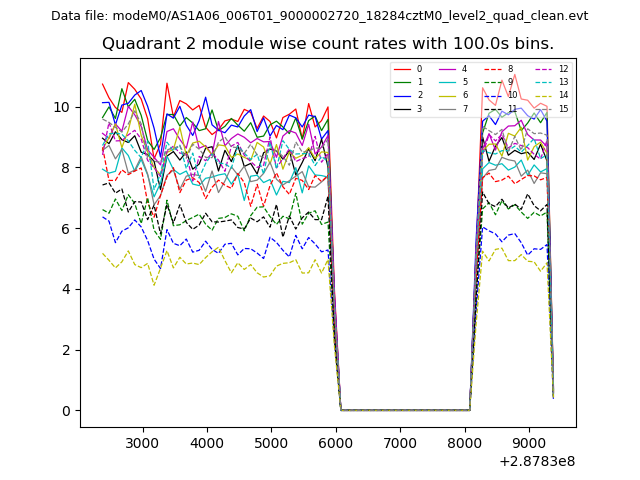
| Module-wise count rates for Quadrant B Data is divided into 100 sec bins |
 |
 |
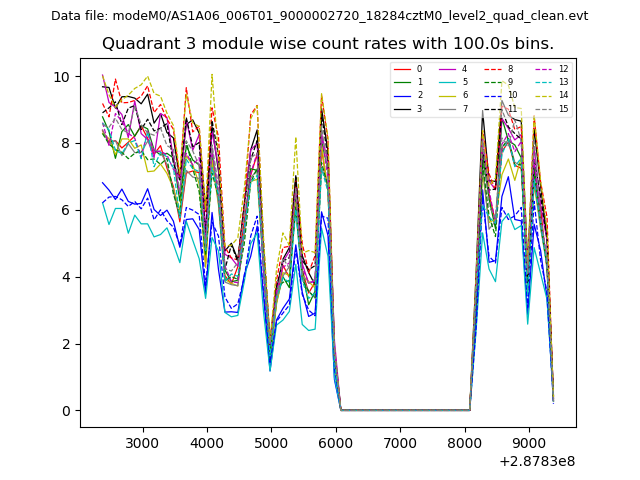
| Module-wise count rates for Quadrant C Data is divided into 100 sec bins |
 |
 |
| Module-wise count rates for Quadrant D Data is divided into 100 sec bins |
 |
 |
| Parameter | Plot |
|---|---|
| CZT HV Monitor | 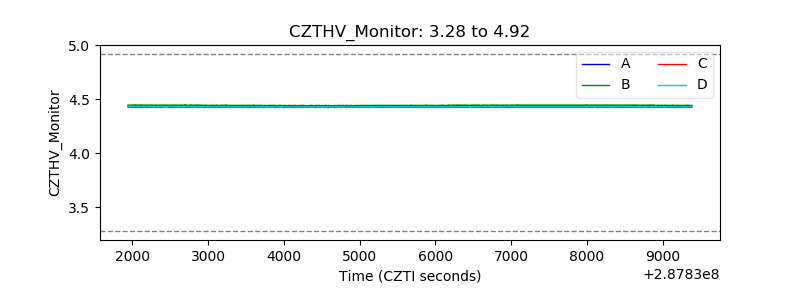 |
| D_VDD | 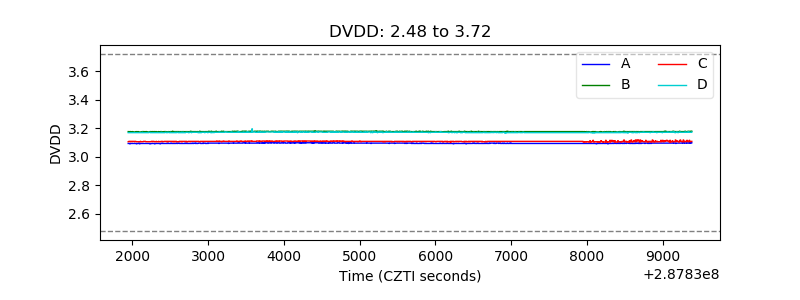 |
| Temperature 1 | 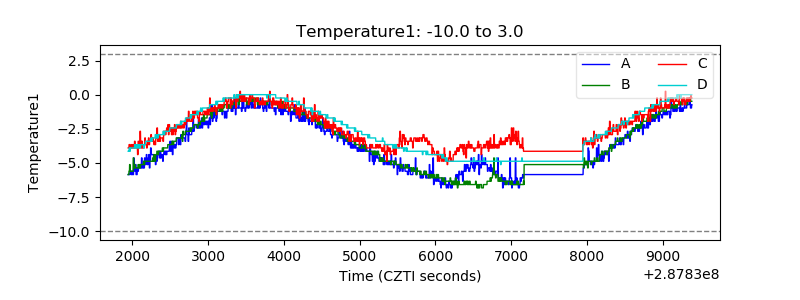 |
| Veto HV Monitor | 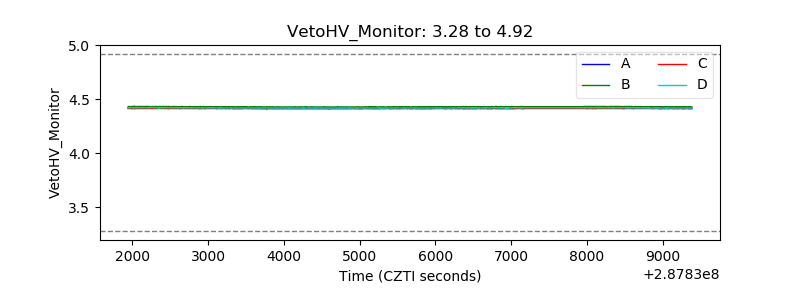 |
| Veto LLD |  |
| Alpha Counter | 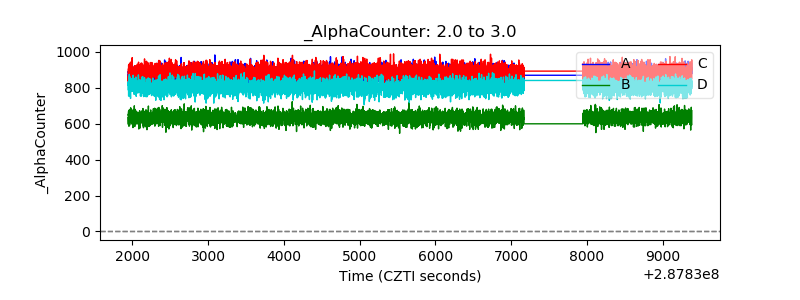 |
| _CPM_Rate | 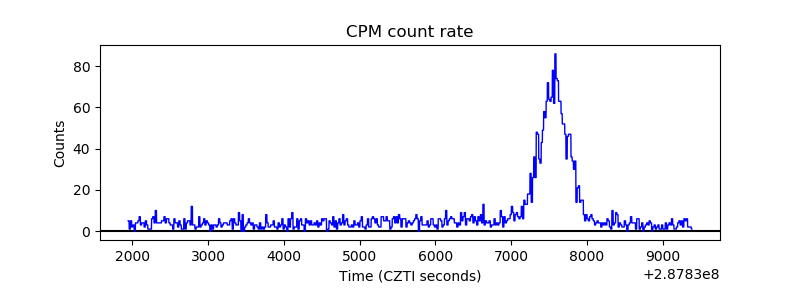 |
| CZT Counter | 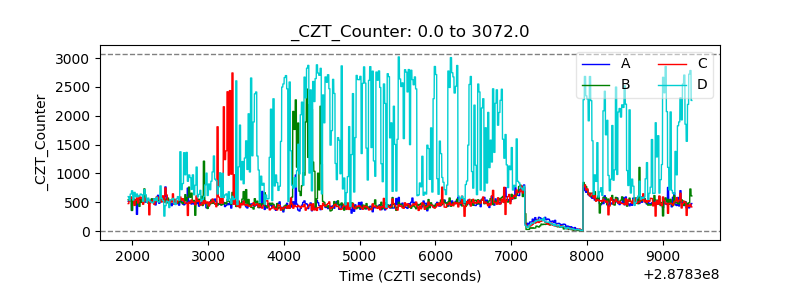 |
| +2.5 Volts monitor | 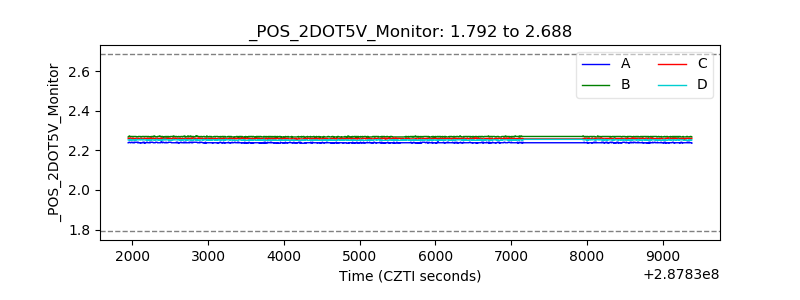 |
| +5 Volts monitor |  |
| _ROLL_ROT | 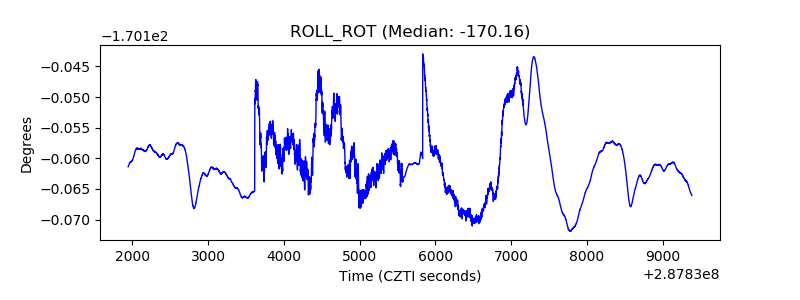 |
| _Roll_DEC | 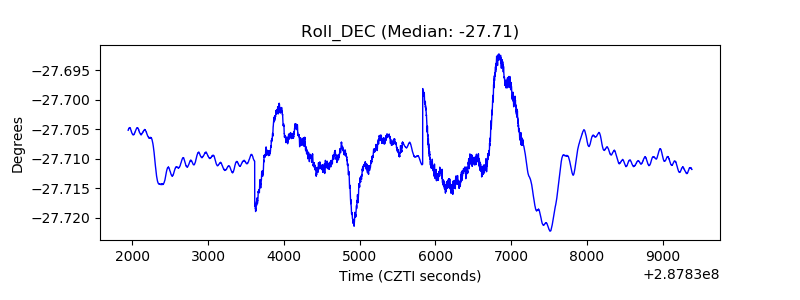 |
| _Roll_RA | 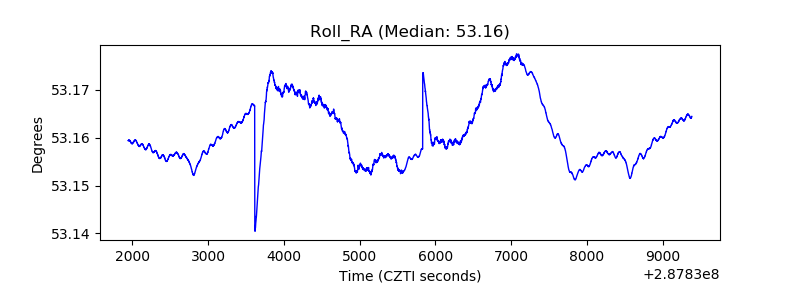 |
| Veto Counter |  |