| Param | Original file | Final file |
|---|---|---|
| Filename | modeM0/AS1A06_006T01_9000002720_18285cztM0_level2.evt | modeM0/AS1A06_006T01_9000002720_18285cztM0_level2_quad_clean.evt |
| Size (bytes) | 753,056,640 | 91,293,120 |
| Size | 718.2 MB | 87.1 MB |
| Events in quadrant A | 3,300,304 | 620,059 |
| Events in quadrant B | 3,543,511 | 619,657 |
| Events in quadrant C | 3,315,432 | 608,476 |
| Events in quadrant D | 12,183,581 | 438,195 |
| Mode SS | |||
|---|---|---|---|
| Quadrant | BADHDUFLAG | Total packets | Discarded packets |
| A | 0 | 140 | 0 |
| B | 0 | 140 | 0 |
| C | 0 | 140 | 0 |
| D | 0 | 140 | 0 |
| Mode M9 | |||
|---|---|---|---|
| Quadrant | BADHDUFLAG | Total packets | Discarded packets |
| A | 0 | 3 | 0 |
| B | 0 | 3 | 0 |
| C | 0 | 3 | 0 |
| D | 0 | 3 | 0 |
| Mode M0 | |||
|---|---|---|---|
| Quadrant | BADHDUFLAG | Total packets | Discarded packets |
| A | 0 | 14288 | 1 |
| B | 0 | 14877 | 1 |
| C | 0 | 14334 | 1 |
| D | 0 | 40951 | 1 |
| Quadrant | Total seconds | Saturated seconds | Saturation percentage |
|---|---|---|---|
| A | 6845 | 108 | 1.577794% |
| B | 6846 | 123 | 1.796670% |
| C | 6846 | 121 | 1.767455% |
| D | 6846 | 3407 | 49.766287% |
Noise dominated data is calculated using 1-second bins in cleaned event files. If a bin has >2000 counts, and if more than 50% of those come from <1% of pixels, then it is considered to be noise-dominated and hence unusable.
| Quadrant | # 1 sec bins | Bins with >0 counts | Bins with >2000 counts | High rate bins dominated by noise | Noise dominated (total time) | Noise dominated (detector-on time) | Marked lightcurve |
|---|---|---|---|---|---|---|---|
| A | 7170 | 6847 | 2 | 2 | 0.03% | 0.03% | 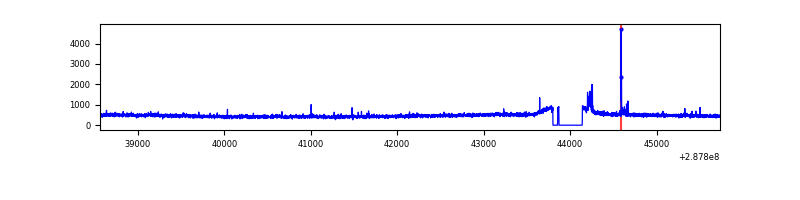 |
| B | 7171 | 6848 | 12 | 12 | 0.17% | 0.18% | 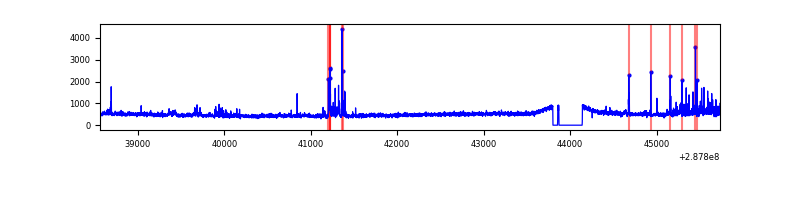 |
| C | 7171 | 6848 | 5 | 5 | 0.07% | 0.07% | 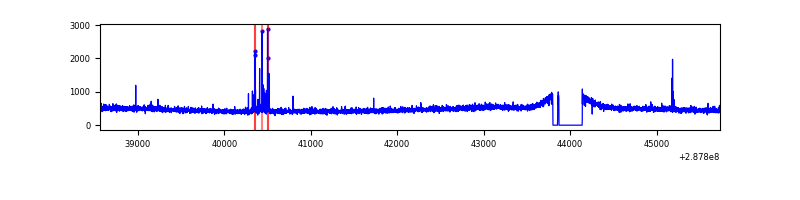 |
| D | 7171 | 6848 | 2991 | 2991 | 41.71% | 43.68% | 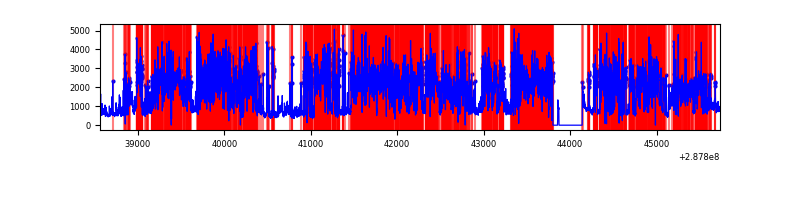 |
Top three noisy pixels from each quadrant. If the there are fewer than three noisy pixels in the level2.evt file, extra rows are filled as -1
| Pixel properties | Quadrant properties | ||||||
|---|---|---|---|---|---|---|---|
| Quadrant | DetID | PixID | Counts | Sigma | Mean | Median | Sigma |
| A | 15 | 174 | 56714 | 325.7 | 842 | 824 | 171.6 |
| A | 0 | 226 | 7542 | 39.15 | 842 | 824 | 171.6 |
| A | 12 | 194 | 6161 | 31.1 | 842 | 824 | 171.6 |
| B | 7 | 220 | 105318 | 647.86 | 838 | 817 | 161.3 |
| B | 0 | 197 | 54573 | 333.26 | 838 | 817 | 161.3 |
| B | 4 | 216 | 29058 | 175.08 | 838 | 817 | 161.3 |
| C | 14 | 238 | 122776 | 643.85 | 801 | 807 | 189.4 |
| C | 0 | 207 | 55083 | 286.51 | 801 | 807 | 189.4 |
| C | 8 | 128 | 5707 | 25.87 | 801 | 807 | 189.4 |
| D | 1 | 52 | 6459383 | 43411.29 | 606 | 587 | 148.8 |
| D | 7 | 238 | 2684307 | 18038.0 | 606 | 587 | 148.8 |
| D | 13 | 168 | 606424 | 4071.99 | 606 | 587 | 148.8 |
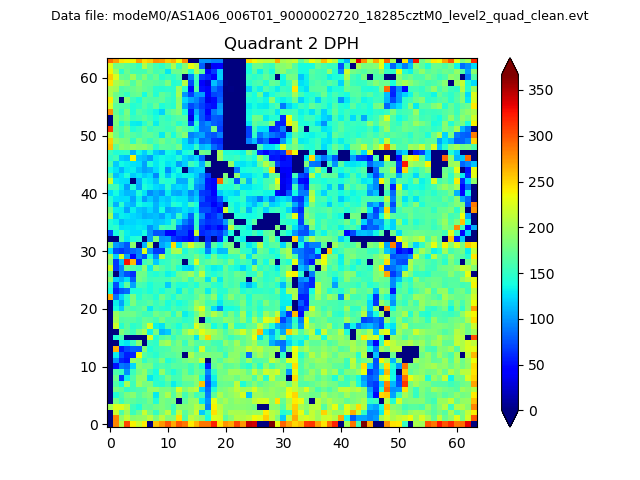
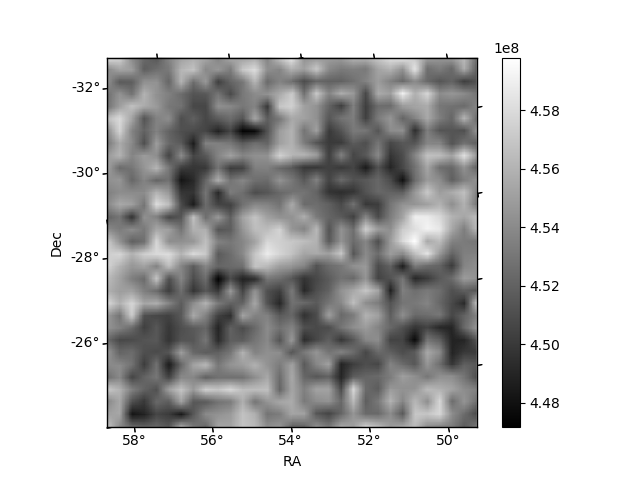
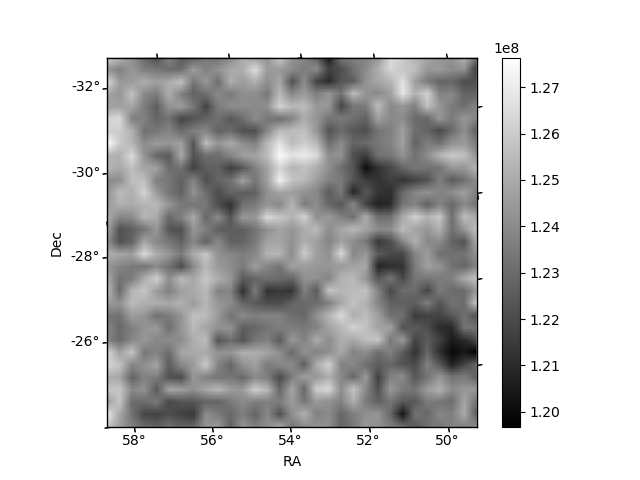
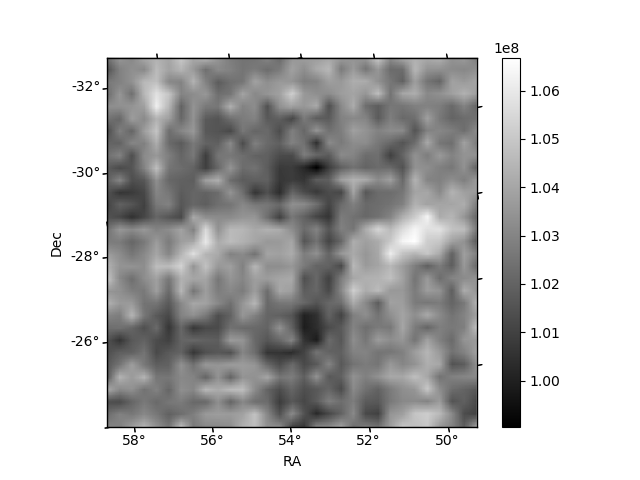
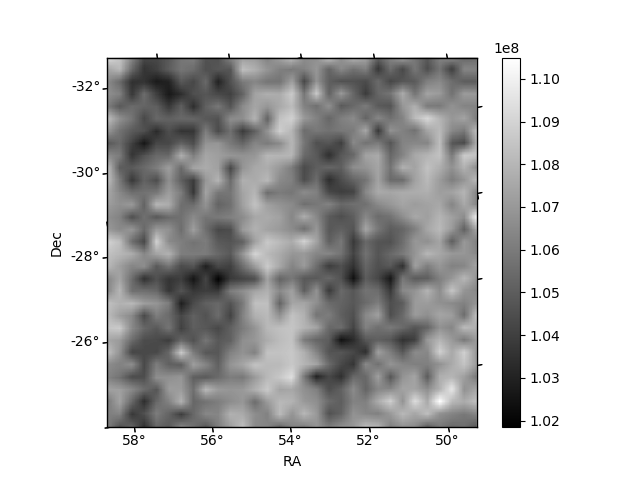
Histogram calculated using DETX and DETY for each event in the final _common_clean file
| Quadrant A | 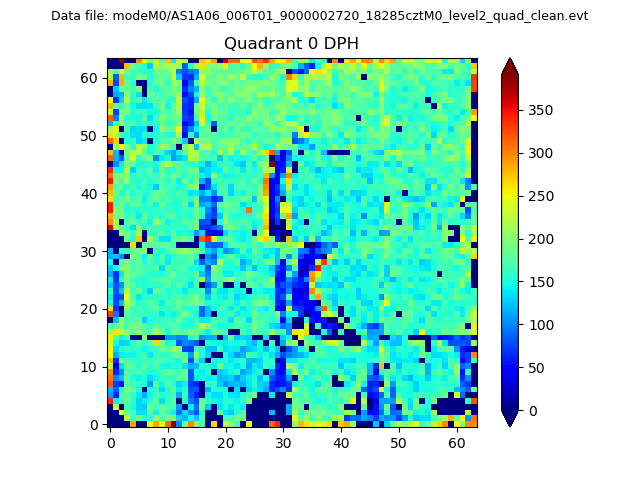 |
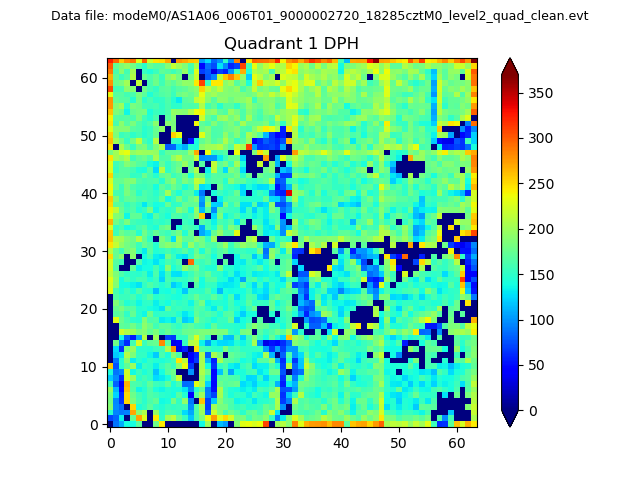 |
Quadrant B |
|---|---|---|---|
| Quadrant D | 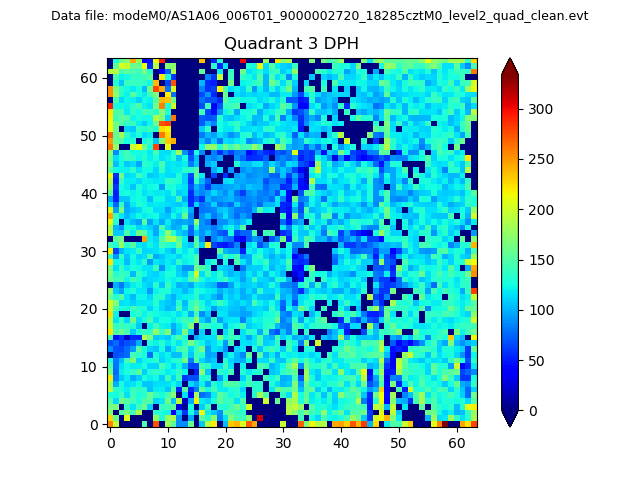 |
 |
Quadrant C |
| Plot type | Count rate plots | Images |
|---|---|---|
| Comparison with Poisson distribution Blue bars denote a histogram of data divided into 1 sec bins. Red curve is a Poisson curve with rate = median count rate of data. |
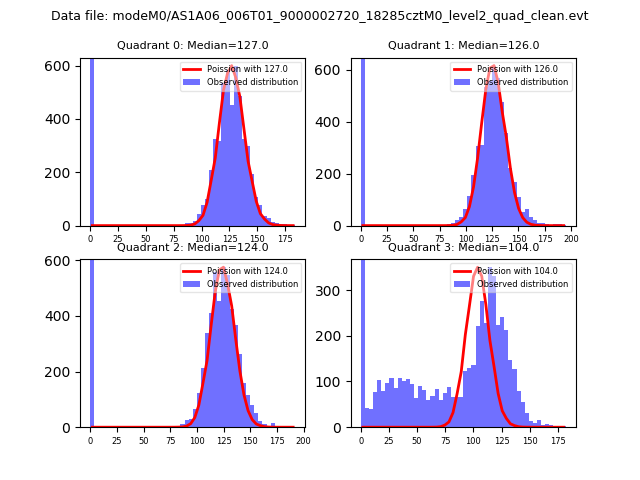 |
 |
| Quadrant-wise count rates Data is divided into 100 sec bins |
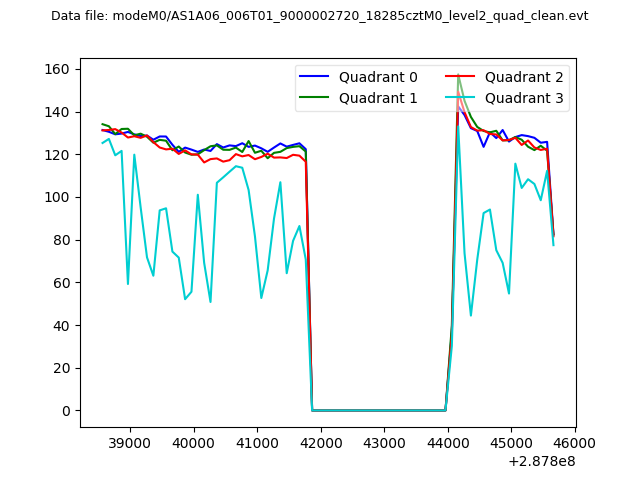 |
|
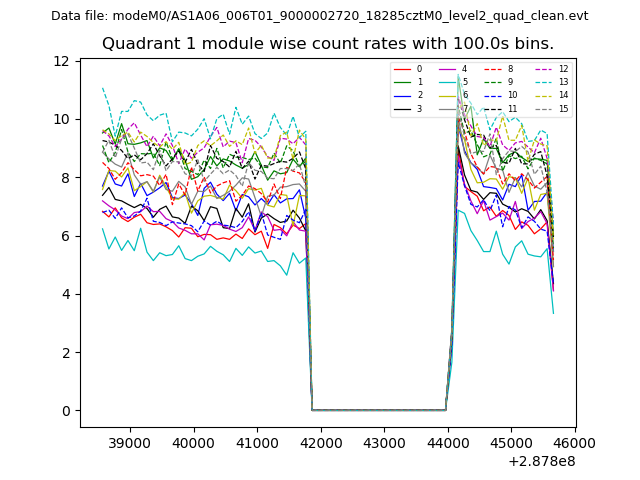
| Module-wise count rates for Quadrant A Data is divided into 100 sec bins |
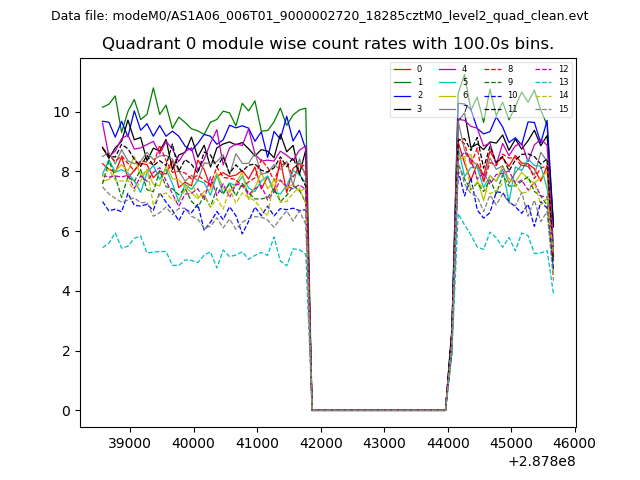 |
 |
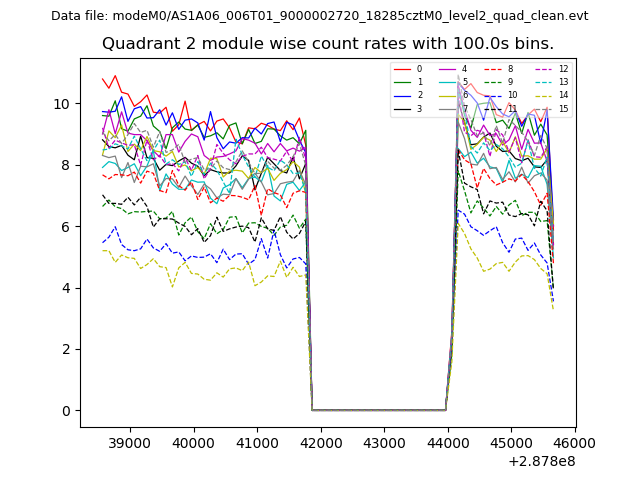
| Module-wise count rates for Quadrant B Data is divided into 100 sec bins |
 |
 |
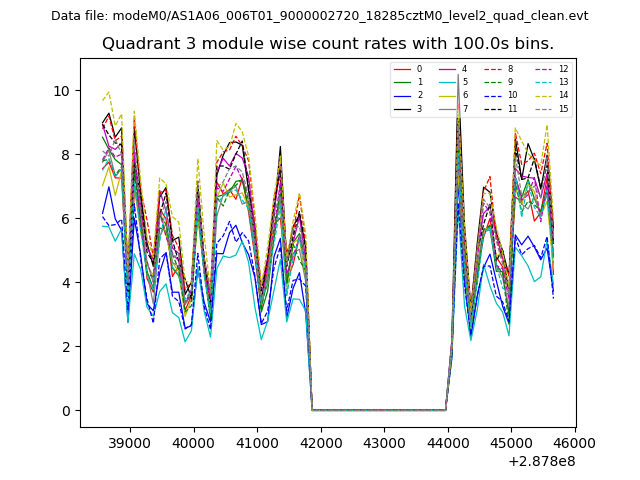
| Module-wise count rates for Quadrant C Data is divided into 100 sec bins |
 |
 |
| Module-wise count rates for Quadrant D Data is divided into 100 sec bins |
 |
 |
| Parameter | Plot |
|---|---|
| CZT HV Monitor | 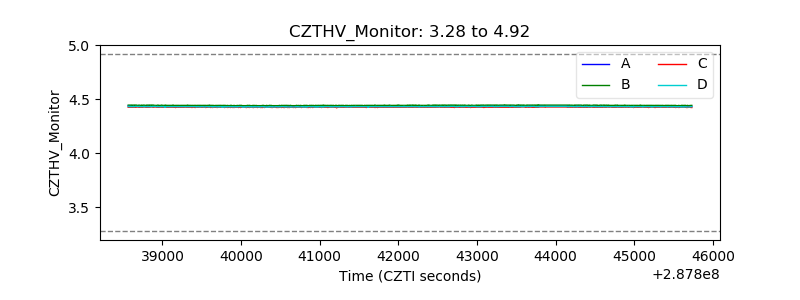 |
| D_VDD | 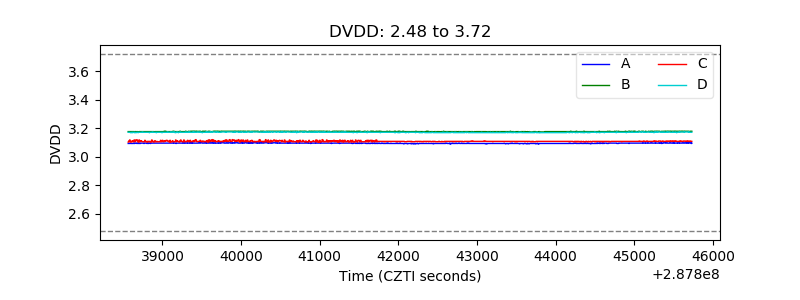 |
| Temperature 1 | 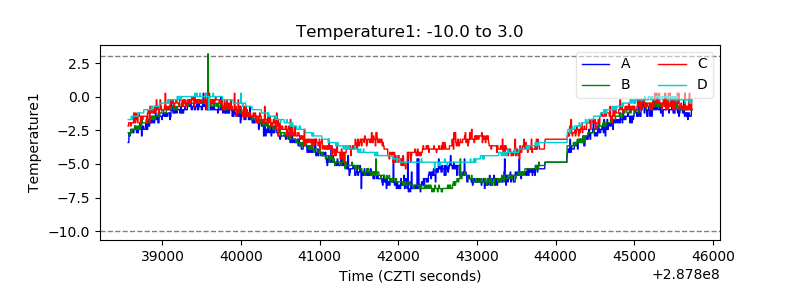 |
| Veto HV Monitor | 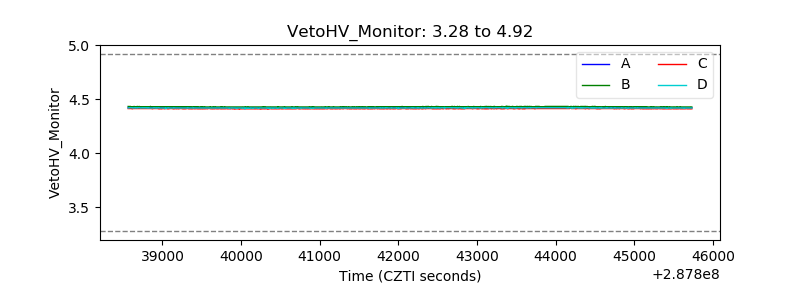 |
| Veto LLD | 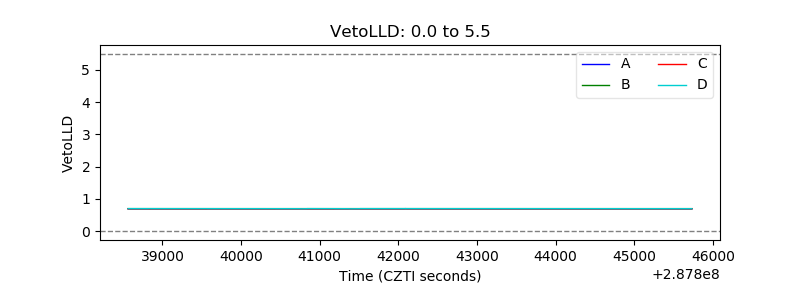 |
| Alpha Counter | 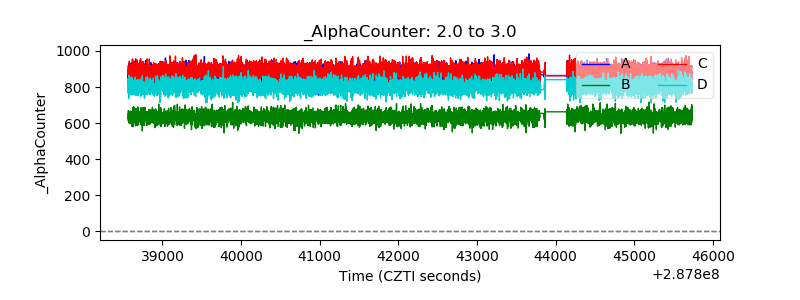 |
| _CPM_Rate | 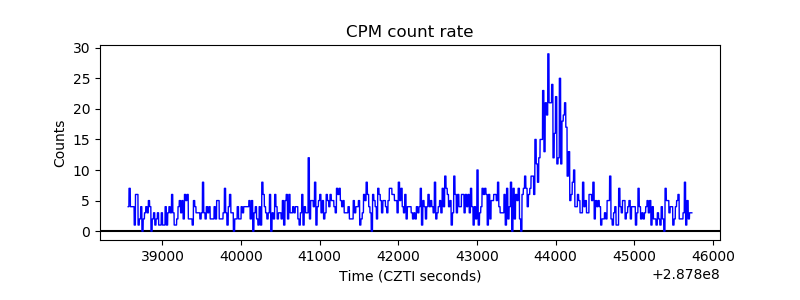 |
| CZT Counter | 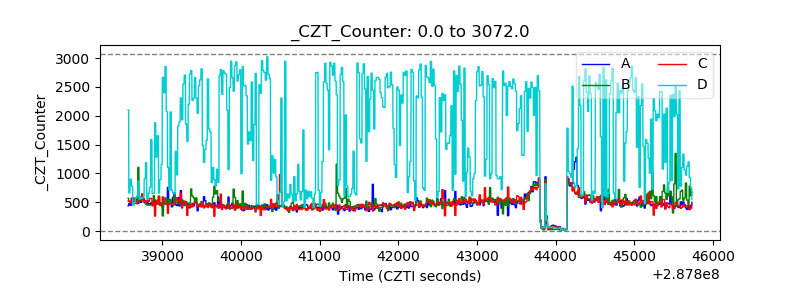 |
| +2.5 Volts monitor |  |
| +5 Volts monitor |  |
| _ROLL_ROT | 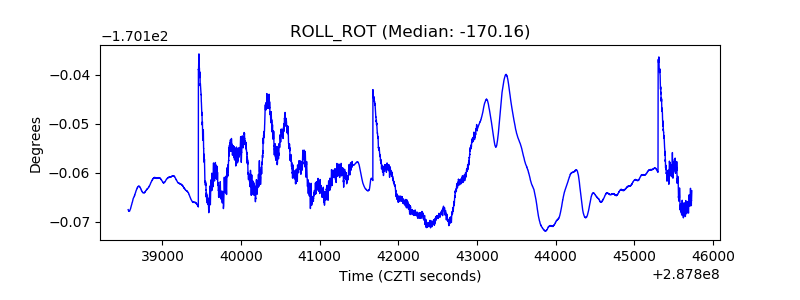 |
| _Roll_DEC | 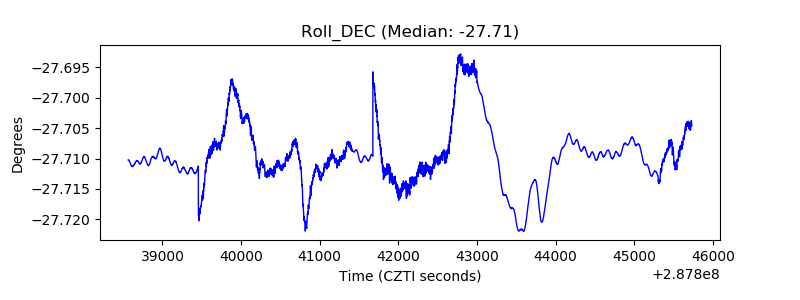 |
| _Roll_RA | 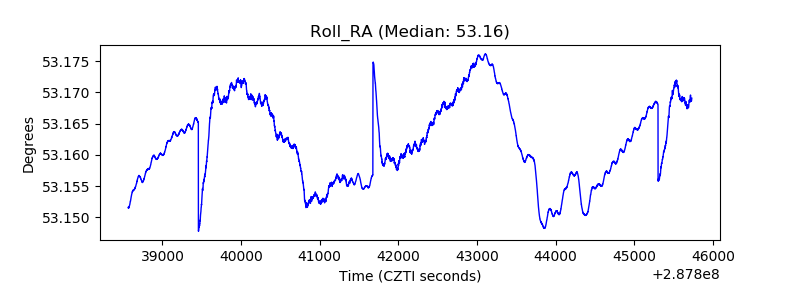 |
| Veto Counter | 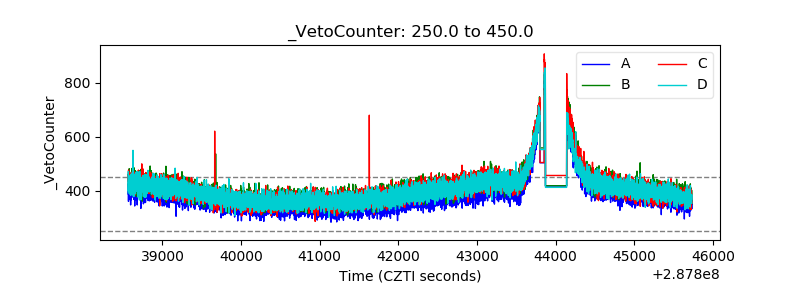 |